BTC On-Chain Analysis: What Caused Recent Short-Squeeze
2 min readA look at on-chain indicators for BTC (BTC), more specifically funding rates and open interest in order to determine what caused the short squeeze of July 26.
The negative funding rates and high levels of open interest were likely the catalysts for the July 26 short squeeze.
What is the funding rate?
Funding rates are a measure of the payment that futures trades are obliged to pay in order to keep their positions open. They are expressed in percentage terms.
If the funding rate is negative, it stipulates that traders with short positions are obliged to pay the funding rate to those with long positions. The opposite holds true for positive funding rates.
As an indicator, the funding rate can be used to determine the sentiment of the market. For example, negative funding rates are a sign of a negative sentiment. This is because traders have such strong beliefs that the market is going down that they are paying a premium in order to short it.
However, extreme values can often be seen as a sign of euphoria, marking bottoms or tops, depending on whether the funding rate is negative or positive.
Funding rates in July
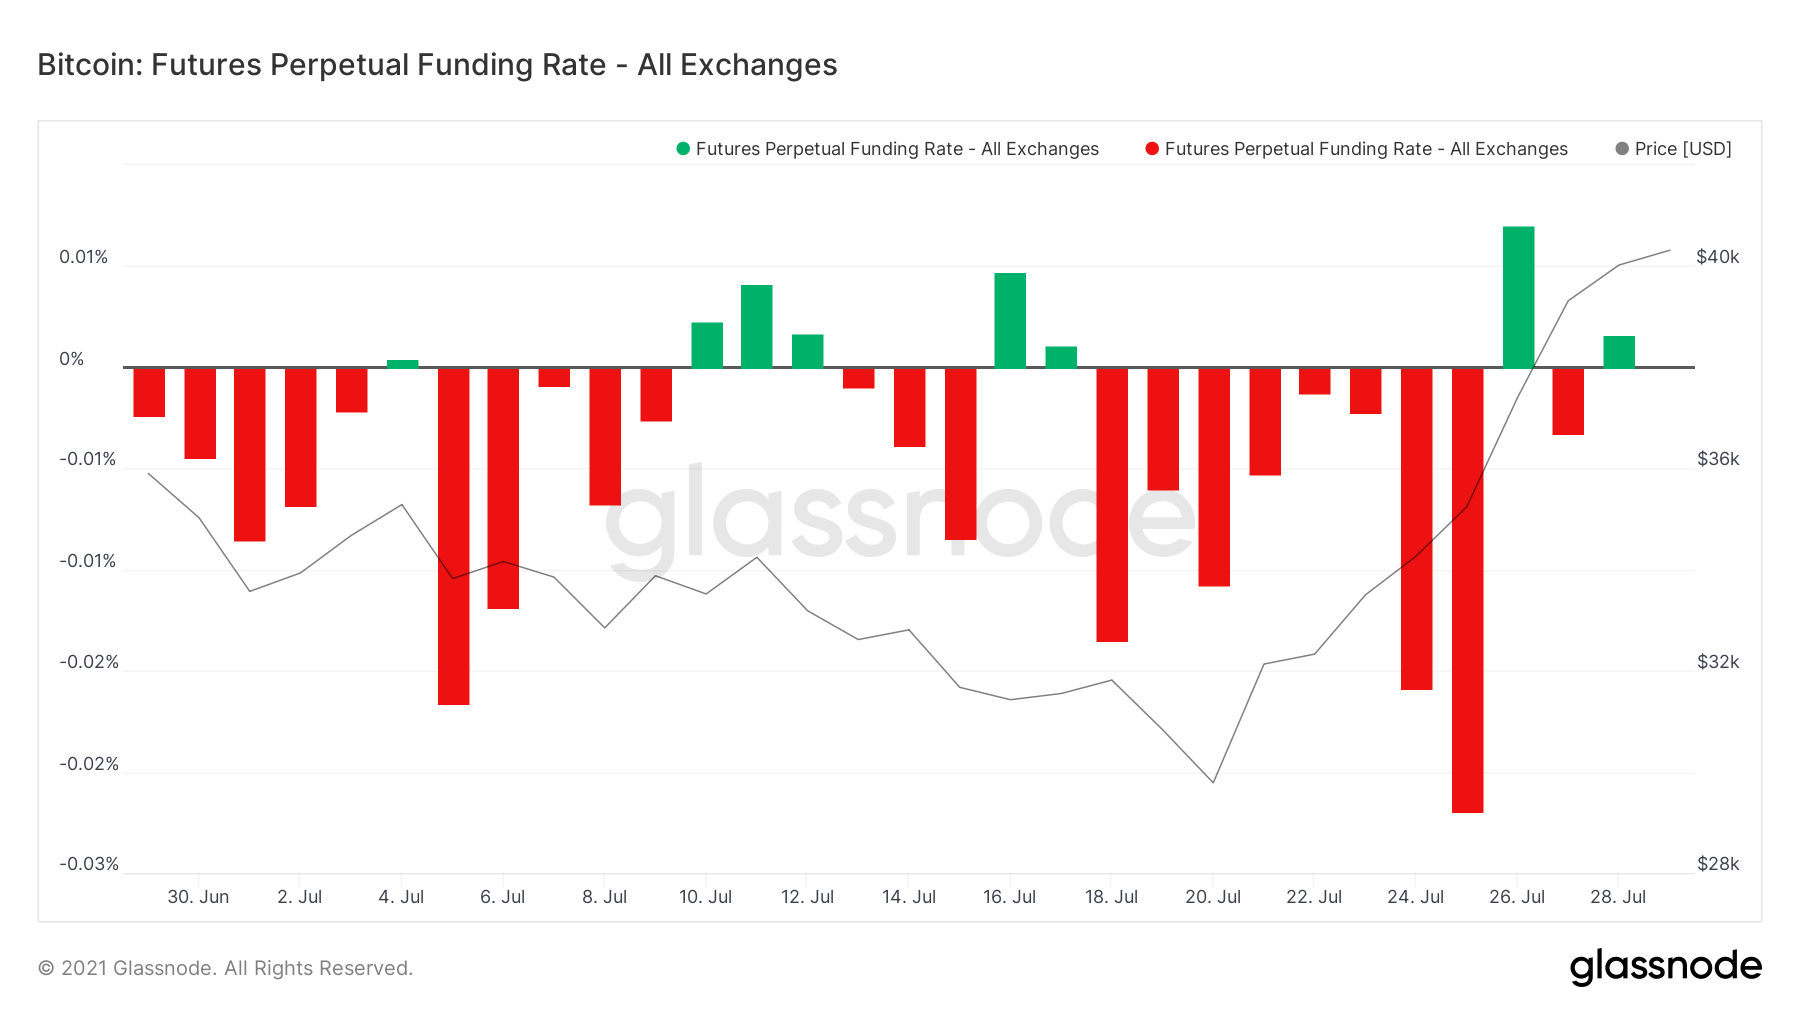
The funding rates have been negative for the majority of the past 30 days. They culminated with a low of -0.0225% on July 25. This occurred the very day prior to the short squeeze.
While the BTC price had actually been increasing since July 20, the rate of increase greatly accelerated on July 26.
The funding rate turned positive on July 26, fell back to negative territory the next day, but has turned positive once more.
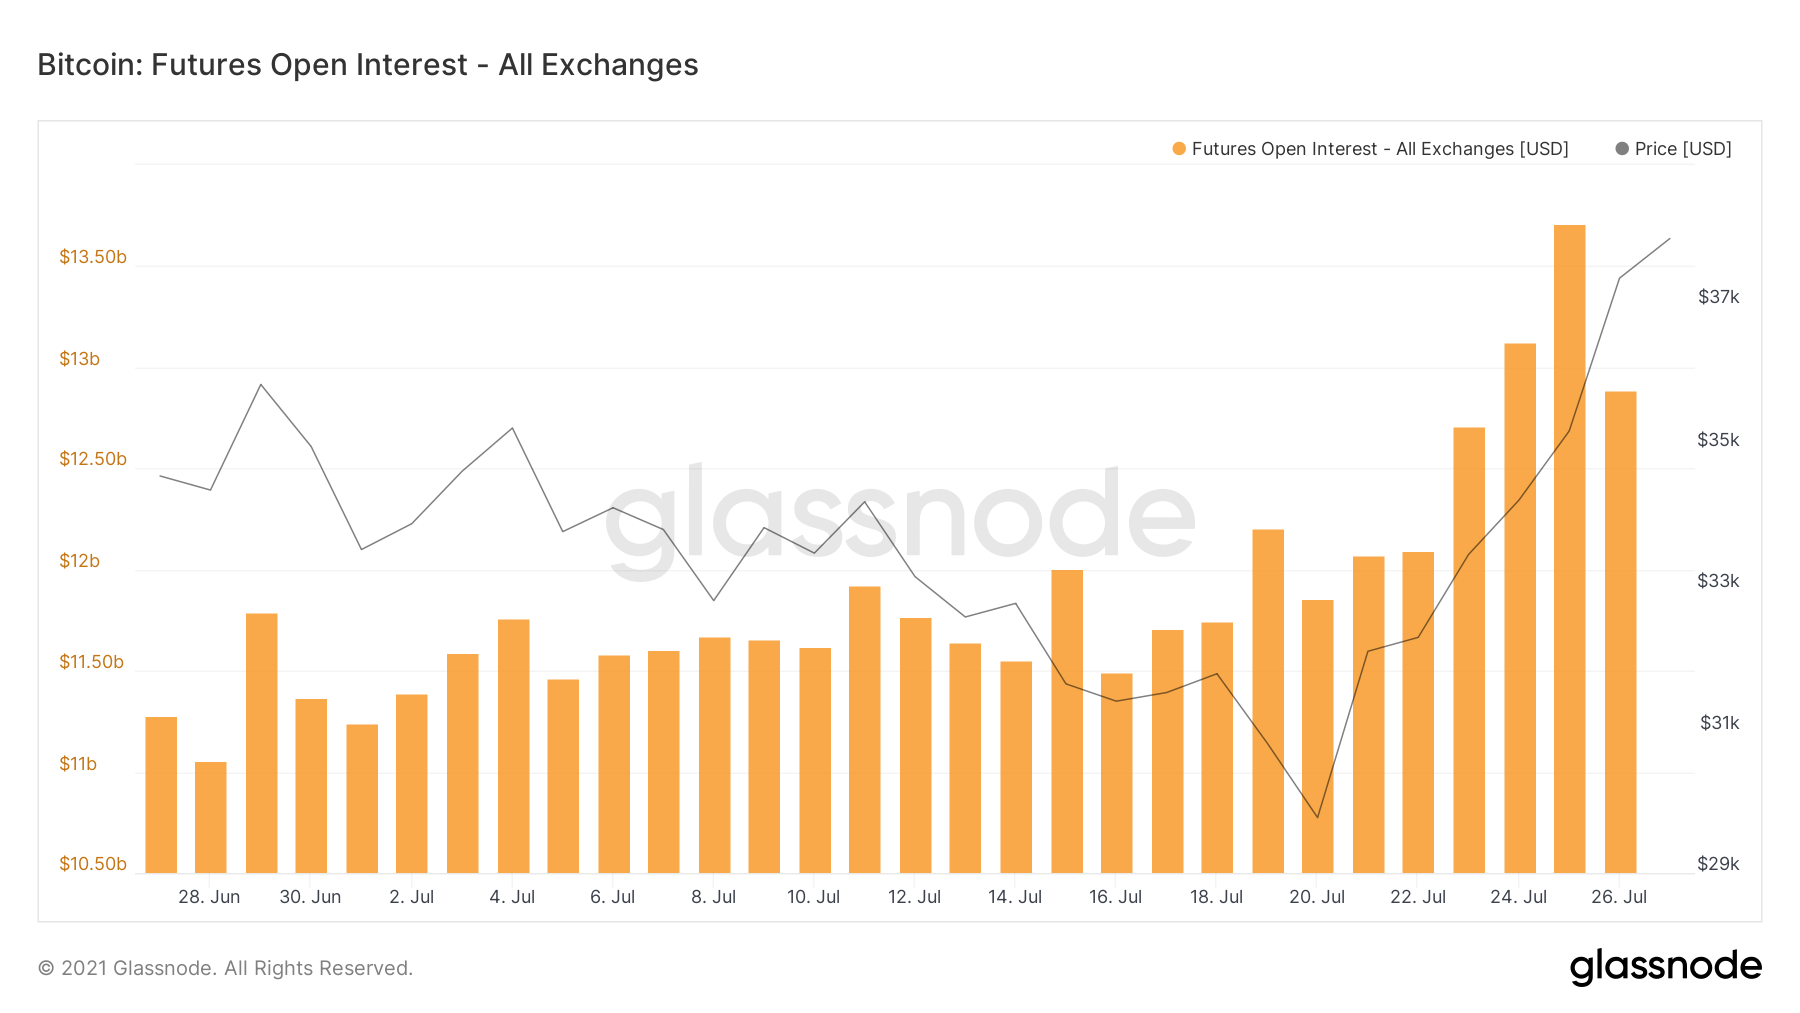
Futures open interest also reached a peak of $13.708 Billion on July 25. This is likely to have been mostly on the short sides, since the increased interest in shorting caused the funding rates to go negative. This perfectly set up the table for a short-squeeze.
Open interest has been decreasing since.
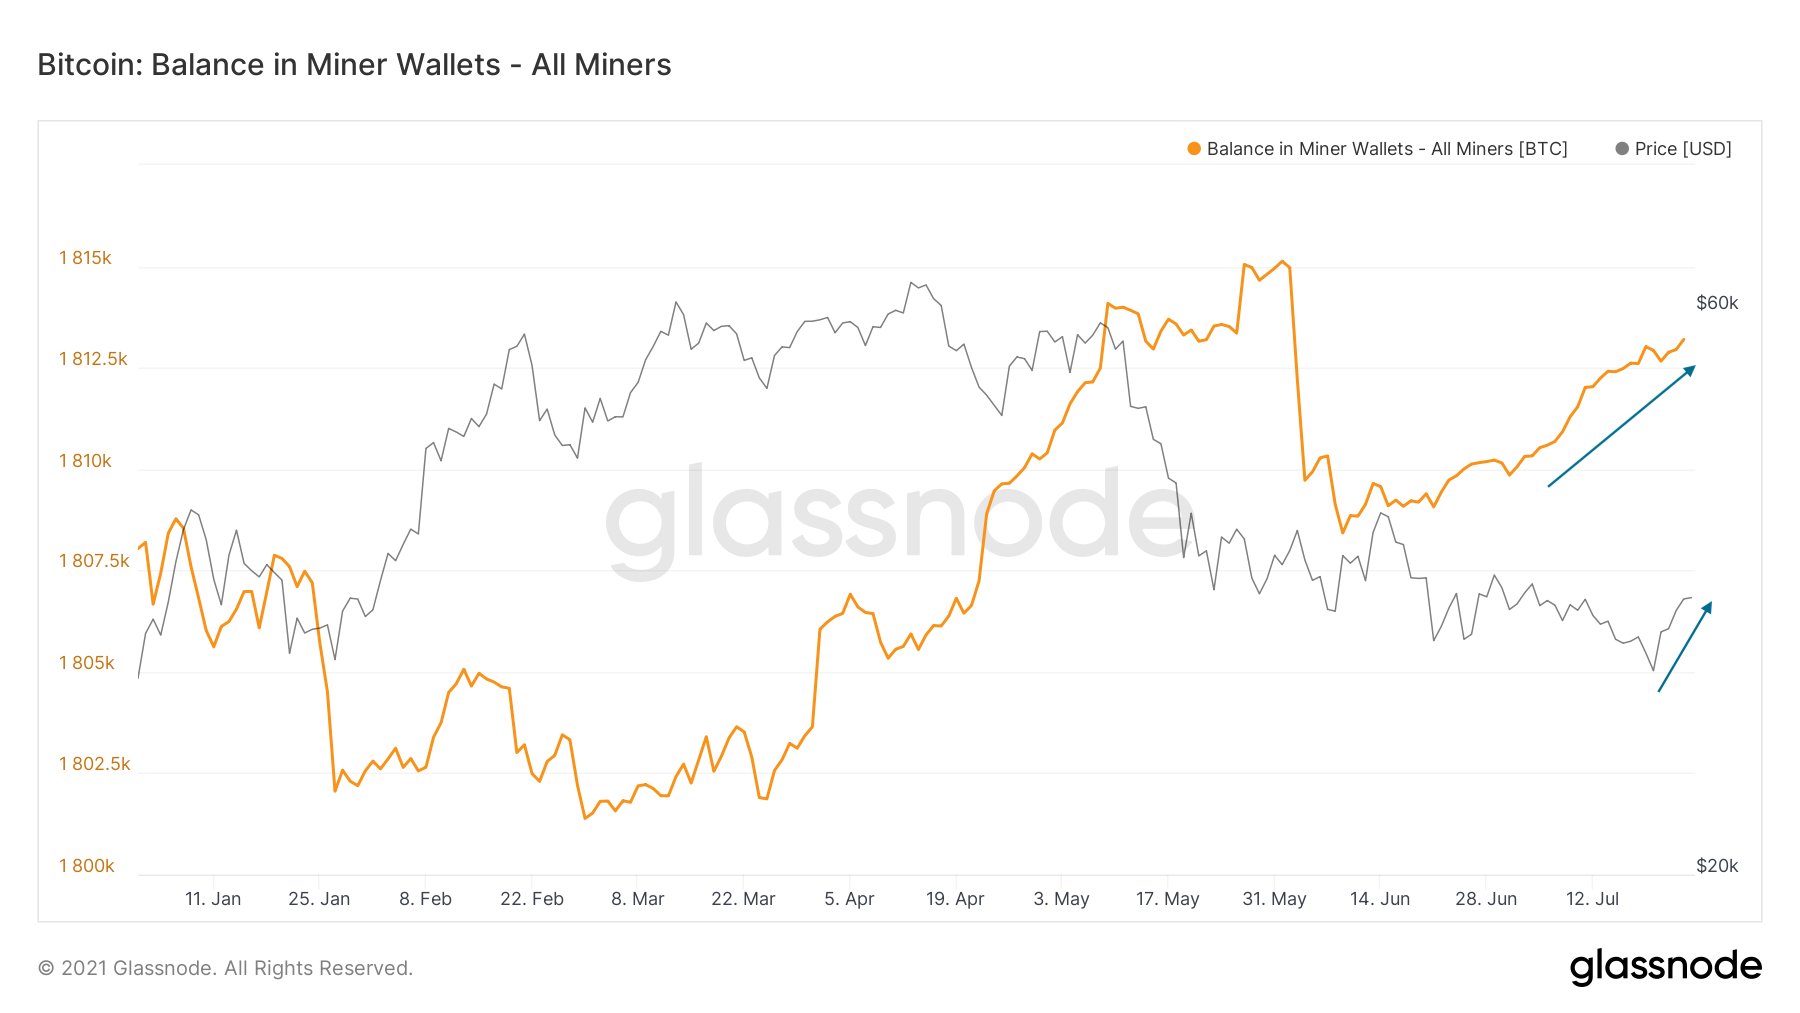
Well-known investment officer @mskvsk also noted that funding rates have finally turned positive.
Furthermore, he showed that miner accounts have been consistently accumulating in May despite the negative sentiment in the market. This shows that the conviction of long-term holders for the market is still strong.
Liquidations
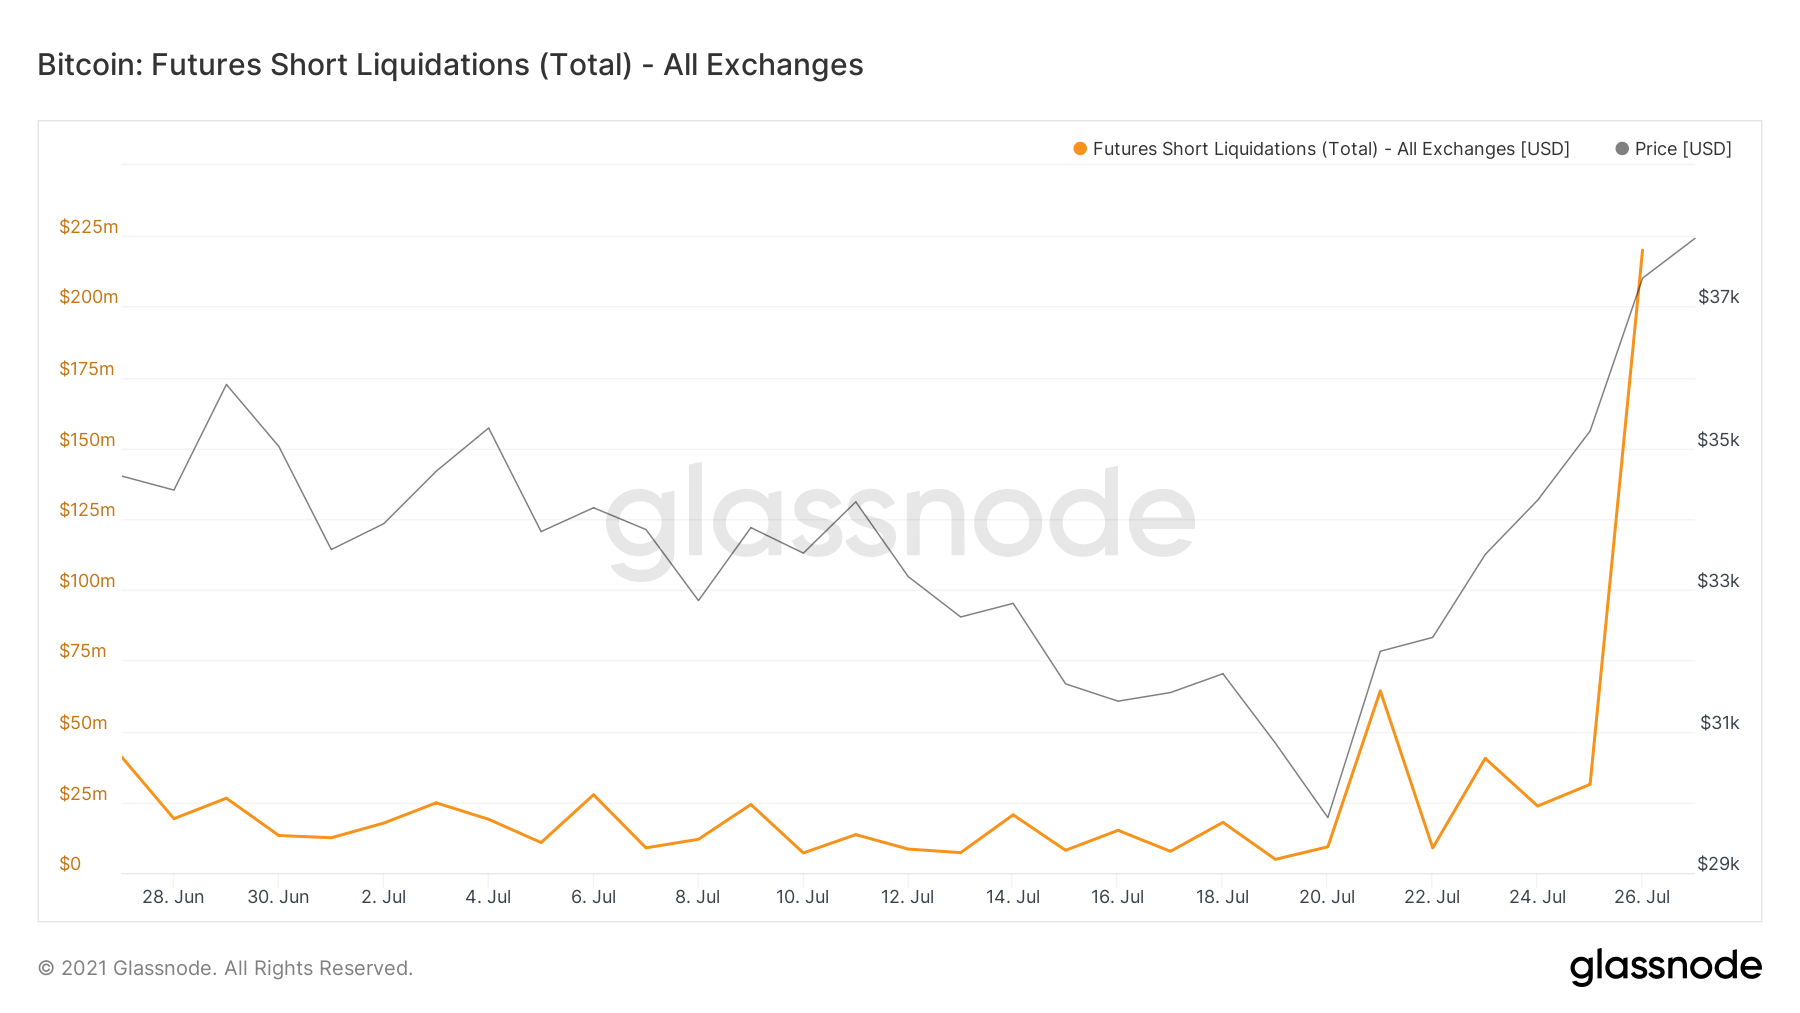
Since the bulk of the increase transpired in the early hours of July 26, the majority of liquidations occurred that same day
July 26 measured $219 million in liquidations of short positions, more than seven times higher than the figure from the previous day.
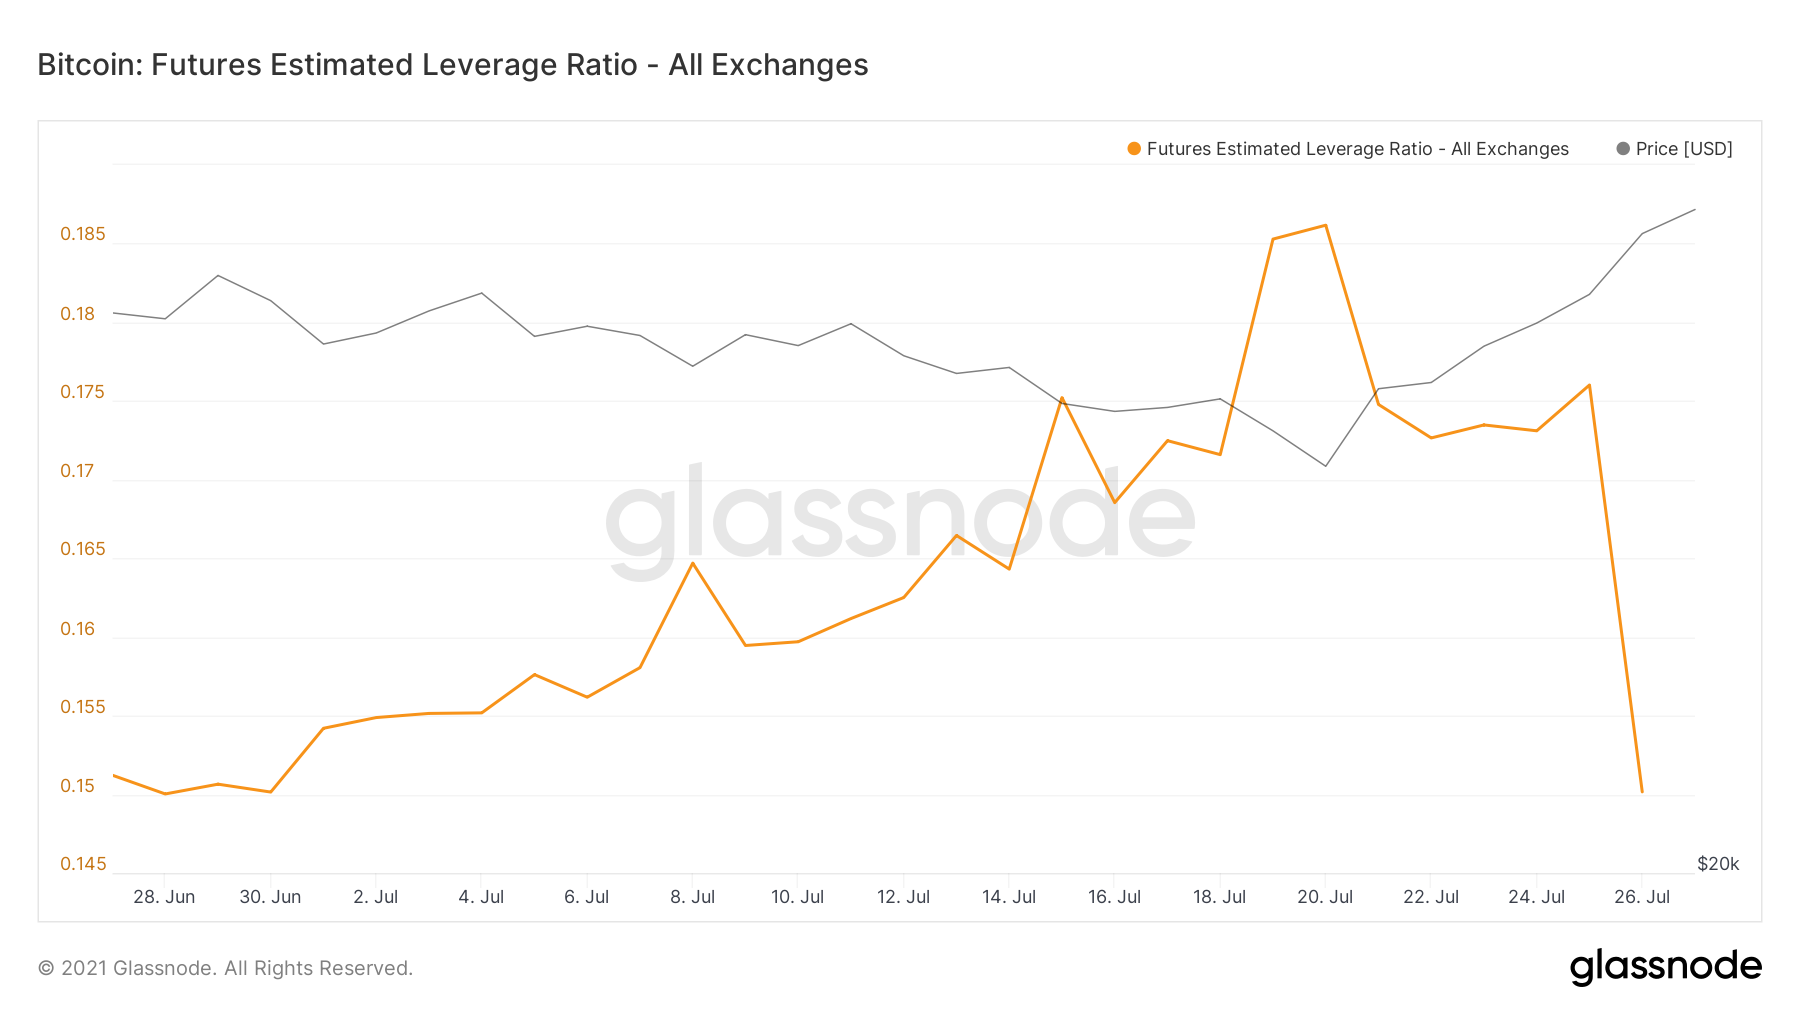
Finally, the future’s estimated leverage ratio has finally reset after spiking considerably on July 20 and 25. It measures the ratio between open interest on an exchange and the balance of that exchange.
It was 0.176 on July 25, and has fallen to 0.15 since.
For BeInCrypto’s latest BTC (BTC) analysis, click here.
The post BTC On-Chain Analysis: What Caused Recent Short-Squeeze appeared first on BeInCrypto.


