BTCD Reaches Its Highest Levels Since 2019
2 min readThe Bitcoin Dominance Rate (BTCD) has broken out from a long-term resistance line and is aiming to reach a long-term resistance area near 71%.
While the long-term trend seems bullish, a short-term rejection and correction is likely once BTCD reaches this resistance area.
Long-Term Breakout
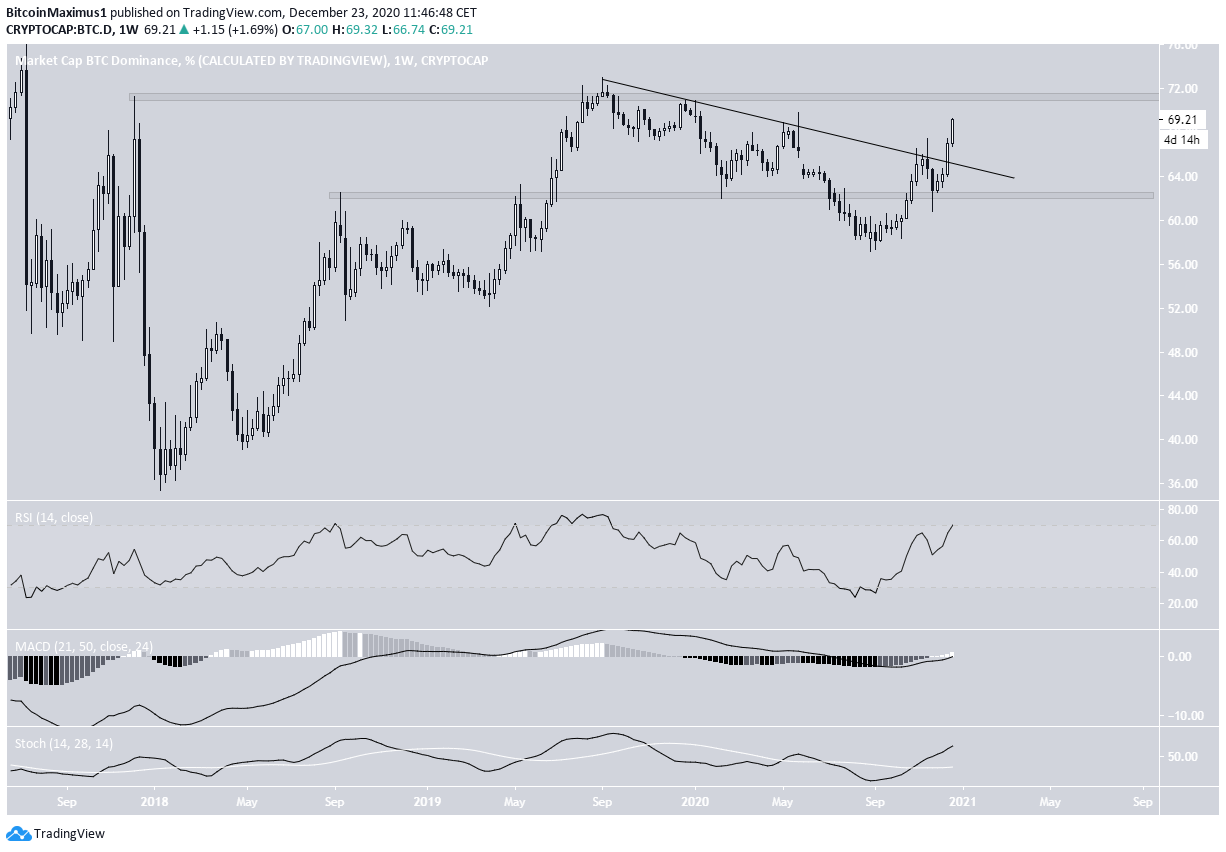
During the week of Dec. 14 – 21, BTCD broke out from a descending resistance line that had previously been in place since Aug. 2019.
BTCD continued its ascent this week and is heading towards the closest resistance area at 71%. BTCD has not traded above this area since Sept 2019, the high of the descending resistance line.
The closest support area is at 62.5%.
Technical indicators are bullish, supporting the possibility that the upward move continues. This is especially noticeable since the MACD has just crossed above the 0 line while the RSI is in the process of moving above 70.
A breakout above the 71% resistance area could trigger an even sharper upward movement due to the lack of overhead resistance.

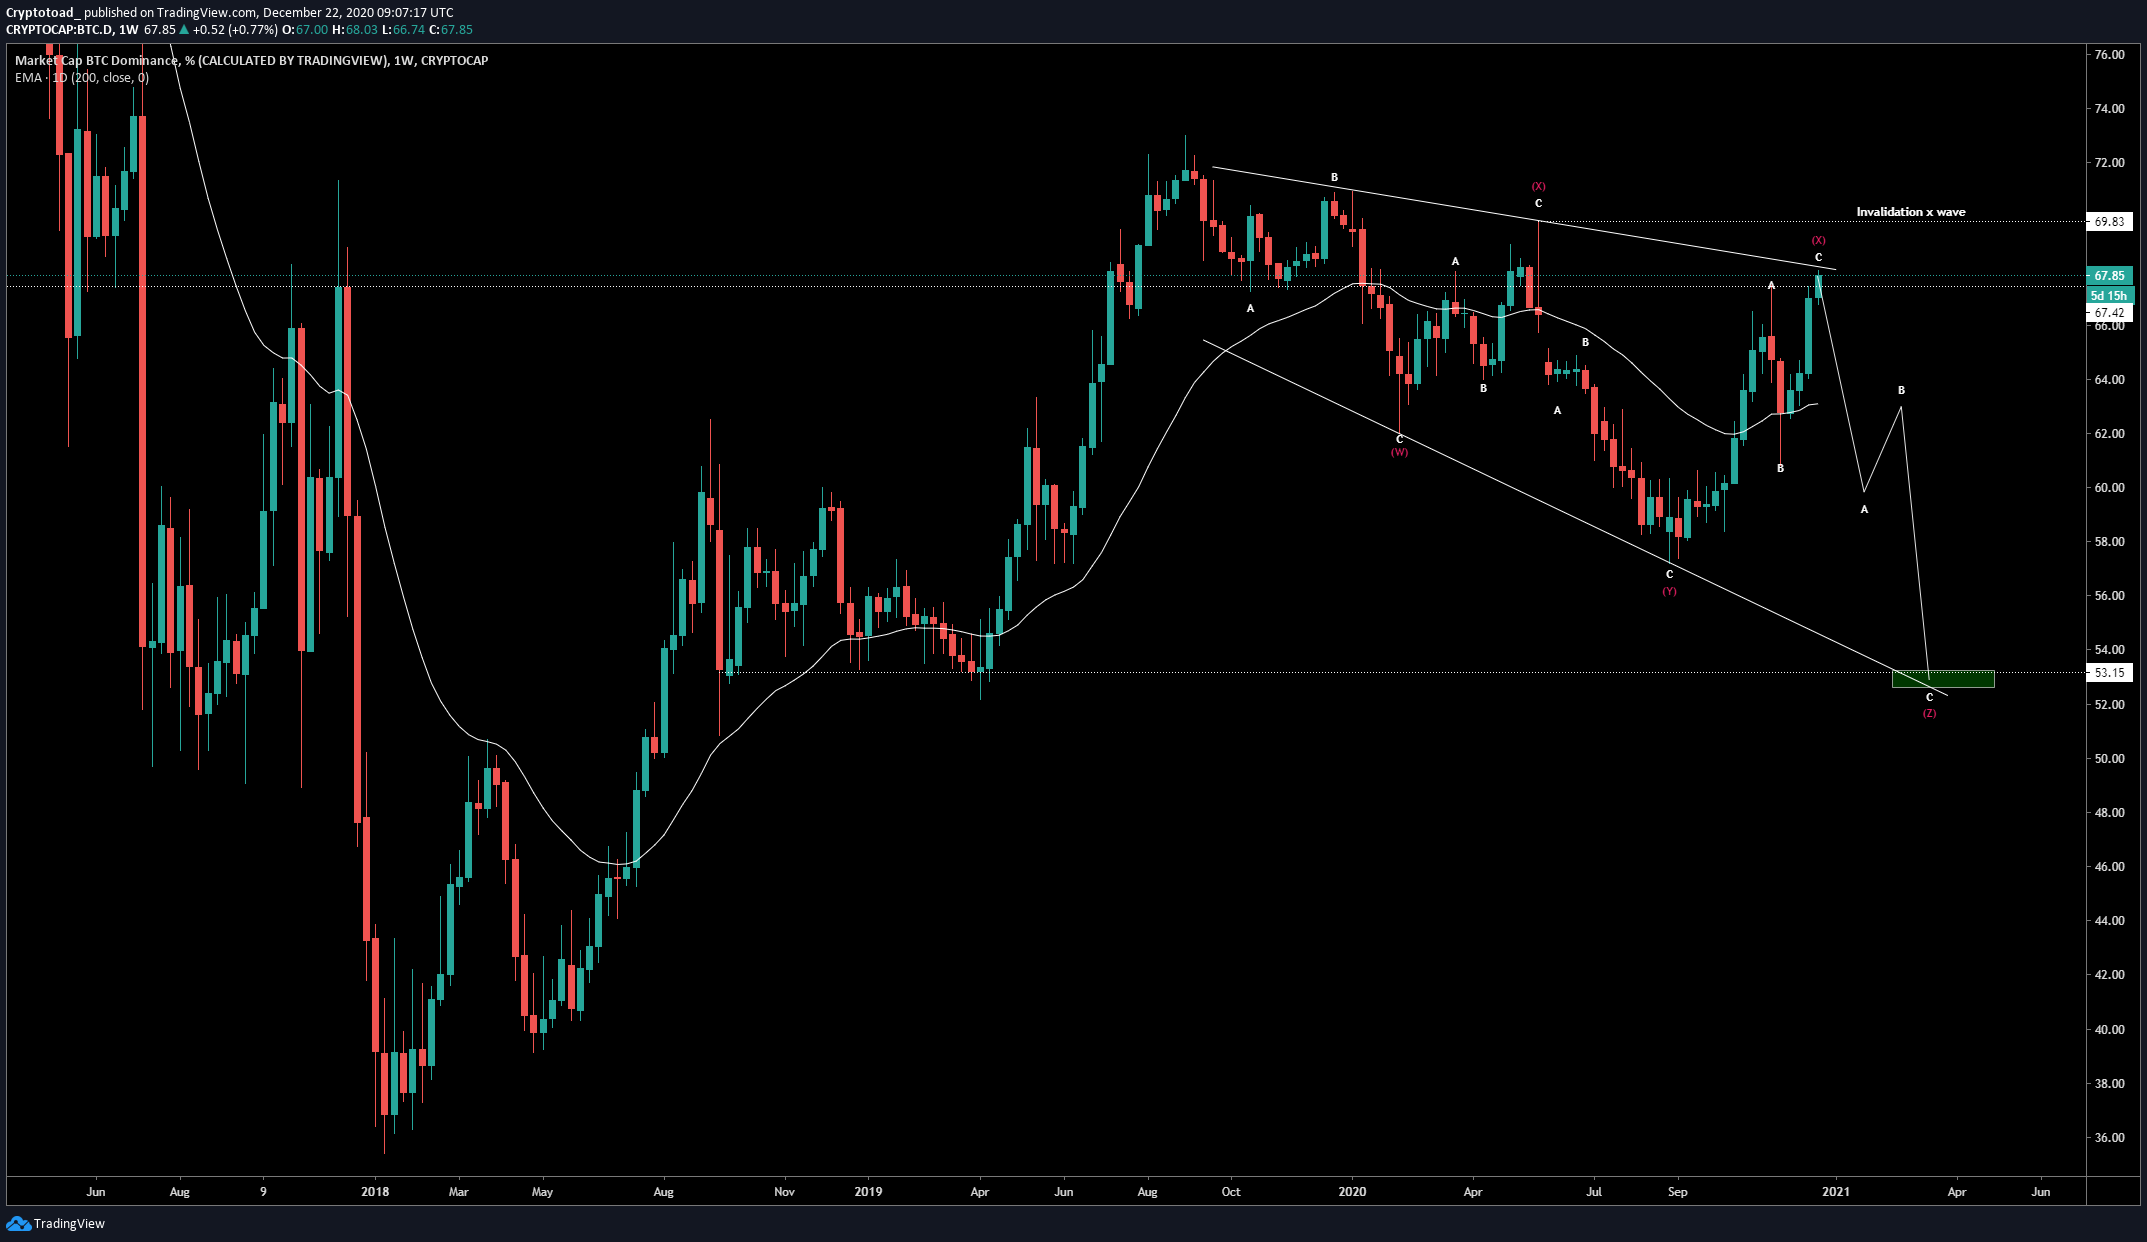
Cryptocurrency trader @Mesawine1 outlined a BTCD chart, stating that while it’s currently at a strong resistance level, a breakout above could trigger a very sharp continuation move.
However, he believes that BTCD will decline instead. While the long-term indicators are bullish, as seen above, traders should look at lower time-frames to determine where BTCD will head next.

Current Movement
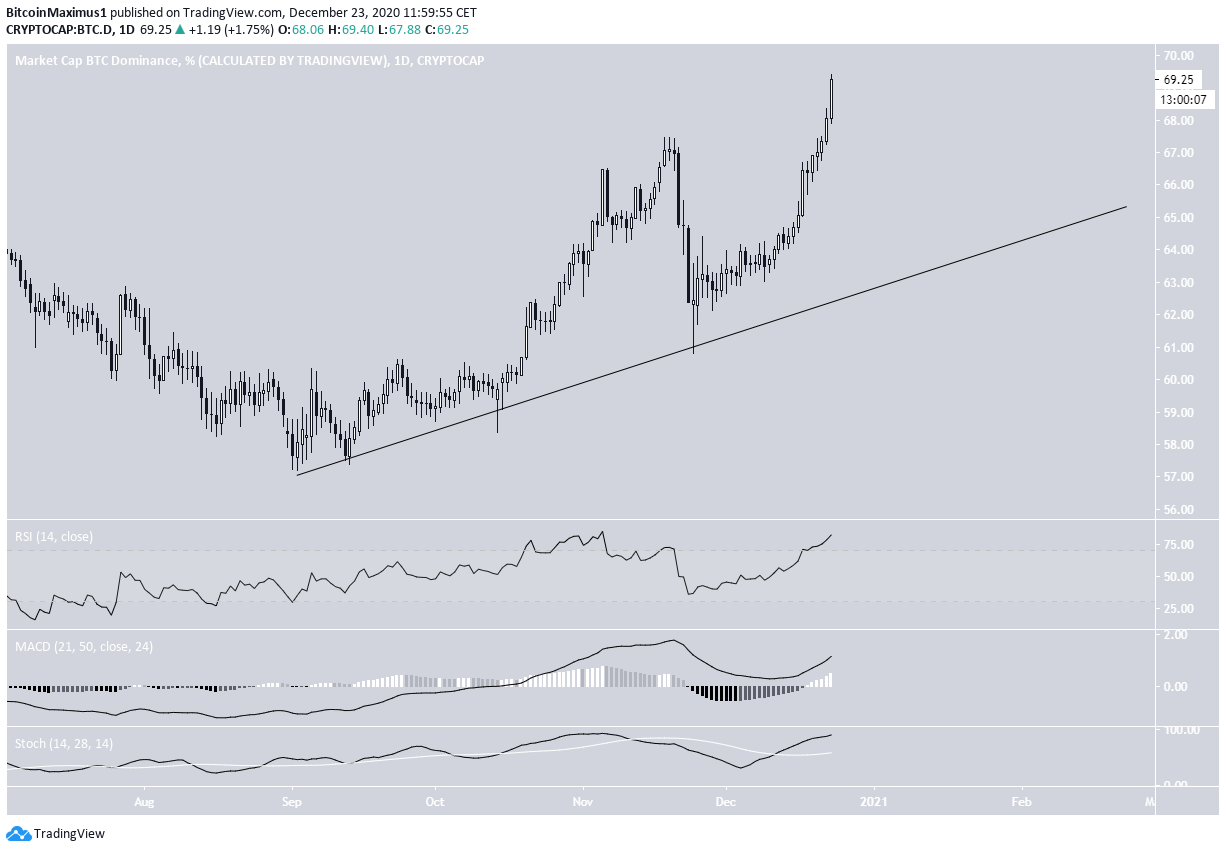
The daily chart for BTCD shows an ascending support line that has held since the beginning of Sept. Currently, BTCD is considerably above this line, suggesting that the move is overextended. A retracement back to validate this line is, therefore, possible.
However, similar to the weekly time-frame, technical indicators are bullish, supporting the continuation of the upward move.

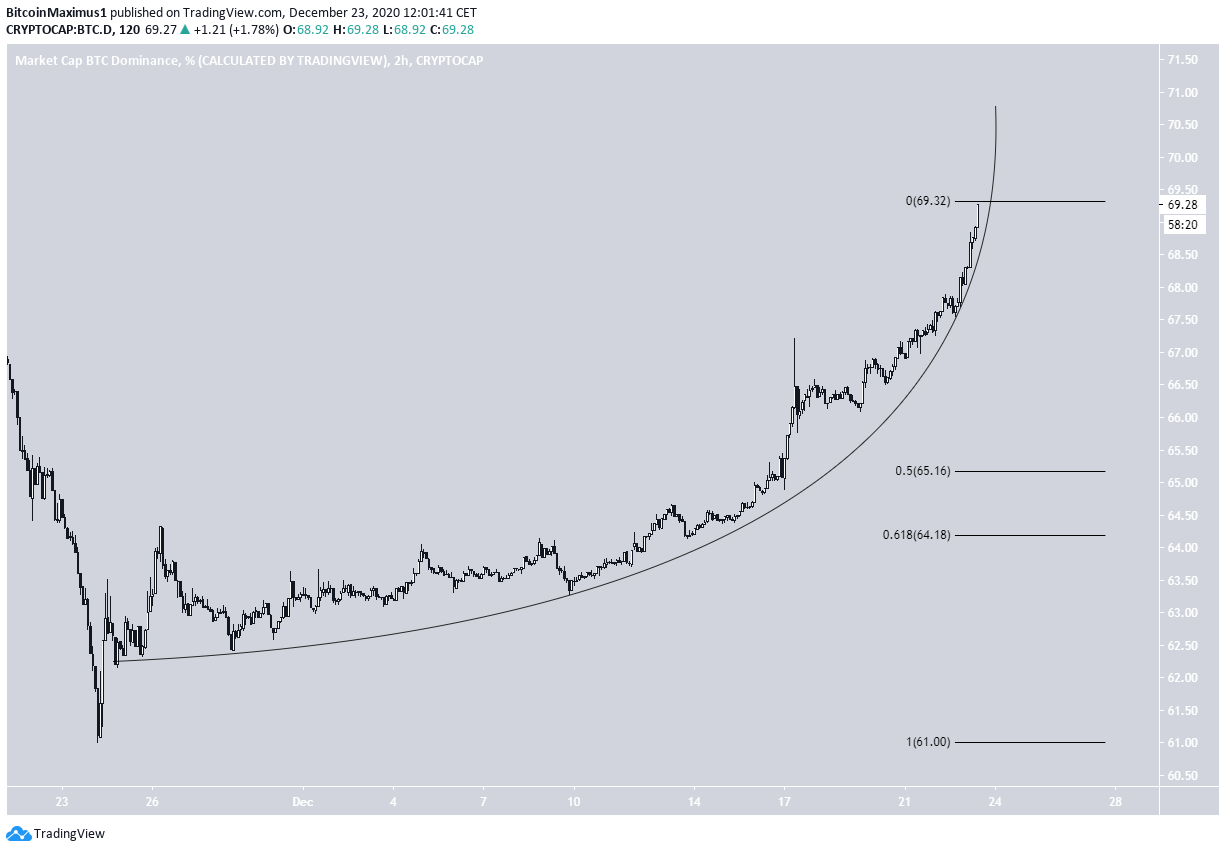
The first sign of an unsustainable rally comes from the two-hour chart, which shows a parabolic ascending support line. Once the parabola breaks, a sharp drop is likely.
This would also fit with the previously mentioned possibility of validating the ascending support line since the 0.5 – 0.618 Fib retracement levels at 64 – 65% coincide with this.

Conclusion
To conclude: the long-term trend for BTCD looks bullish, making an eventual breakout above the long-term 71% resistance area a strong possibility.
However, the short-term parabola is unsustainable. Therefore, a short-term corrective movement is expected before another attempt to break out.
For BeInCrypto’s latest Bitcoin (BTC) analysis, click here!
Disclaimer: Cryptocurrency trading carries a high level of risk and may not be suitable for all investors. The views expressed in this article do not reflect those of BeInCrypto.
The post BTCD Reaches Its Highest Levels Since 2019 appeared first on BeInCrypto.


