COMP Regains Footing, After New Yearly Low
2 min readCompound (COMP) has been decreasing since May 12 and reached a new yearly low on May 23.
While it has been increasing since, it has yet to confirm a bullish trend reversal.
COMP re-tests previous resistance
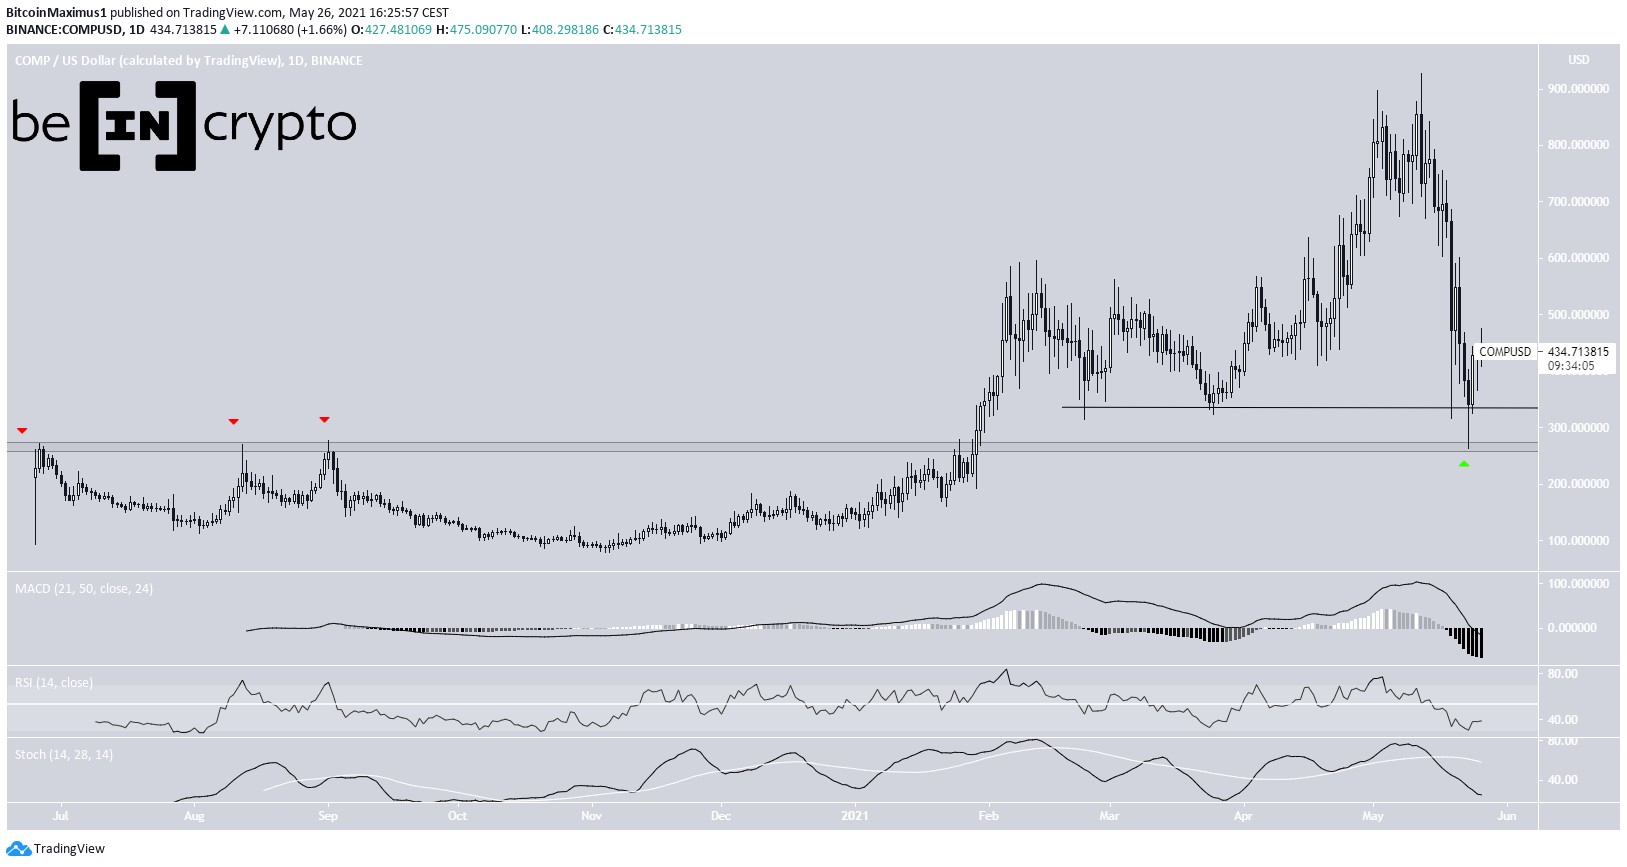
COMP has been decreasing since reaching an all-time high price of $913 on May 12. The decrease has been sharp, culminating with a low of $264 being reached on May 23.
However, the decrease also served to validate the previous resistance area of $265 as support. The area thrice acted as resistance from July to September 2020.
While the token has been moving upwards since May 23, technical indicators are still firmly bearish. The MACD is negative, the RSI is below 50, and the Stochastic oscillator has made a bearish cross.

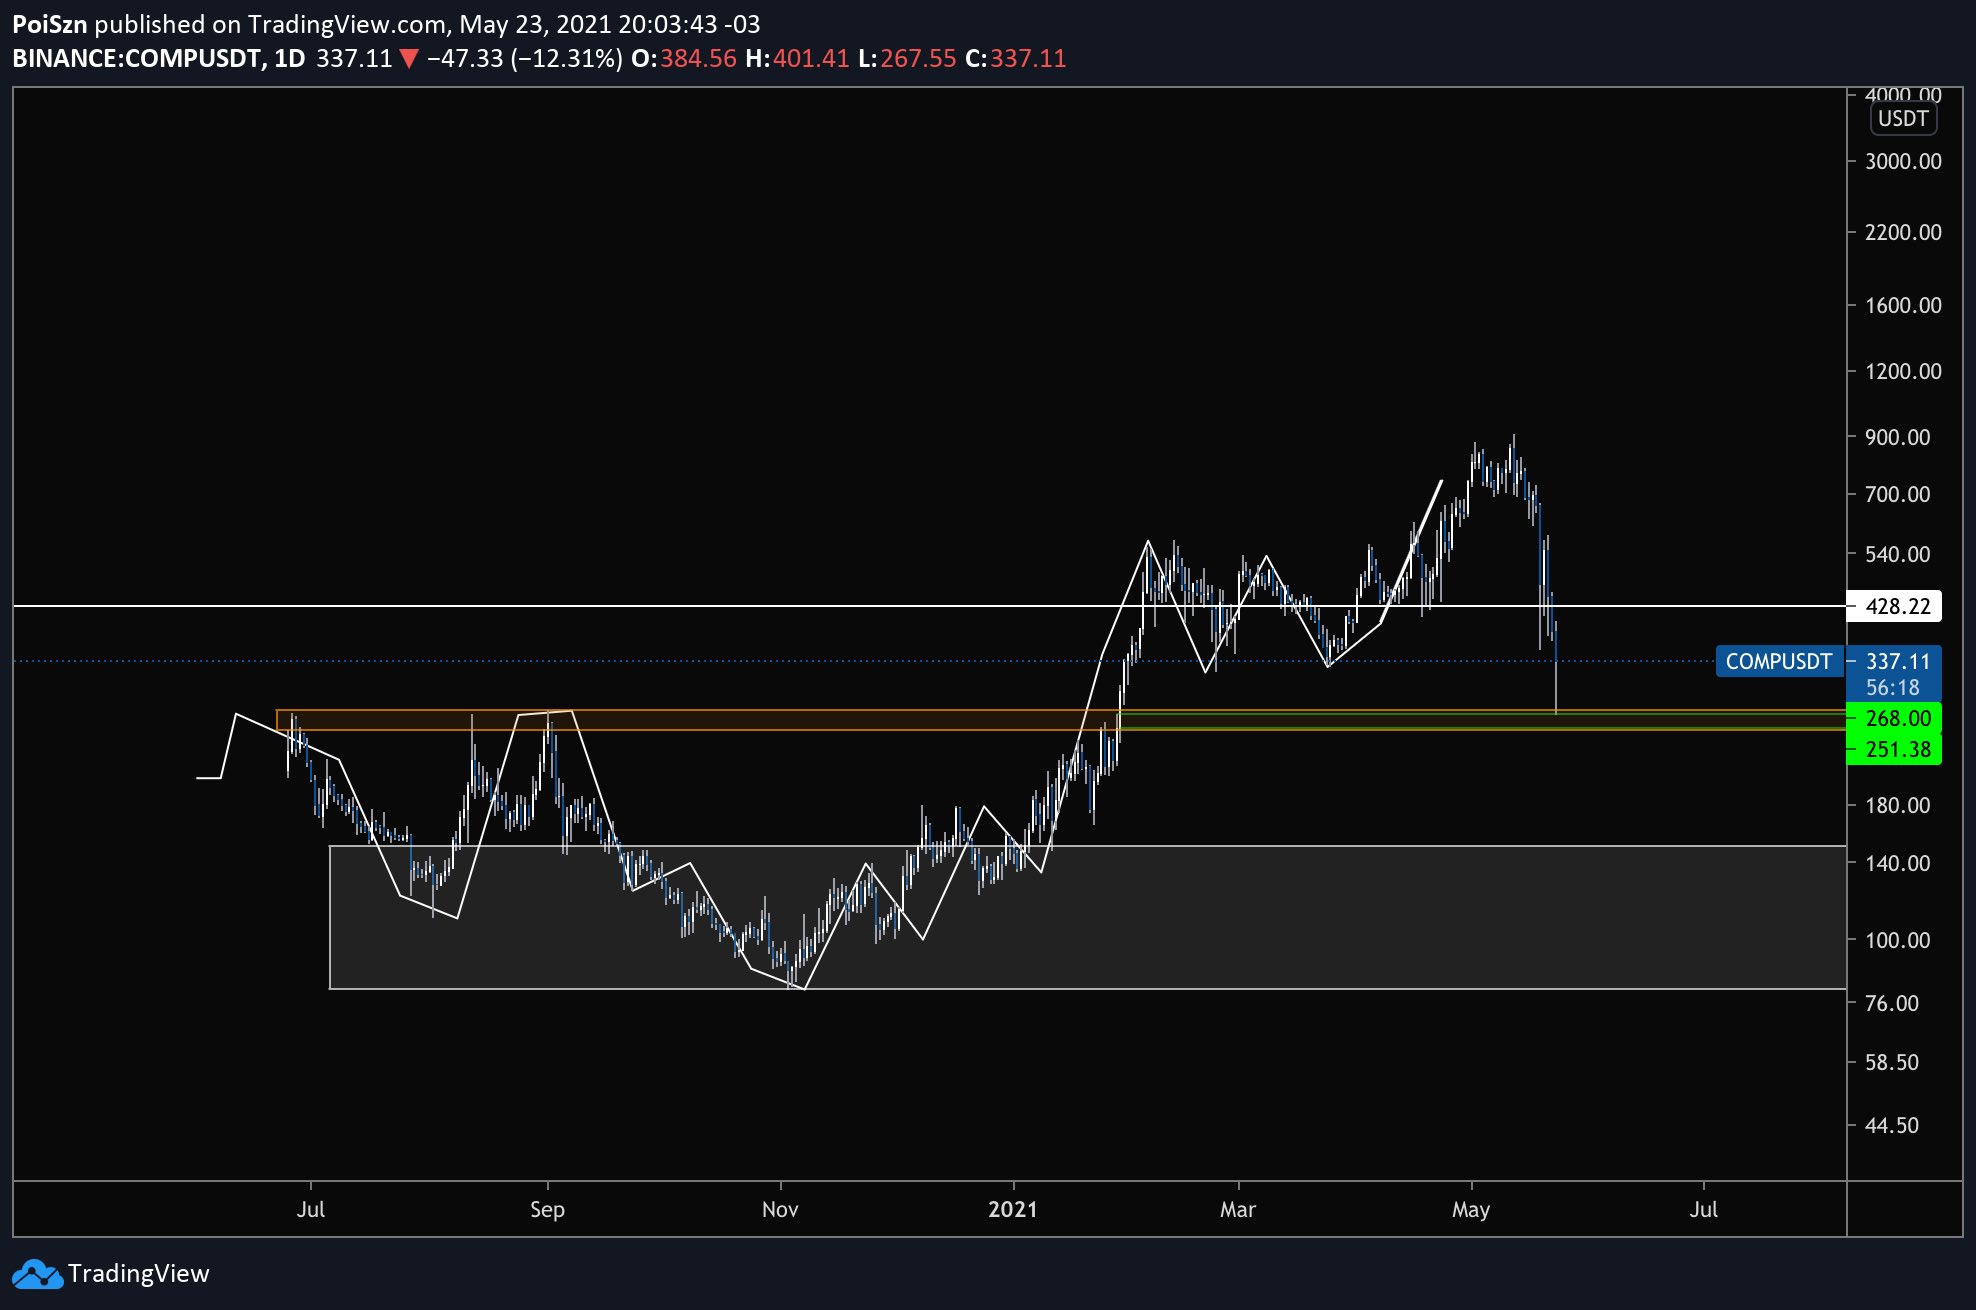
Cryptocurrency trader @Poiszn outlined a COMP chart which shows a validation of the previous resistance. As seen above, the token has bounced after reaching this level and is now moving upwards.

Short-term resistance
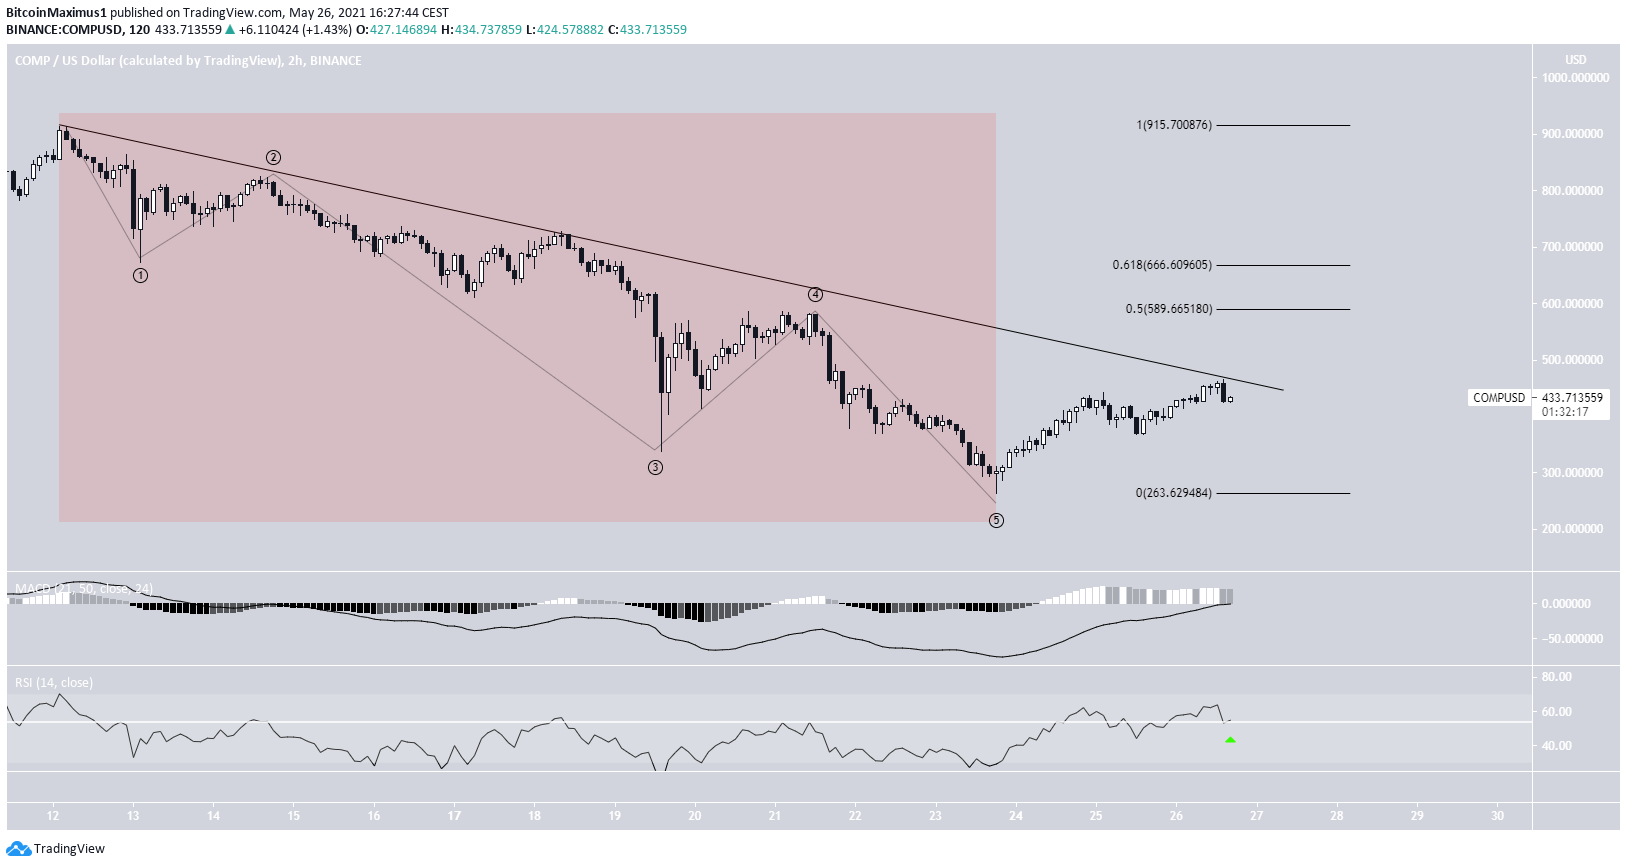
The shorter-term two-hour chart shows a descending resistance line that has been in place since the aforementioned all-time high.
Currently, COMP is making its third breakout attempt. Both the MACD and RSI support the possibility of a breakout. If successful, the next resistance levels would be found at $590 and $666, respectively.
However, the preceding downward movement looks like a completed bearish impulse. Therefore, it is possible that the price is now in the B wave of the A-B-C corrective structure.

COMP/BTC
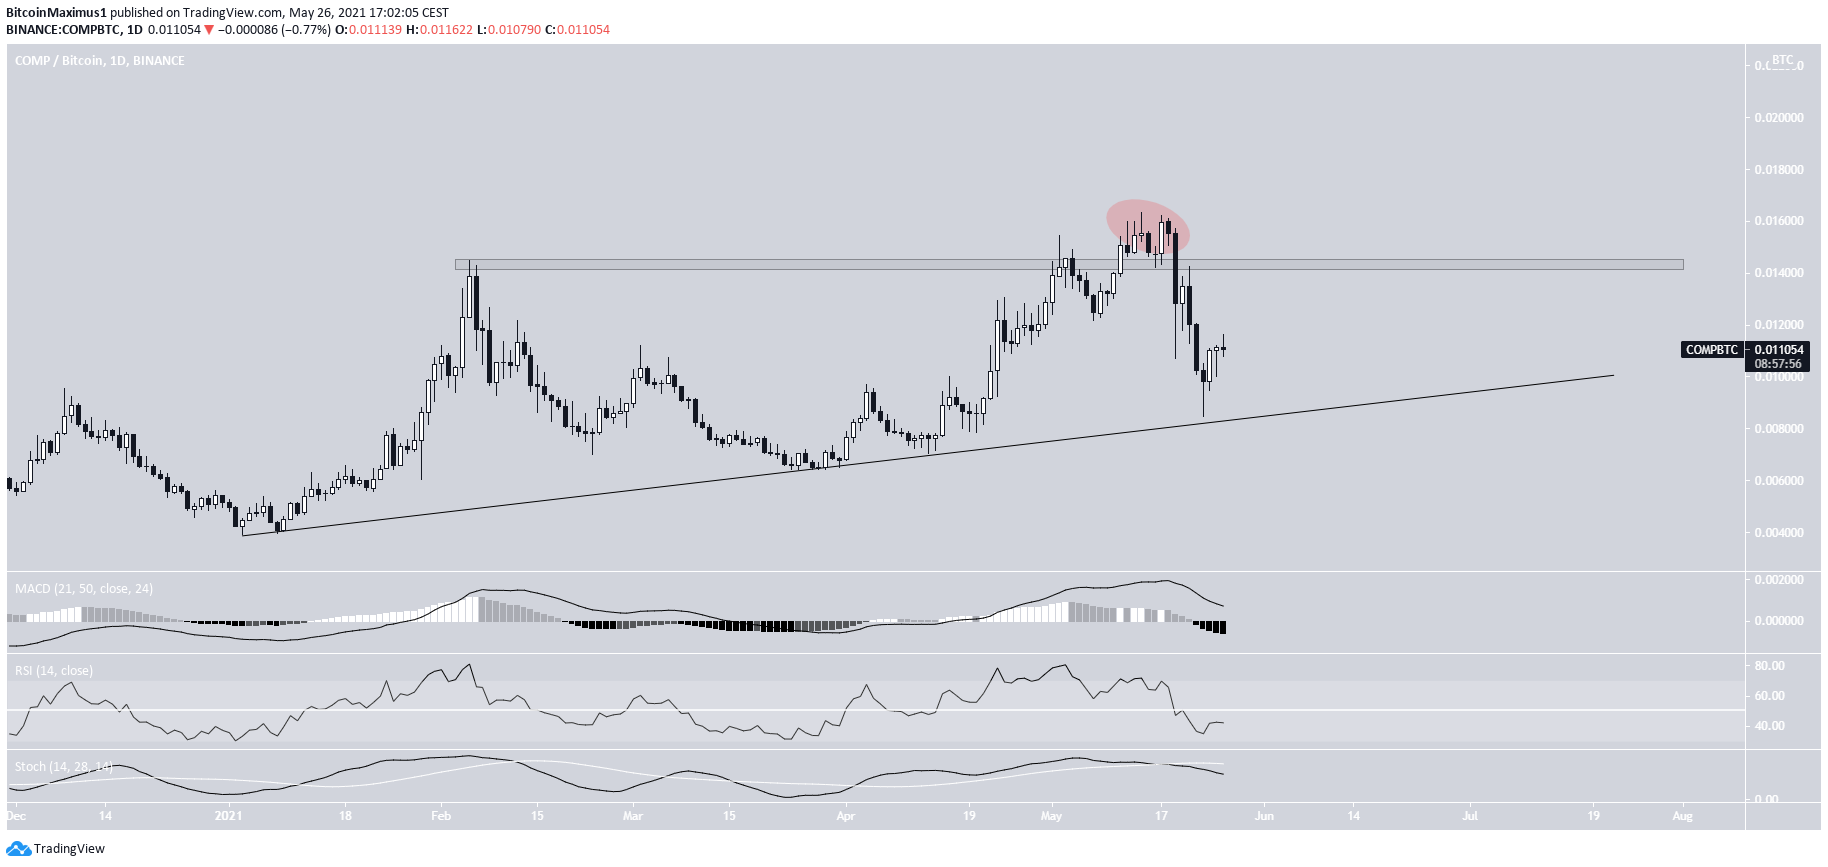
COMP/BTC has been increasing alongside an ascending support line since January 2021. On May 11, it managed to break out above the ₿0.0145 resistance area.
However, it only deviated above it (red circle), before crashing below. On May 23, it reached the ascending support line once more and bounced.
However, similarly to the USD pair, technical indicators are bearish. Therefore, while the token could consolidate below the ₿0.0145 area, a breakout seems unlikely.

For BeInCrypto’s latest BTC (BTC) analysis, click here.
The post COMP Regains Footing, After New Yearly Low appeared first on BeInCrypto.


