COTI Primed for Triangle Breakout, Eyes $1 Target
2 min readTable of Contents
COTI (COTI) has been moving downwards since reaching an all-time high of $0.583 on March 23.
It’s currently trading inside either an ascending or symmetrical triangle. A breakout from this pattern is expected.
All-Time High For COTI
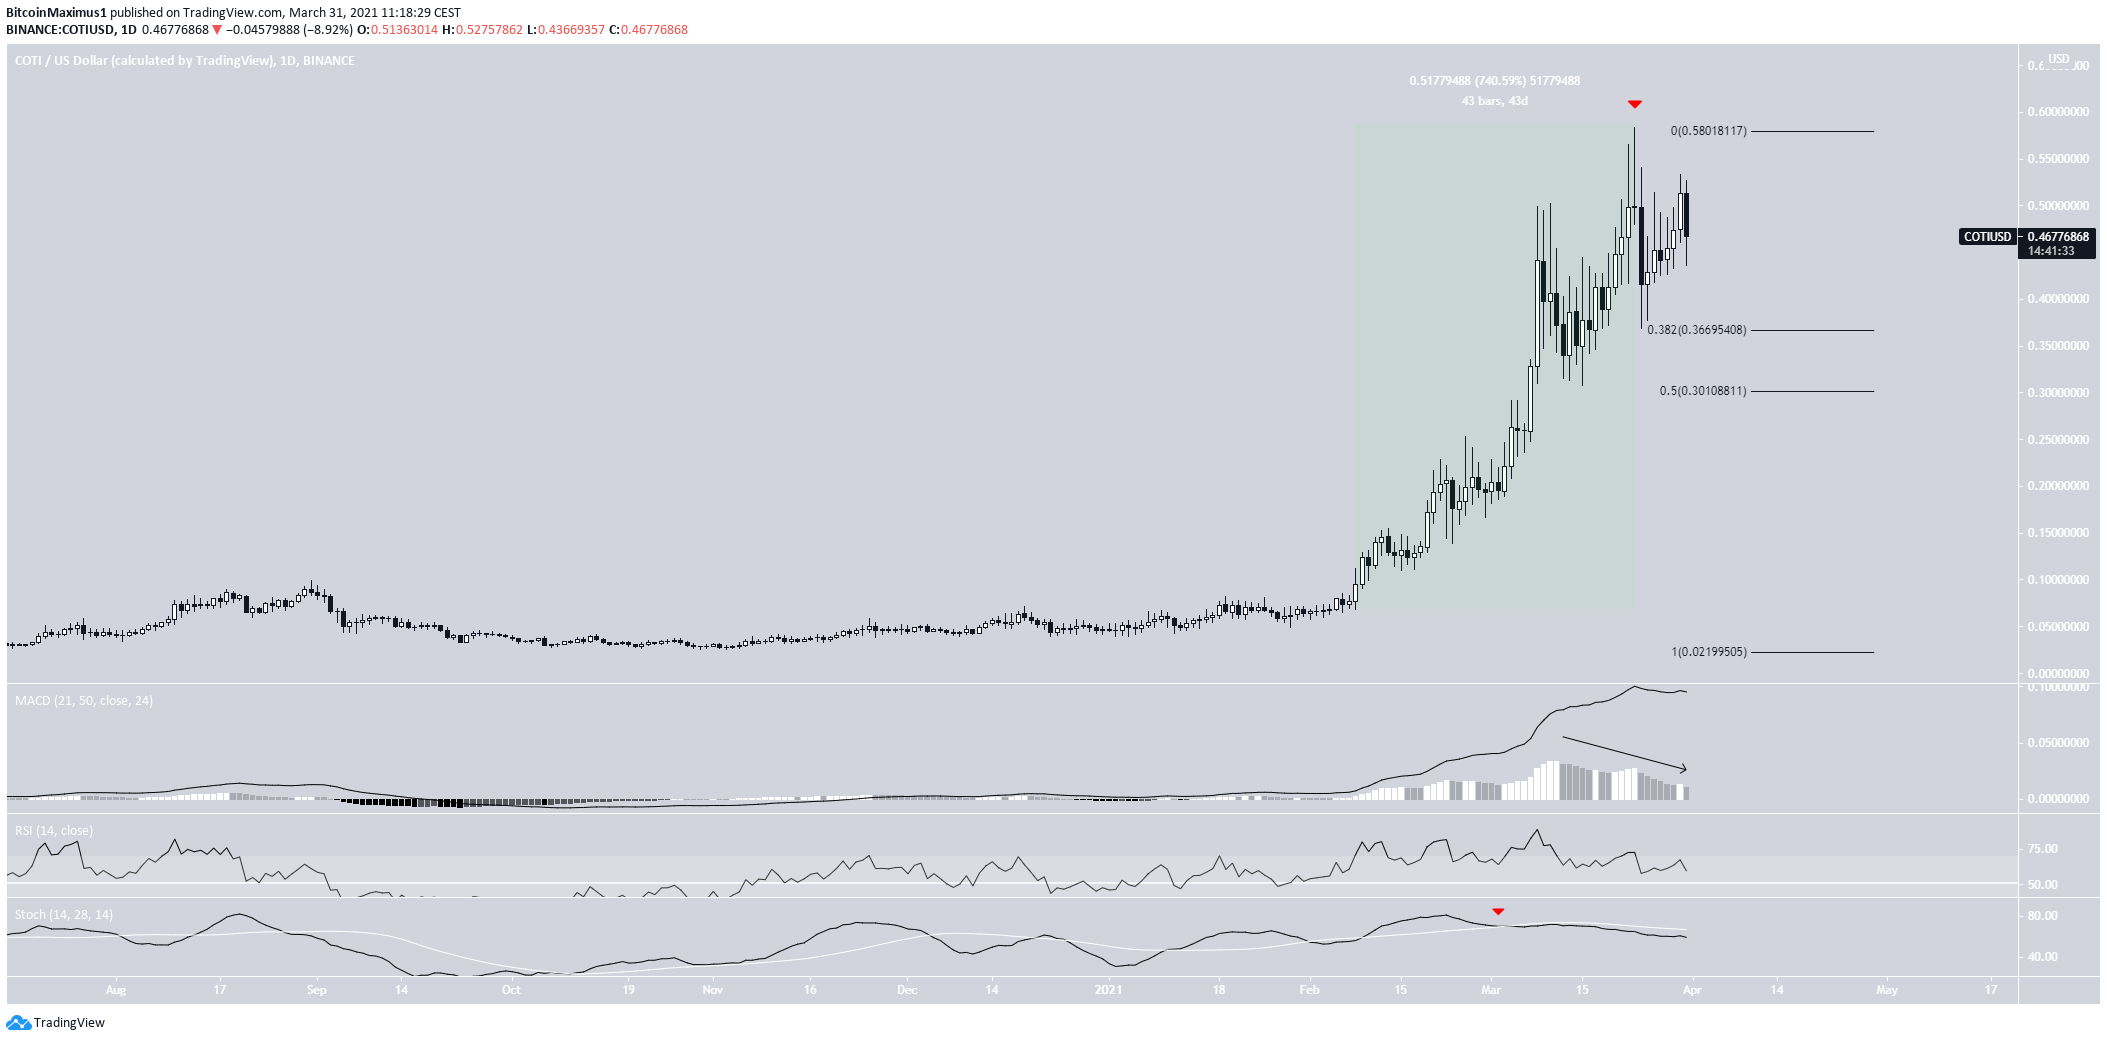
The price has been increasing since Feb. 8. On March 23, it reached an all-time high of $0.583 before dropping. This measured a 740% increase in only 43 days.
However, technical indicators have turned bearish. While the MACD is positive and the RSI is above 50, both are moving downwards. In addition, the Stochastic oscillator has made a bearish cross.
The closest support area is found at $0.366. This target is found using the 0.382 Fib retracement level of the most recent upward move. It has already bounced after reaching this level.

Wave Count
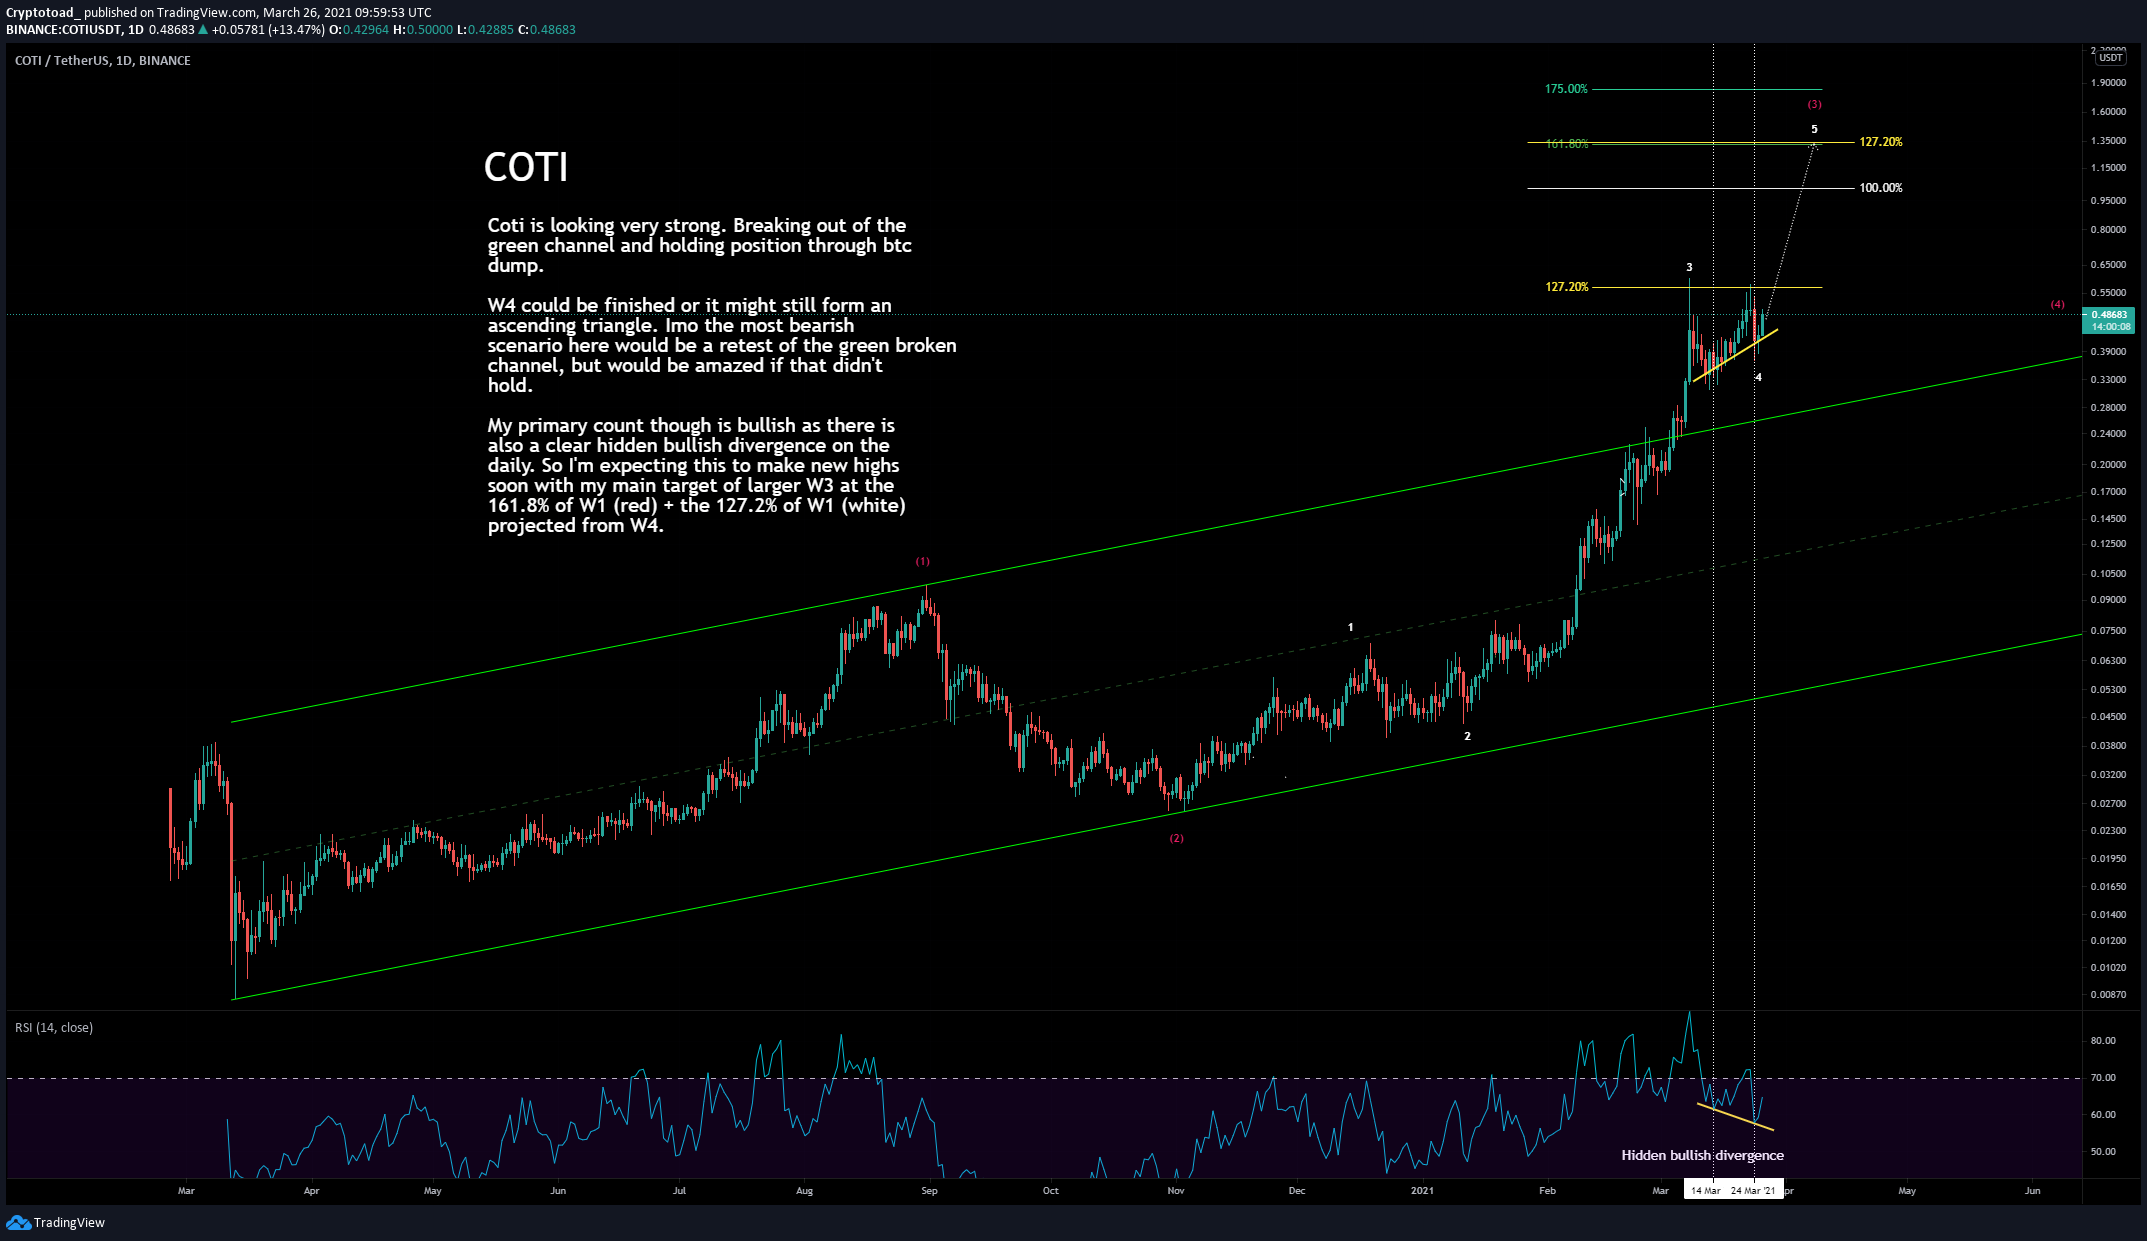
Cryptocurrency trader @Mesawine1 outlined a COTI chart, stating that the next upward movement could take it to $1.35.

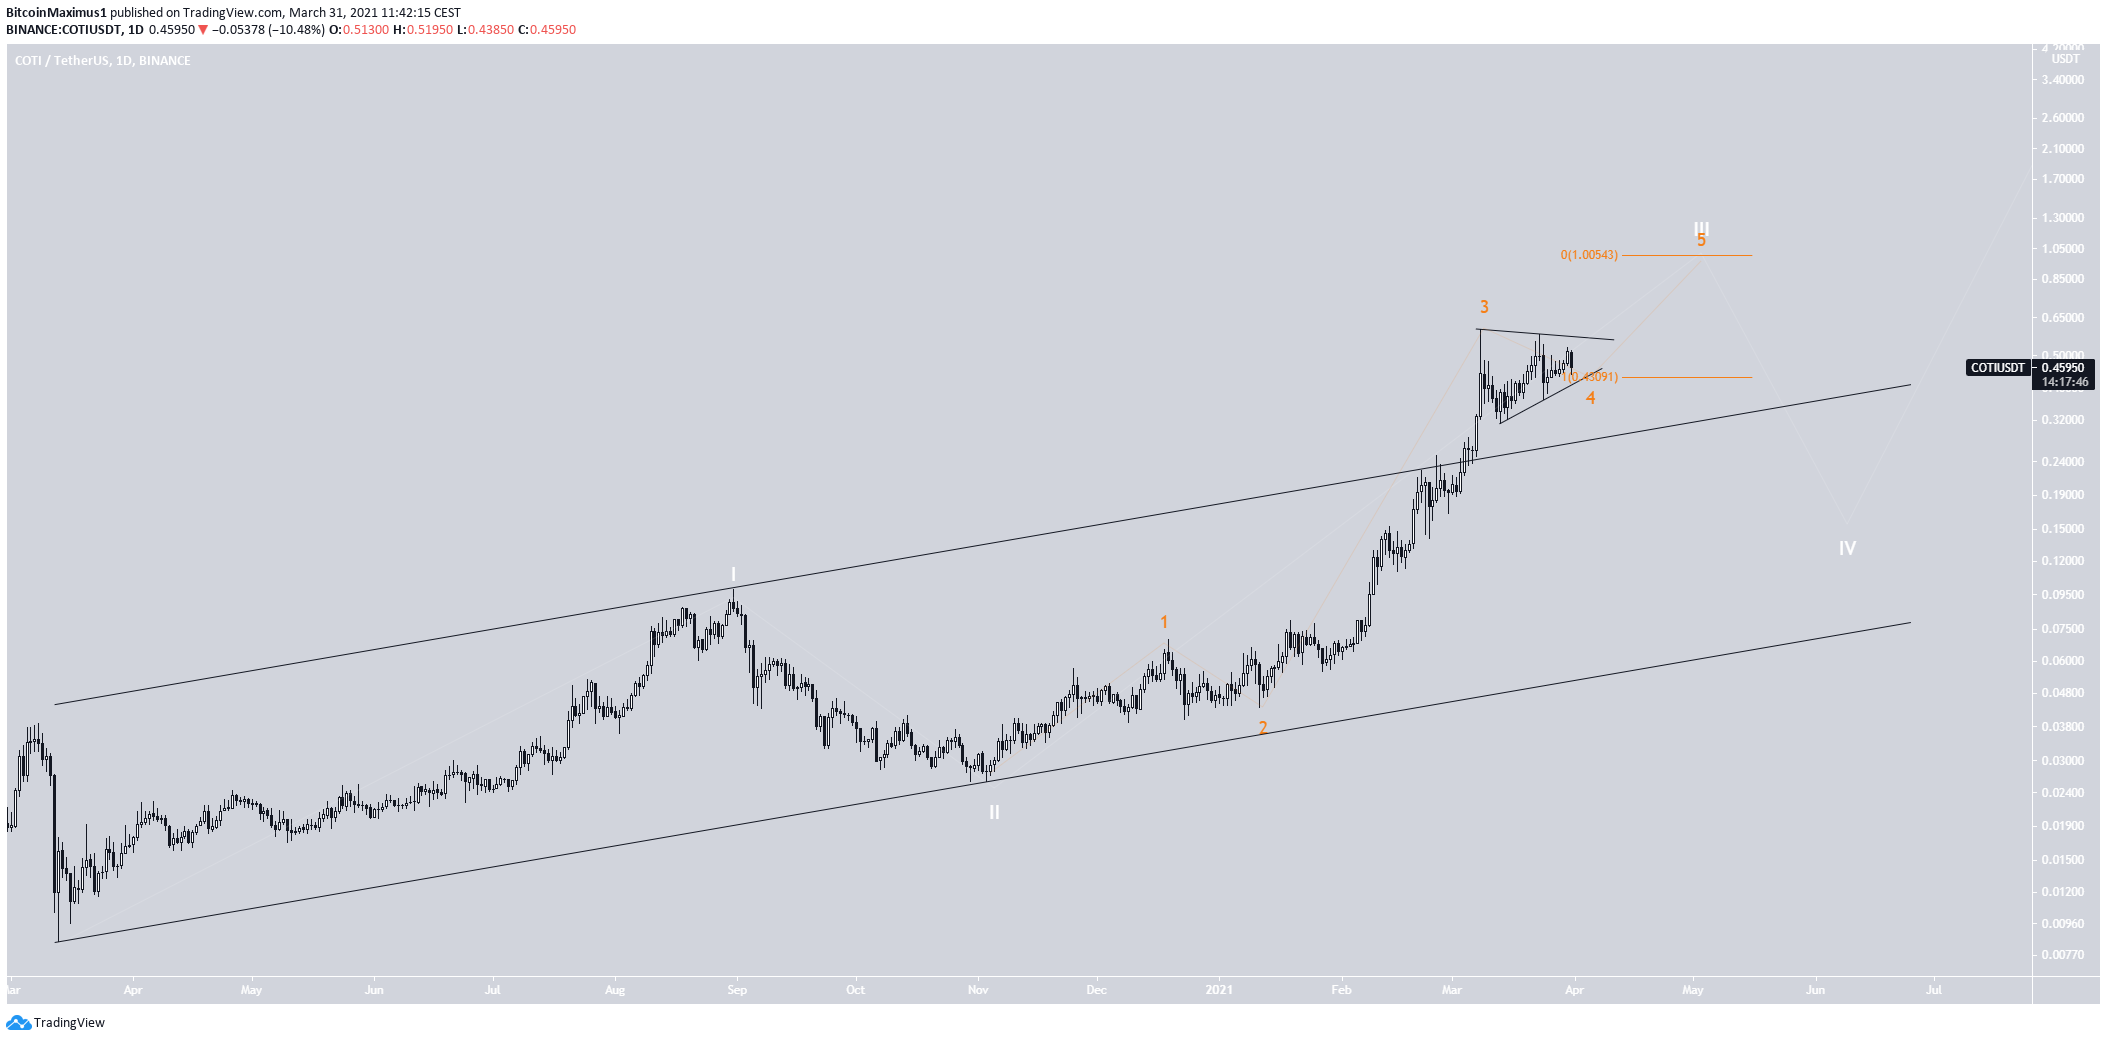
The token indeed seems to be in sub-wave four (orange) of a long-term wave three (white).
Sub-wave four has taken the shape of a triangle — either symmetrical or ascending.
A possible target for the top of the move can be found at $1, using a projection on sub-waves 1-3.
A decrease below the most recent low at $0.37 would likely invalidate this scenario.

COTI/BTC
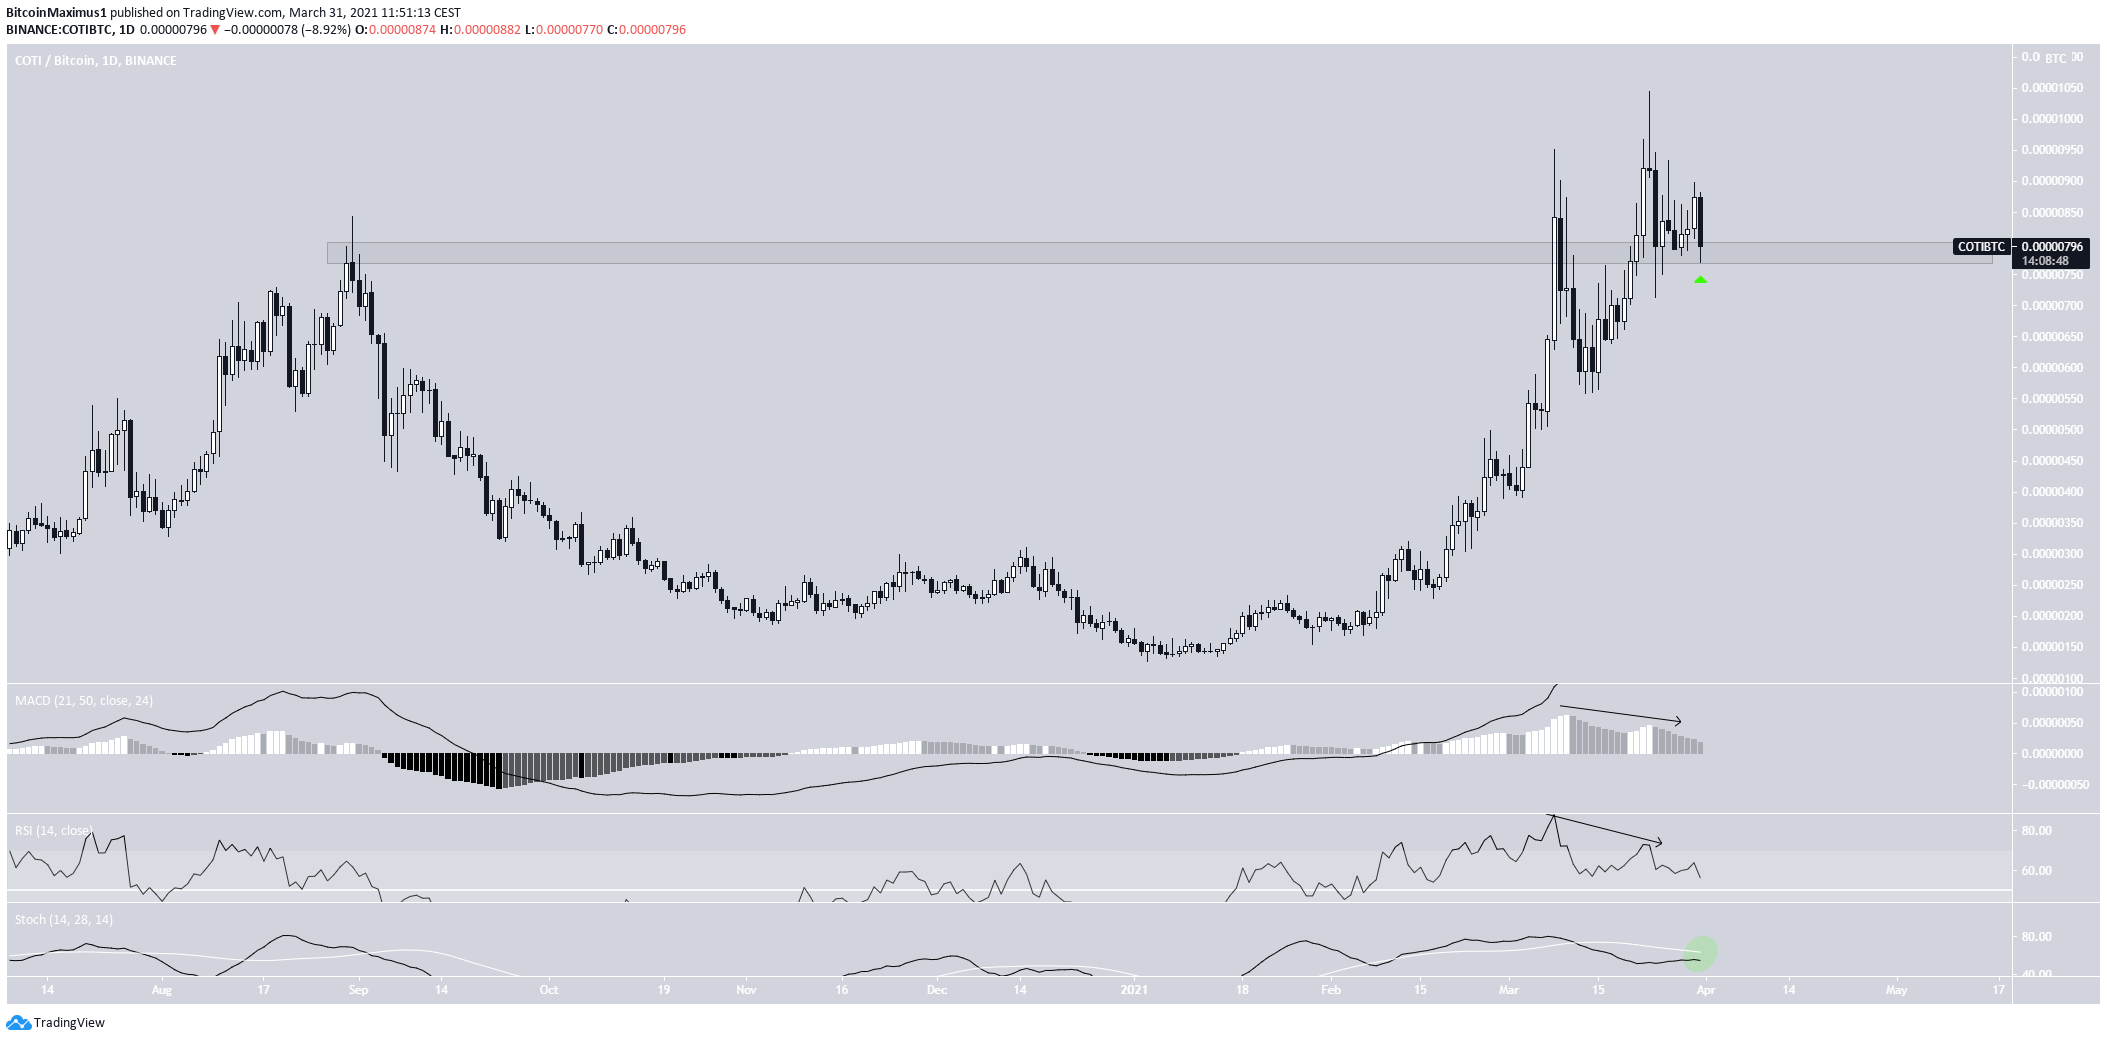
The price action for COTI/BTC seems bullish. While the token has been falling since reaching a high of 1,045 satoshis on March 23, it has returned to validate the 790 satoshi level as support.
While this is considered a bullish retest, technical indicators are bearish. This is evident by the decreasing MACD and RSI.
Therefore, we cannot confidently predict the direction of the next movement.
Nevertheless, the trend can be considered bullish as long as the token is trading above 790 satoshis.

Conclusion
COTI/USD is expected to break out from the current pattern.
The direction of the next COTI/BTC move cannot be accurately determined. However, the trend can be considered bullish as long as the token is trading above 790 satoshis.
For BeInCrypto’s latest BTC (BTC) analysis, click here.
The post COTI Primed for Triangle Breakout, Eyes $1 Target appeared first on BeInCrypto.


