DeFi Tokens Could Lead Rally as ANKR, NMR and XVS Break Out
3 min readAnkr (ANKR) has been trading inside a descending parallel channel since March 29. It just reclaimed the middle of the channel.
Numeraire (NMR) is in the process of breaking out from a descending resistance line and moving above a horizontal resistance area.
Venus (XVS) has broken out from a descending wedge and is moving towards the $42 resistance area.
ANKR
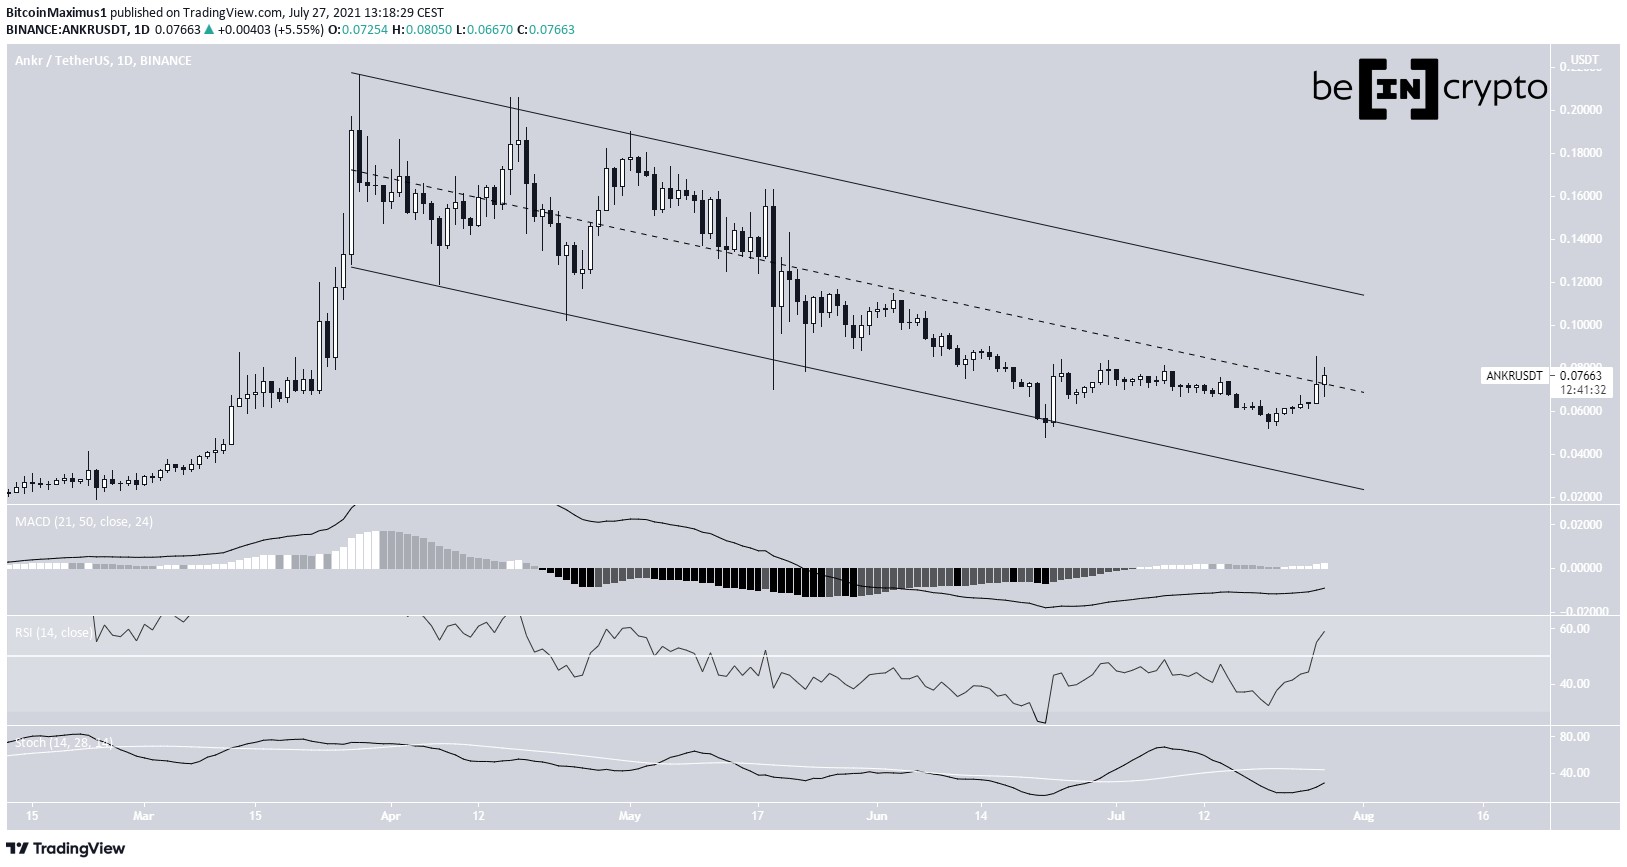
ANKR has been decreasing alongside a descending parallel channel since reaching an all-time high price on March 19.
It has touched the support line of this pattern numerous times, most recently on June 22, when it initiated an upward movement. The token created a higher low on July 20 and moved above the middle of the channel on July 27.
Technical indicators are showing bullish signs, though they have not confirmed the bullish reversal yet. The RSI is the most bullish, since it has just moved above the 50 line. The MACD is moving upwards but is not positive yet.
A movement of the MACD signal line above 0 and a bullish cross in the Stochastic oscillator would confirm the bullish reversal.
Furthermore, descending parallel channels often contain corrective movements. In addition to this, the movement above the middle of the channel indicates that an upward movement is likely. This would take ANKR at least at the resistance line of the channel and potentially cause a breakout.

Highlights
- ANKR is trading inside a descending parallel channel
- Technical indicators are turning bullish.
NMR
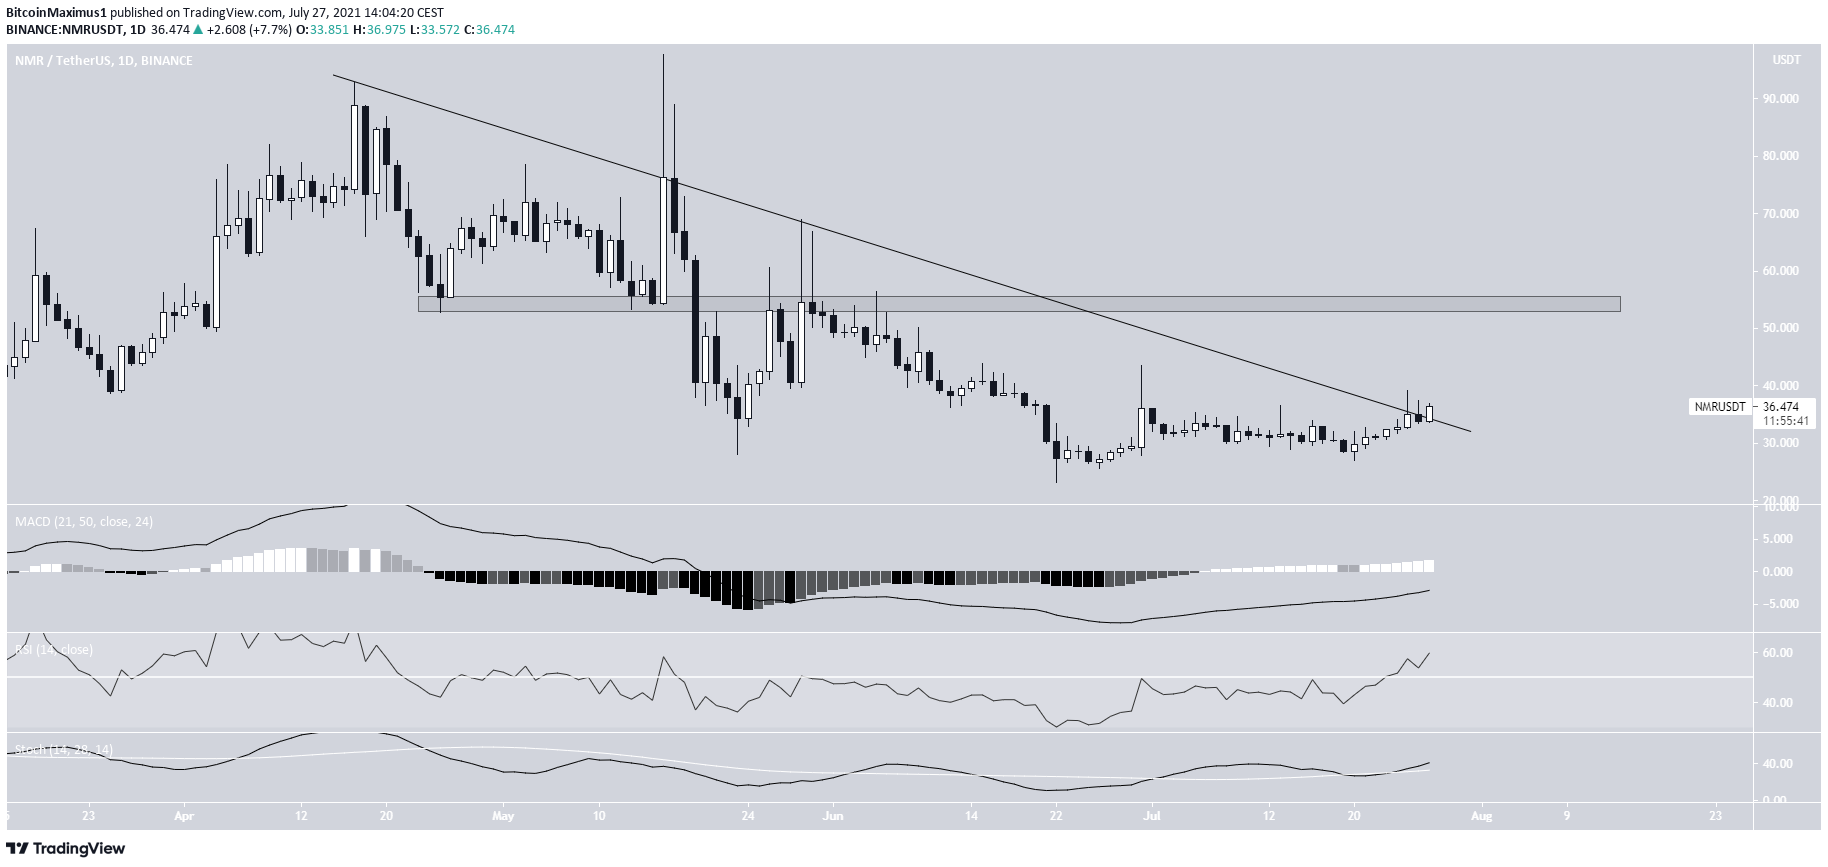
NMR has been decreasing alongside a descending resistance line since it reached an all-time high price on April 17.
So far, it has made three unsuccessful breakout attempts.
However, it is currently in the process of creating a bullish candlestick that would take it above this line. If successful, the closest resistance area would be at $54.
Technical indicators support the breakout and the continuation of the upward movement. The RSI has moved above 50 and the Stochastic oscillator has made a bullish cross. The MACD is increasing and is nearly in positive territory.

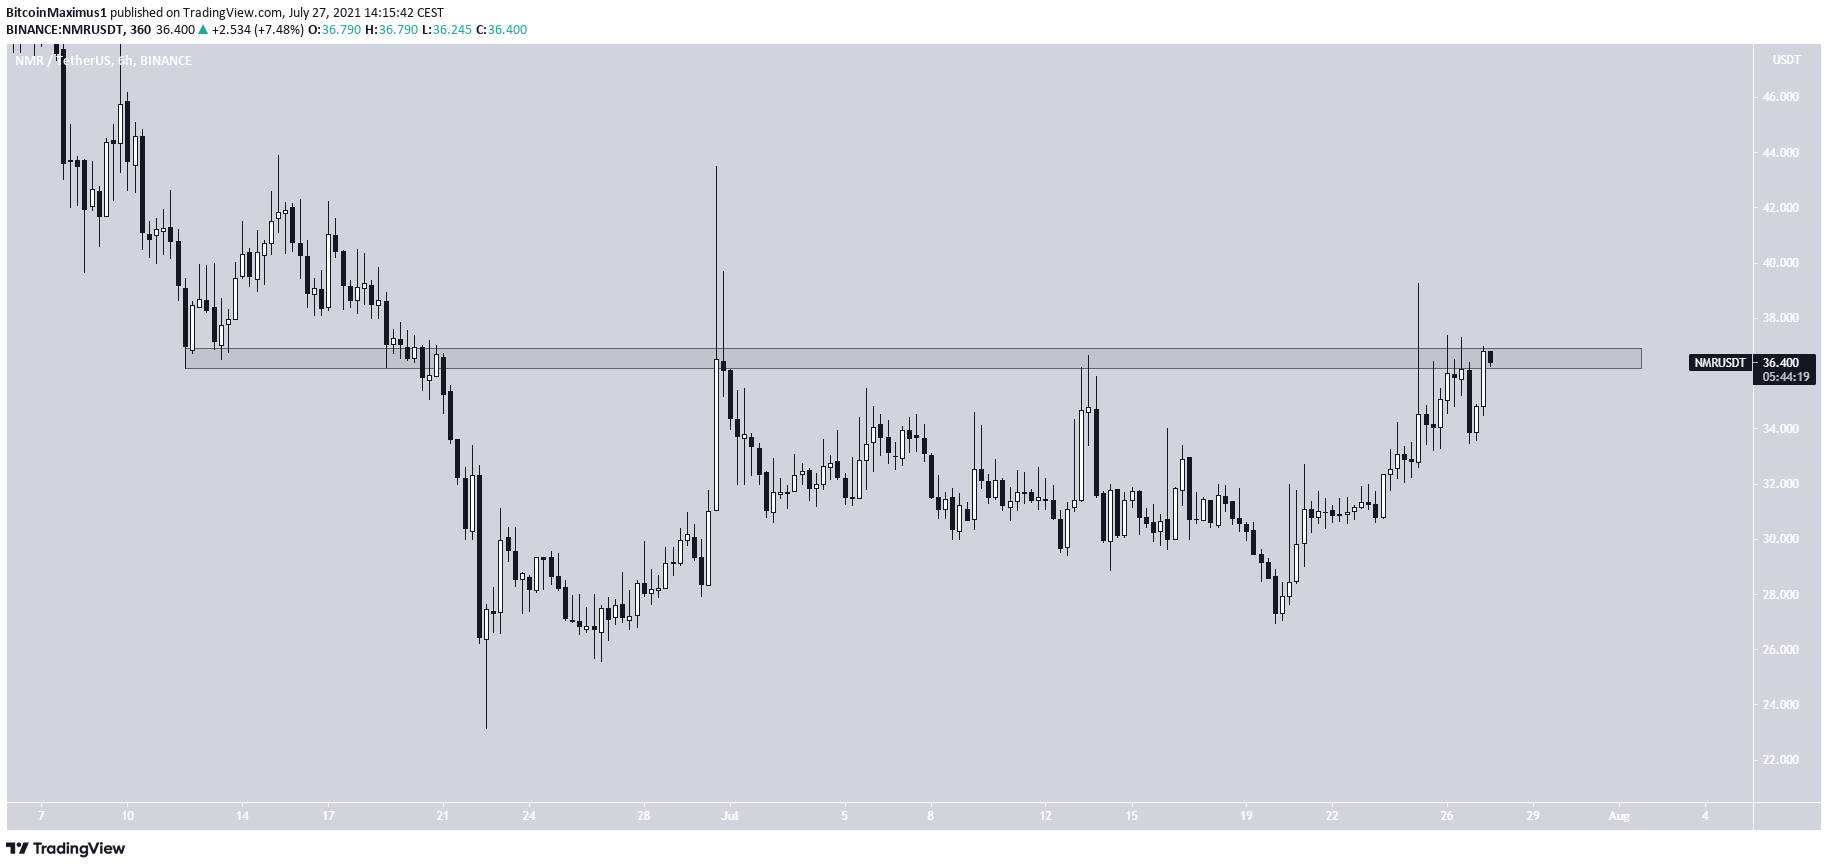
The shorter-term six-hour chart shows that the token is currently making its third breakout attempt above the $36.50 horizontal resistance area.
Doing so would also confirm the breakout from the previously outlined descending resistance line.

Highlights
- NMR is in the process of breaking out from a descending resistance line.
- It is facing resistance at $36.50.
XVS
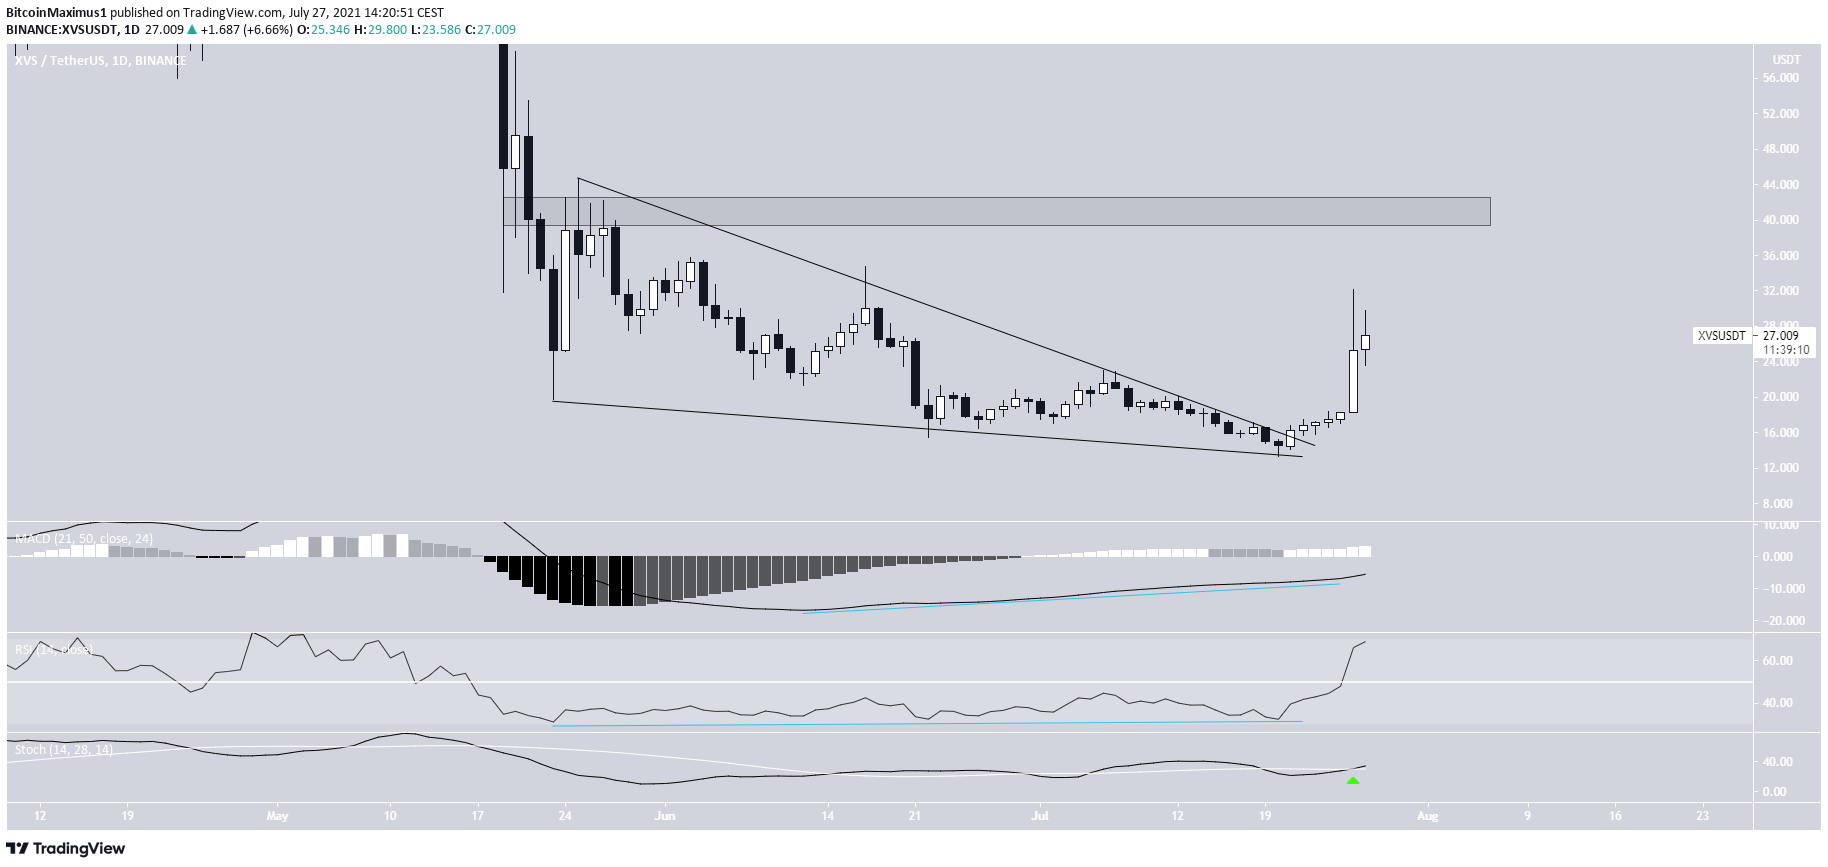
XVS had been trading inside a descending wedge since May 25. This eventually led to a low of $13.36 on July 20.
XVS broke out the next day and has been increasing since. So far, it has reached a high of $32.18.
The breakout was preceded by bullish divergence in the MACD, RSI & Stochastic oscillator. The divergence was more pronounced in the MACD.
The closest resistance area is at $42, close to the top of the wedge.

Highlights
- XVS has broken out from a descending wedge.
- There is resistance at $42.
For BeInCrypto’s latest BTC (BTC) analysis, click here.
The post DeFi Tokens Could Lead Rally as ANKR, NMR and XVS Break Out appeared first on BeInCrypto.


