Enjin Coin (ENJ) has been moving upwards since June 22 and has broken out from a descending resistance line.
Both the price action and technical indicators support the continuation of the upward movement towards the resistance levels outlined below.
Double bottom leads to breakout
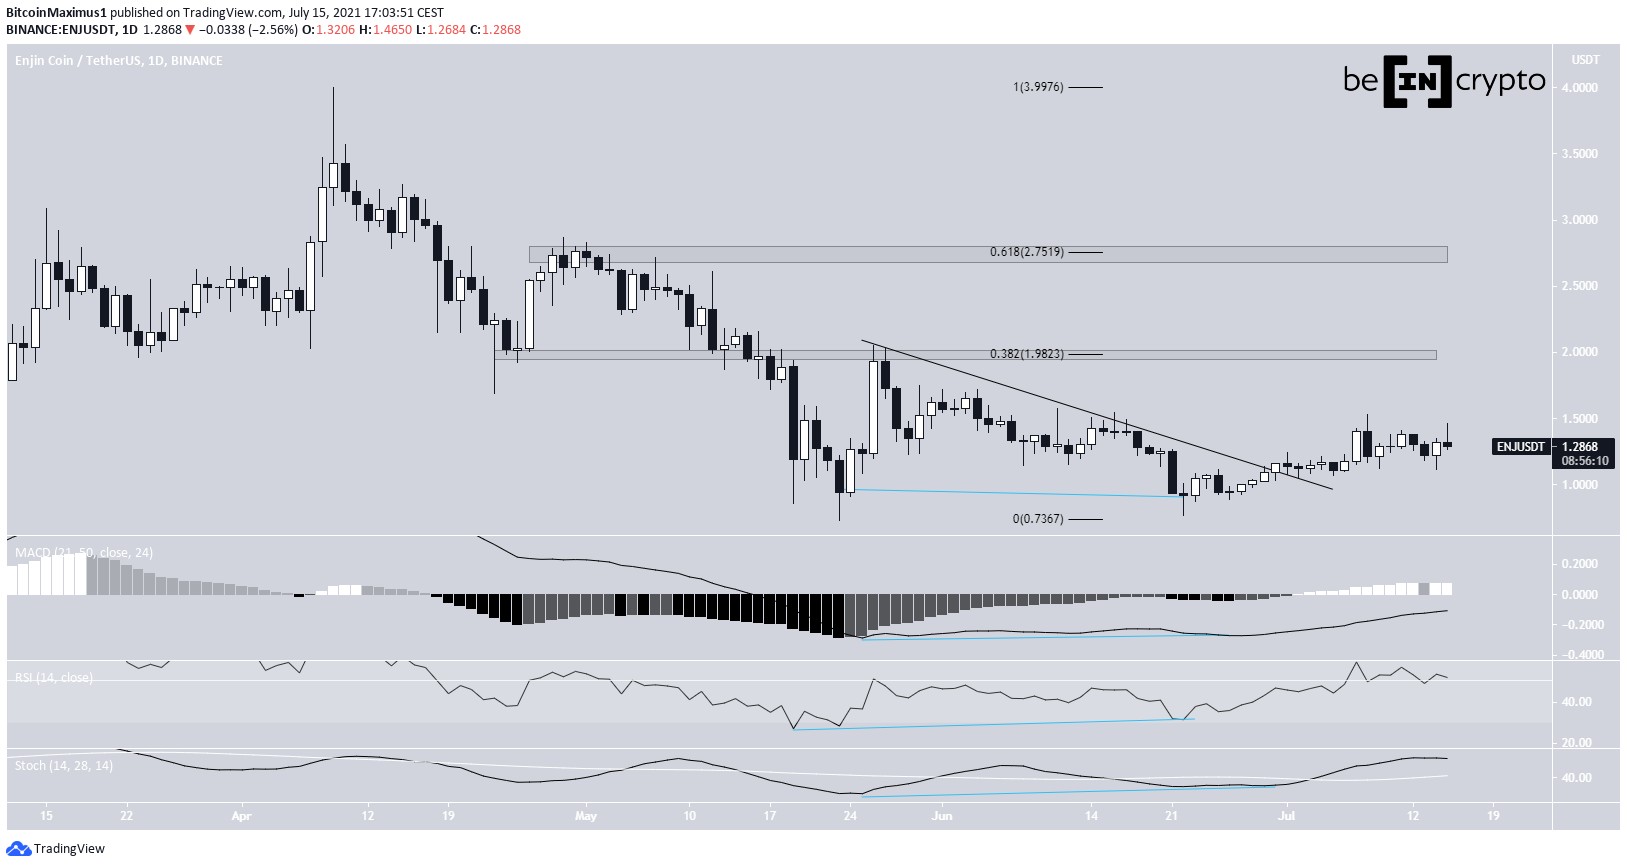
ENJ has been moving downwards since April 9. On May 23, it reached a low of $0.73. After a strong bounce, it returned to this level on June 22, creating a double bottom pattern. The rejection after the bounce also created a descending resistance line.
After the pattern was complete, ENJ began to move upwards and broke out from the descending resistance line on July 1. The upward movement was preceded by significant bullish divergence in the MACD, RSI & Stochastic oscillator. All three indicators are still bullish, supporting the continuation of the upward movement.
The closest resistance areas are at $1.98 and $2.75, the 0.382 and 0.618 Fib retracement levels, respectively. Both are also horizontal resistance areas.

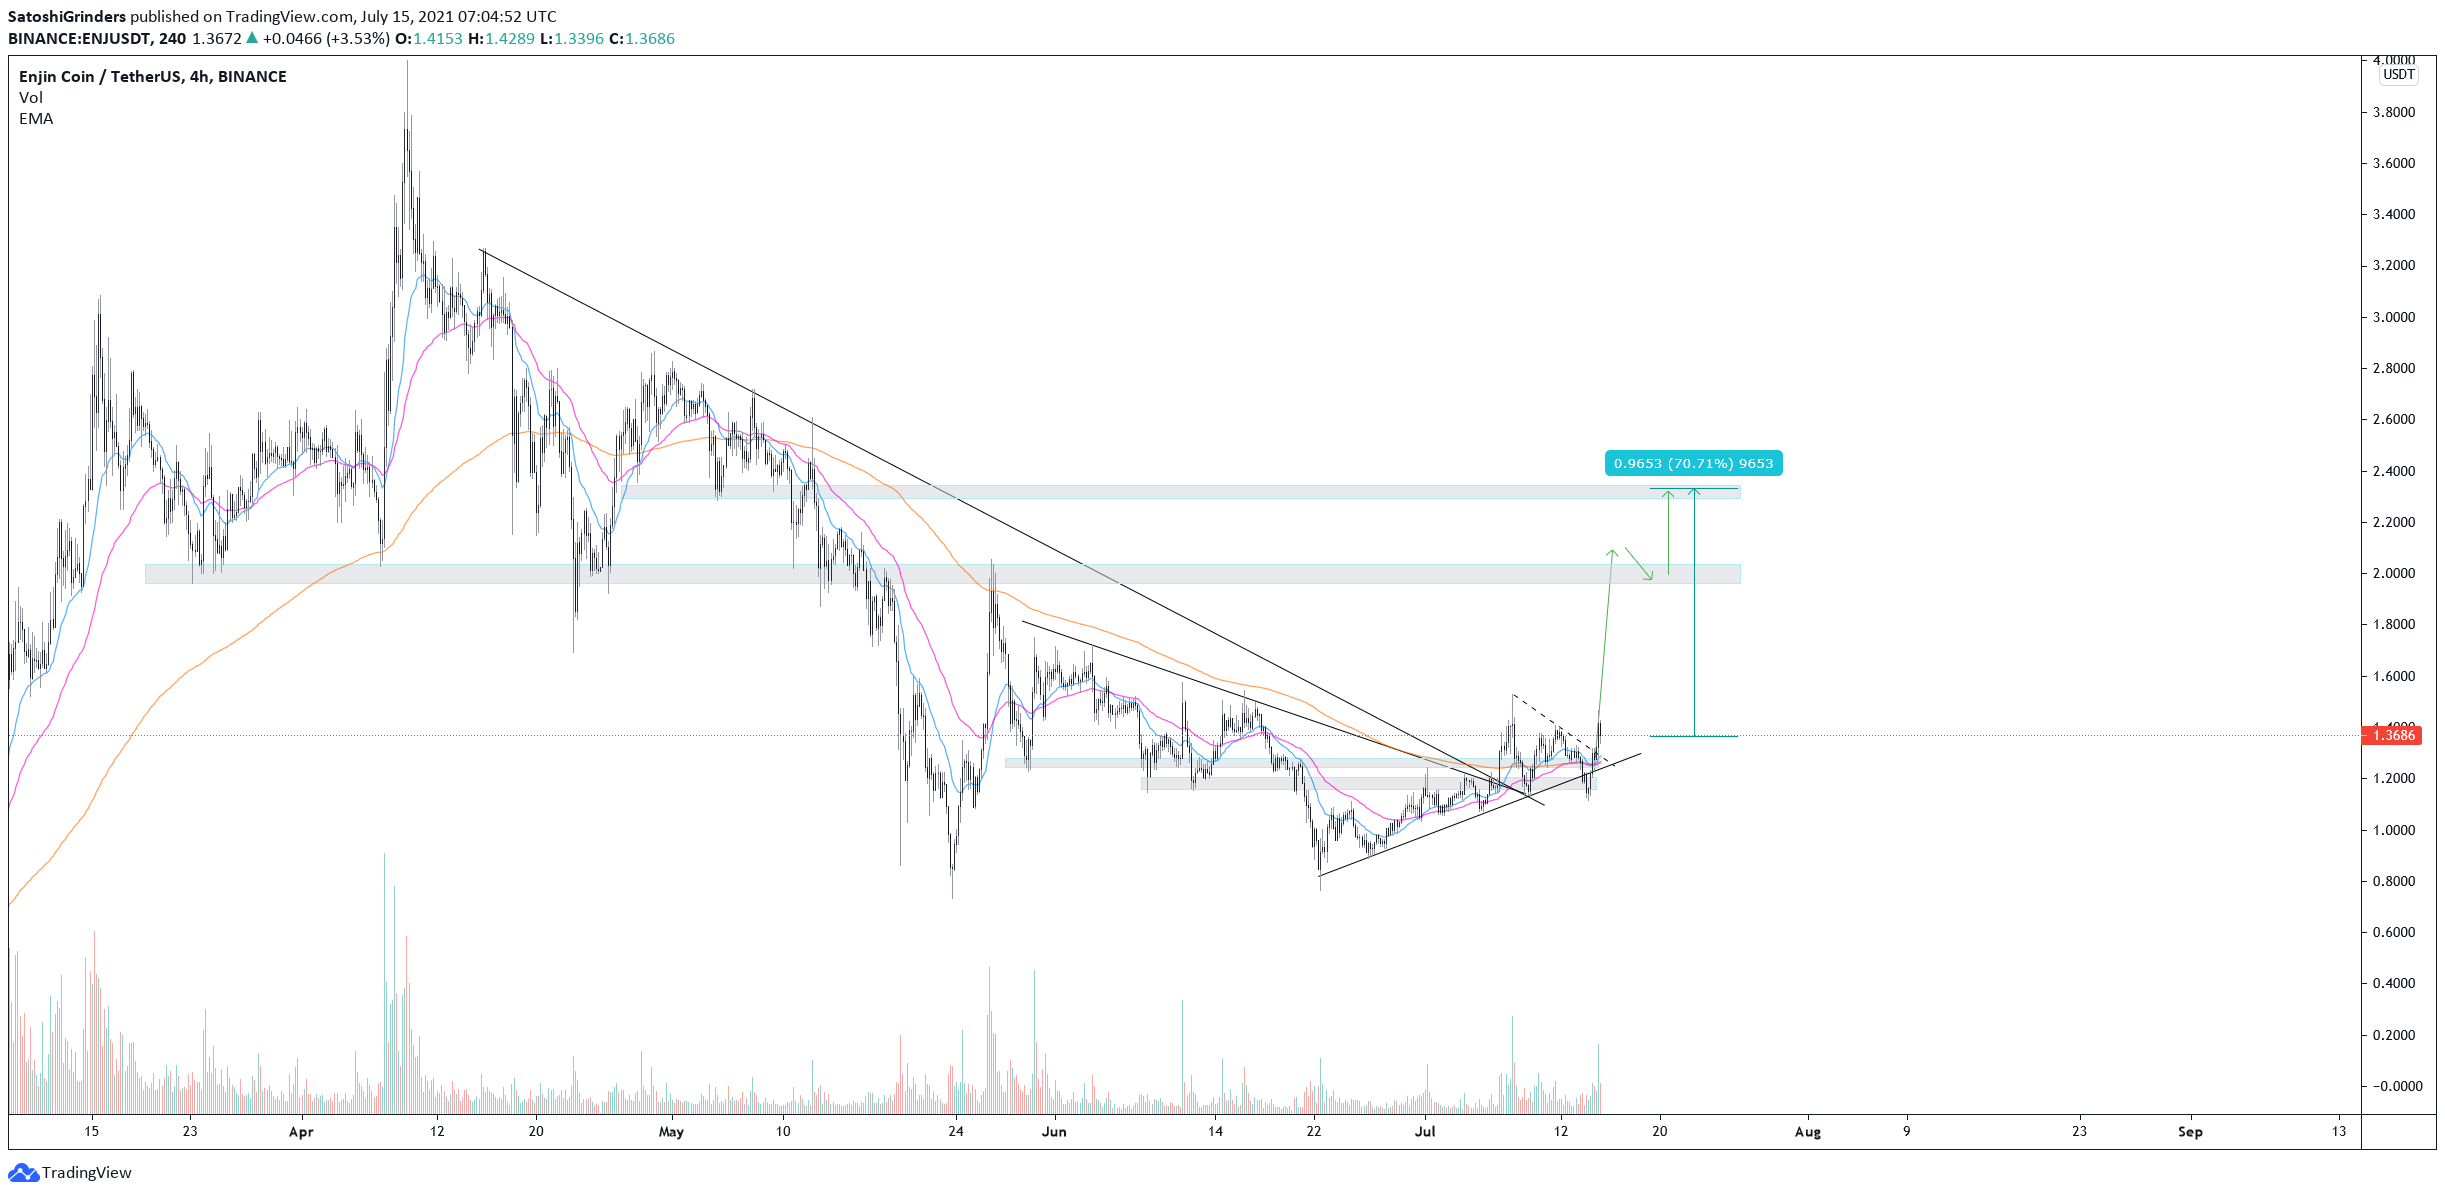
Cryptocurrency trader @Thebull_Crypto outlined an ENJ chart, stating that it could increase all the way to $2.30. This possibility fits with that which we have outlined, both due to the price action and readings from technical indicators.

ENJ/BTC
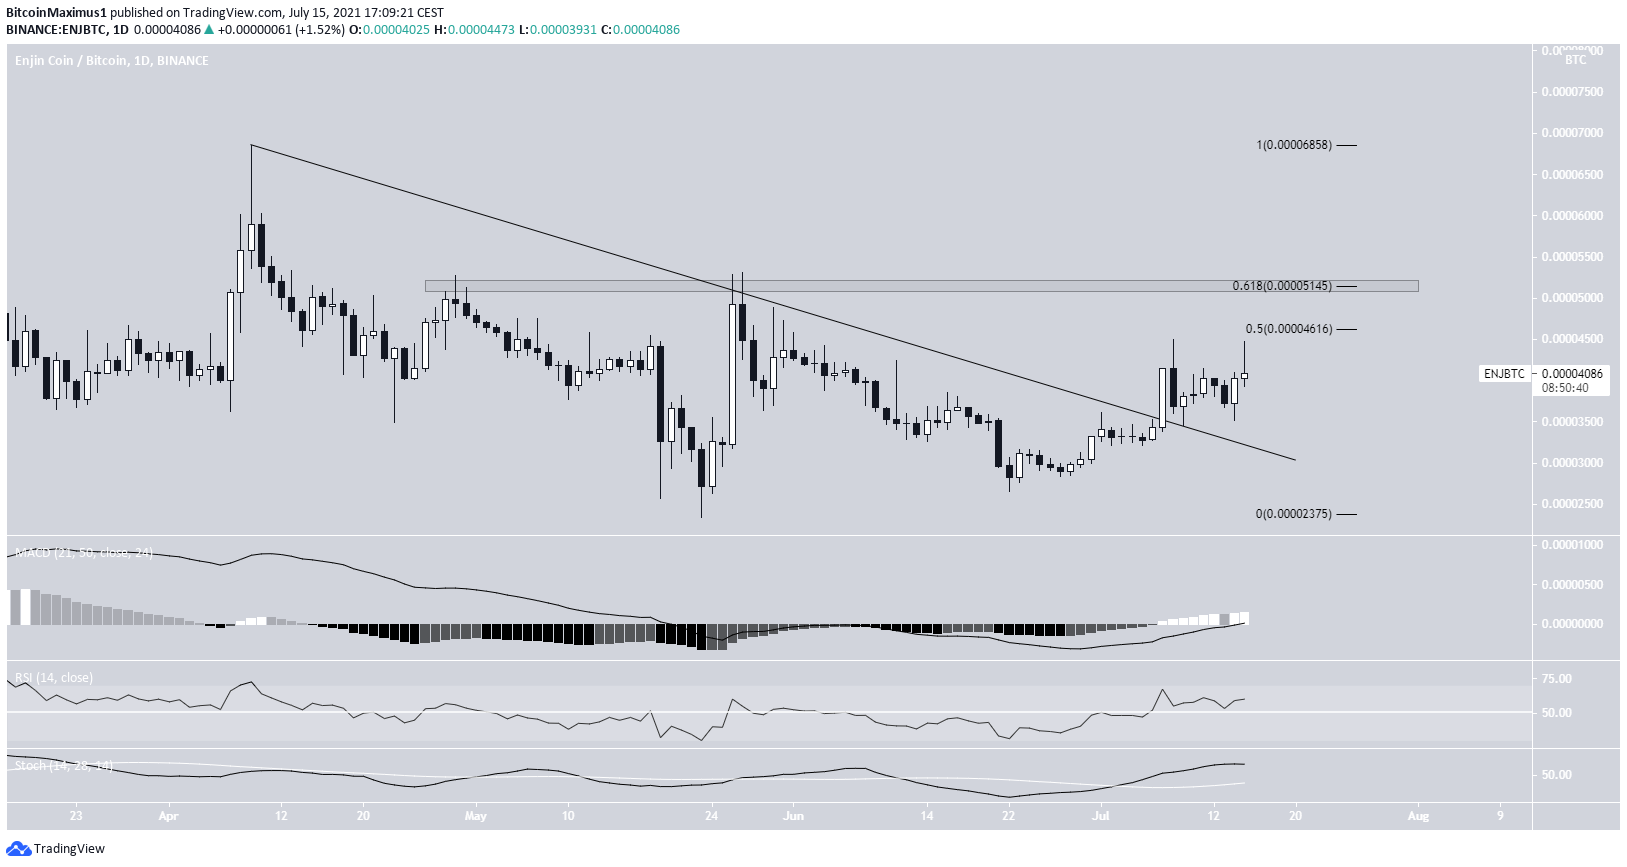
ENJ/BTC had also been following a descending resistance line, doing so since April 9. After three unsuccessful attempts, it finally managed to break out on July 7, and validated the line as support after two days.
While ENJ has been moving upwards, it has been rejected by the 0.5 Fib retracement resistance level at 4,616 satoshis. The main resistance is at 5,145 satoshis, the 0.618 Fib retracement level and a horizontal resistance area.
Similarly to the USD pair, technical indicators are bullish.
A movement above this area would likely lead to an upward movement towards the 6850 satoshi all-time high.

For BeInCrypto’s latest BTC (BTC) analysis, click here.
The post ENJ Breaks Out and Aims to Climb Above $2 appeared first on BeInCrypto.


