ETH, XRP, ETC Struggle Sustaining Upward Moves While BTC Consolidates
3 min readETH (ETH) is trading inside the $1,870 horizontal support area and is trying to initiate an upward move.
XRP (XRP) has returned to the $0.60 horizontal area, which previously acted as resistance. It’s now expected to act as support.
ETH Classic (ETC) is trading inside a descending wedge, from which a breakout is likely.
ETH
On May 23, ETH reached a low of $1,730 and bounced. The bounce took the price to a high of $2,915 three days later. In addition, it served to validate the $1,870 area as support.
After returning to the same horizontal area on June 16, ETH initiated another bounce that was much weaker than the first one. It culminated with a high of $2,410 on July 7.
ETH has now returned to the $1,870 horizontal area once again.
Technical indicators are bearish. The MACD is negative and decreasing, the RSI is below 50 and decreasing, and the Stochastic oscillator has just made a bearish cross.
A potential breakdown could cause a fall towards $1,500.

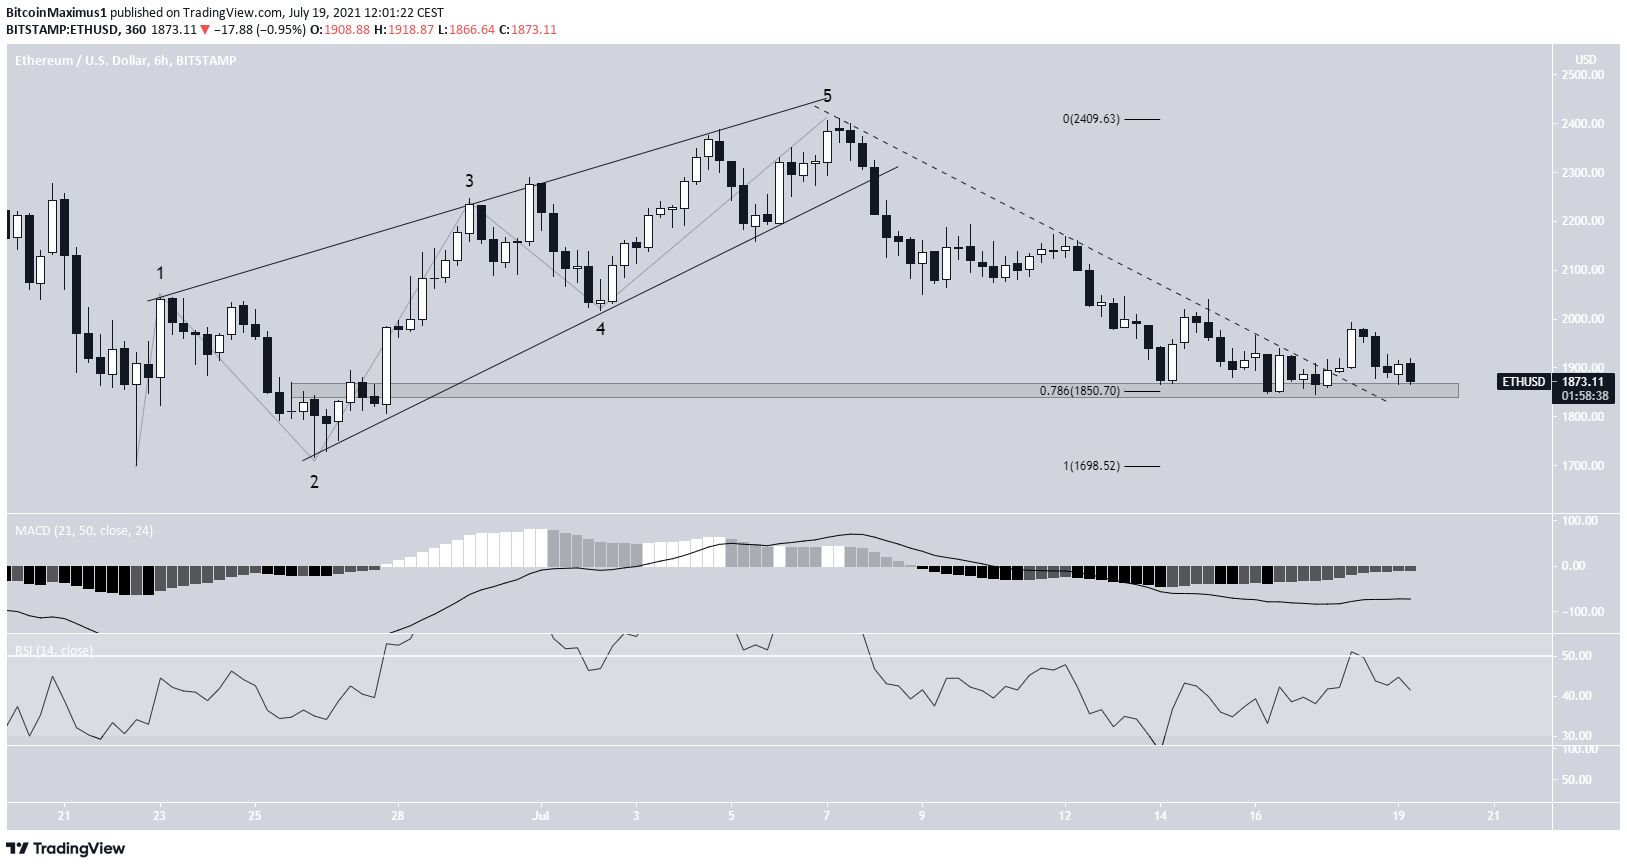
The six-hour chart provides a slightly more bullish outlook.
ETH has just broken out from a descending resistance line (dashed) that has been in place since July 7. Currently, it’s trading inside the $1,850 horizontal support area, which is the 0.786 Fib retracement support level.
In addition to this, both the MACD and RSI are moving upwards.
It’s possible that the upward movement that followed was a leading diagonal. In this case, ETH would be expected to increase toward the $2,500 highs.
However, in order for that scenario to transpire, ETH has to rebound at the current support level.

Highlights
- ETH is trading above support at $1,870.
- It has broken out from a descending resistance line.
XRP
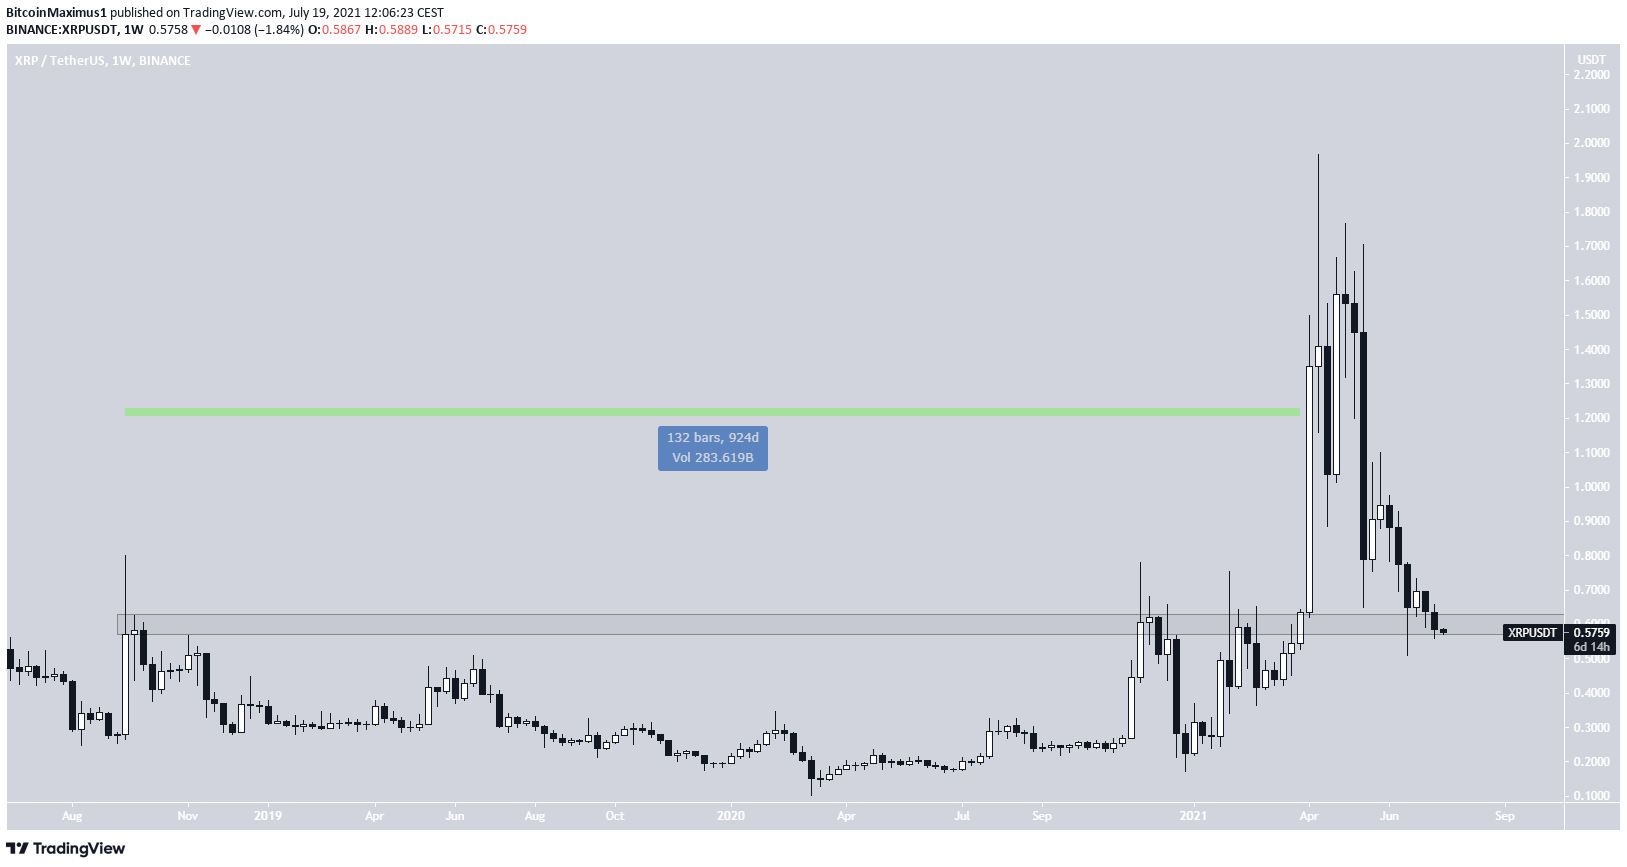
XRP has been decreasing since April 12 after it reached a high of $1.96. The downward move has taken it back inside the $0.60 horizontal area.
The same area acted as resistance for 924 days before XRP finally broke out. Now, the zone is likely to act as support.

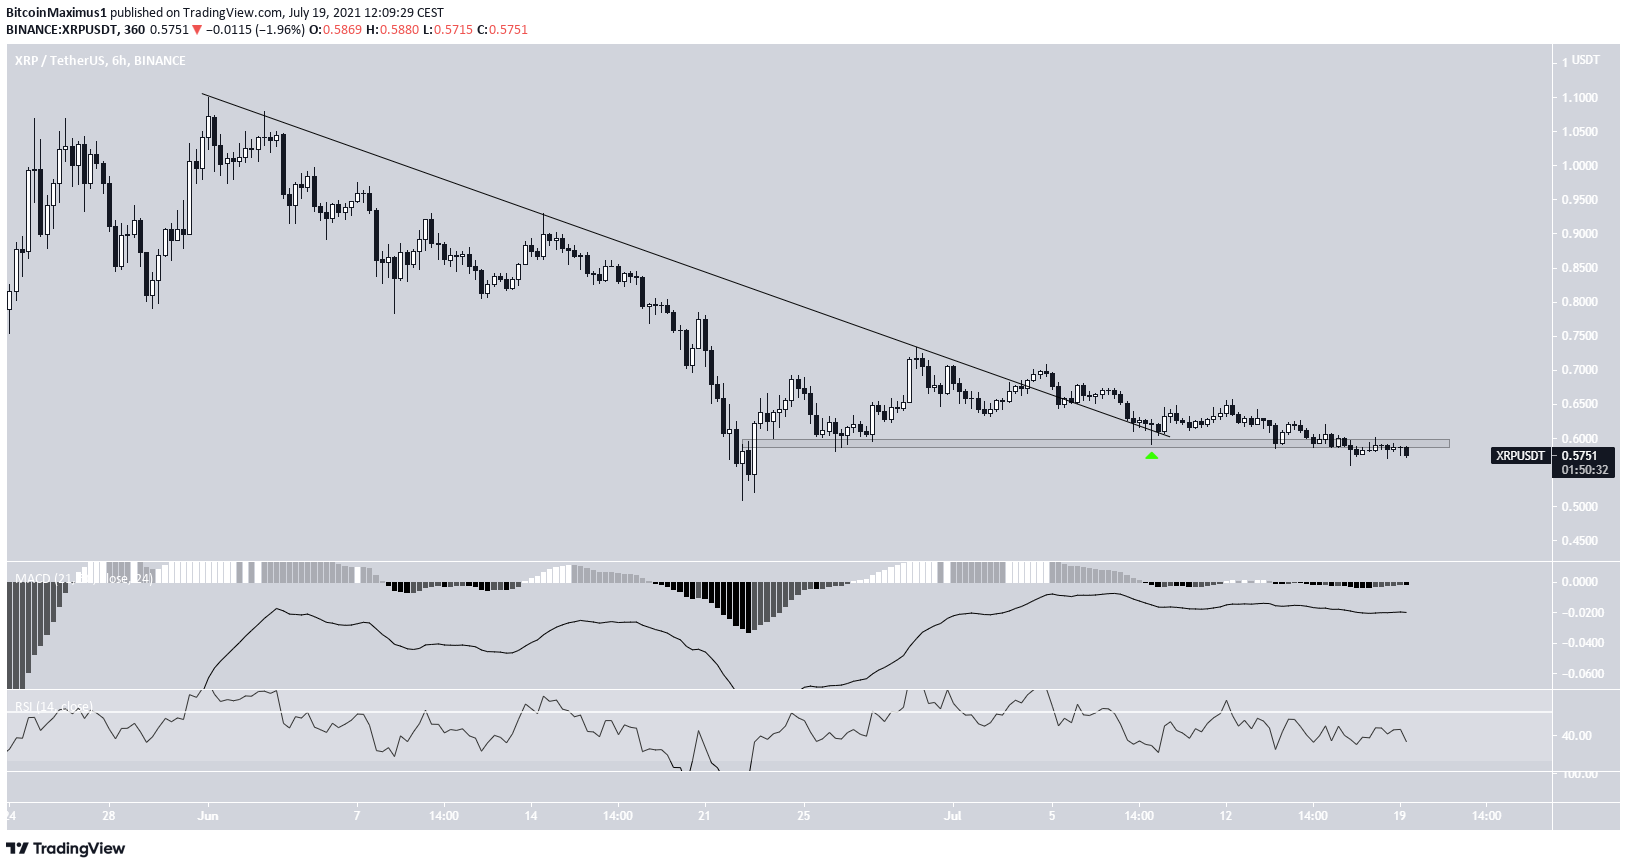
The six-hour chart shows that XRP has broken out from a descending resistance line that has been in place since June 1. On July 7, it validated the line as support (green icon).
However, it failed to sustain its upward trend and has now fallen below the $0.59 area. This level is expected to act as resistance.
Until the $0.59 area is reclaimed, the trend cannot be considered bullish.

Highlights
- XRP is trading inside the long-term $0.60 horizontal support area.
- It has broken out from a descending resistance line.
ETC
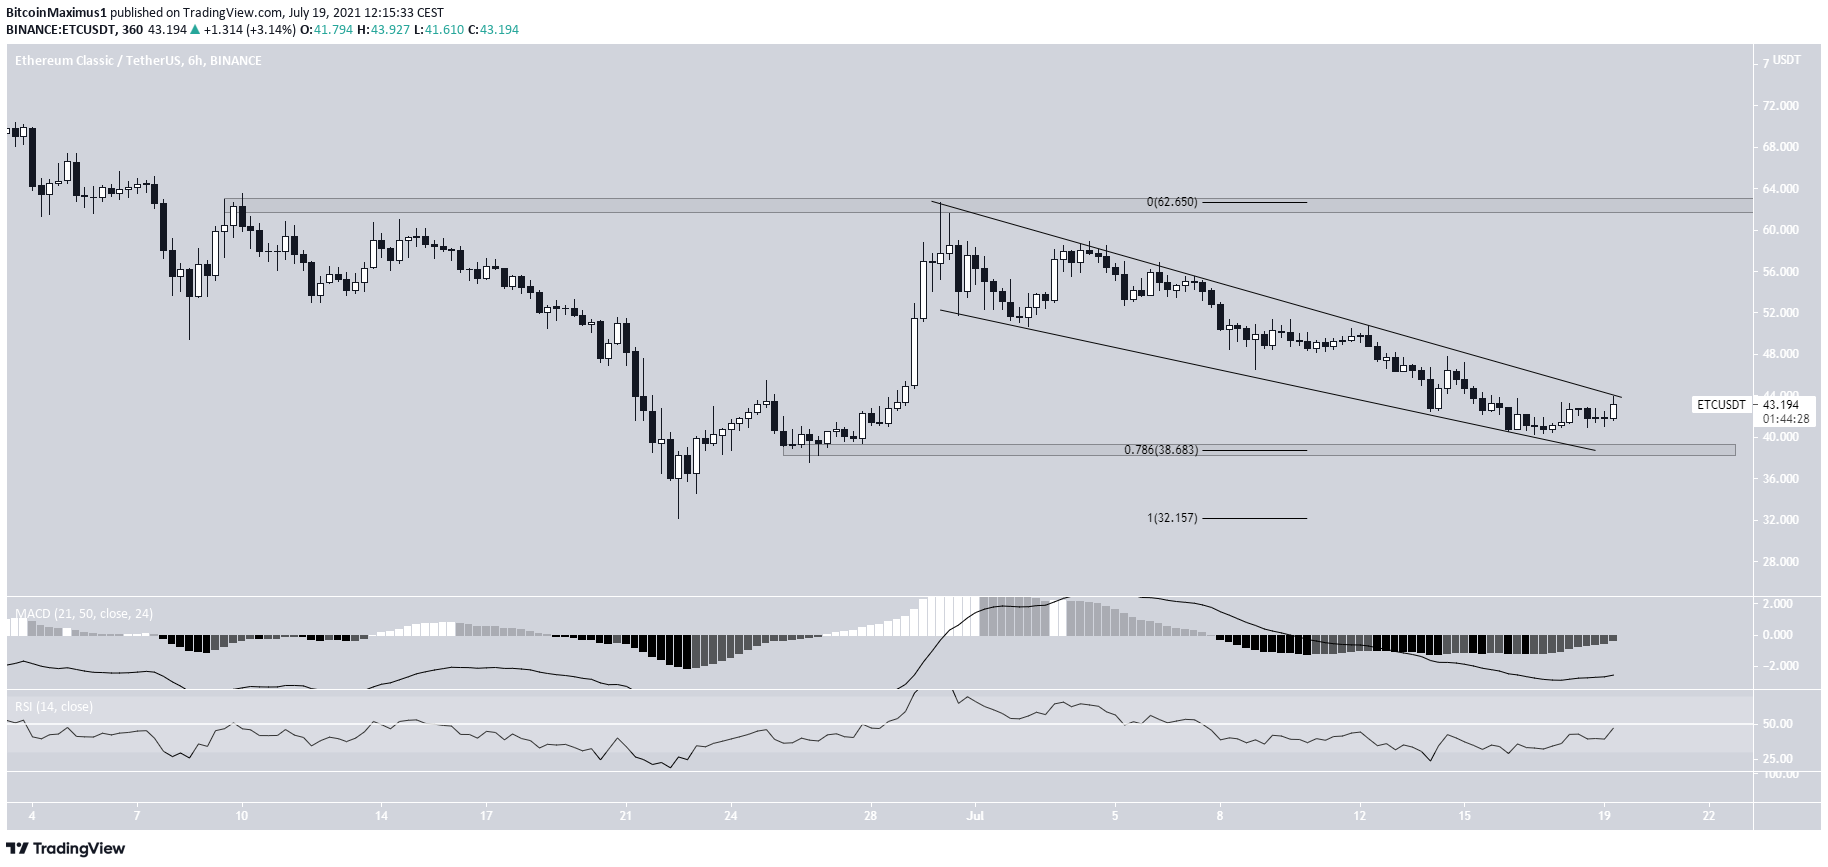
ETC has been trading inside a descending wedge since June 30. On July 16, it reached the support line of the wedge and bounced. Furthermore, the upward move began very close to the 0.786 Fib retracement support level at $38.70.
Currently, ETC is in the process of breaking out from this wedge. The liklihood of a breakout is also supported by both the MACD and RSI, which are both moving upwards.
If a breakout occurs, ETC would be expected to increase toward the $62.65 resistance area.

Highlights
- ETC is trading inside a descending wedge.
- There is support and resistance at $38.70 and $62.65 respectively.
For BeInCrypto’s latest BTC (BTC) analysis, click here.
The post ETH, XRP, ETC Struggle Sustaining Upward Moves While BTC Consolidates appeared first on BeInCrypto.


