Quick take:
- The average number of daily active Ethereum addresses has risen from 338,375 to 389,947 in the past 12 days
- During this time period, Ethereum’s network has grown by 13.2%
- The increased network activity is one reason Ethereum has its eyes set at $400
The month of October kicked off on a good note for all digital assets including Ethereum (ETH). According to the team at Santiment, the Ethereum network has also exhibited considerable network growth in the past 12 days in terms of daily active addresses.
The team shared their analysis via Twitter and explained that from September 1st to the 16th, the average daily active addresses on the Ethereum network was 338,375. However, in the past 12 days, that daily average has increased to 389,947. This translates to a growth of 13.2% in the mentioned time period.
Below is the tweet by the team at Santiment with a chart that provides a visual representation of the network growth seen in the Ethereum network.
The number of addresses interacting with the #Ethereum network has risen from a daily average of 338,375 from Sep 1-16, to 389,947 in the past 12 days. During this recent stretch of days, network growth for $ETH is up +13.2%! 🤝📈 https://t.co/umW5TeD0B3 pic.twitter.com/eOP6bLOhDf
— Santiment (@santimentfeed) September 30, 2020
Network Growth Translates to ETH Gaining Value
As has been pointed out by Timothy Peterson using Metcalfe’s law, network activity can be used to calculate the value of the corresponding digital asset that powers it. In this case, ETH is used to fuel transactions on the Ethereum network and high activity translates to a similar demand for the digital asset thus increasing its value. Furthermore, as network activity grows on the Ethereum network, ETH gas fees also increase.
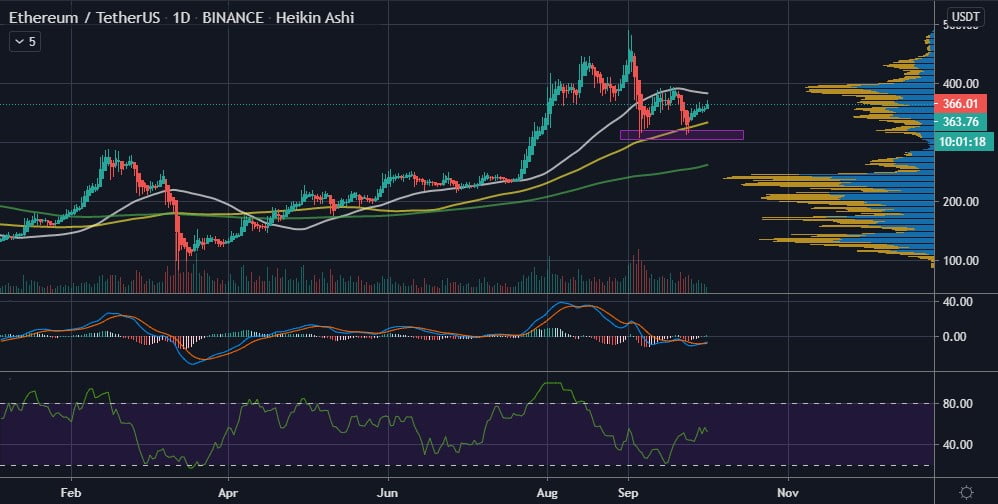
At the time of writing, Ethereum is trading at $366 and could be attempting once again to turn the $365 price area into support. Furthermore, the double bottom earlier identified at the $300 – $320 price range continues to play out, albeit at a slow pace.
A quick glance at the ETH/USDT daily chart above reveals the following information.
- Ethereum’s trade volume is in the green
- The daily MACD has crossed in a bullish manner below the baseline, with its histograms also in the green
- The daily MFI is at 52 which is neutral territory and could hint of either consolidation or another push up for Ethereum
- The 50-day moving average provides a level of resistance for Ethereum at the $380 – $390 price area
- Ethereum could very well be on its way to retest $400 if the market environment remains the same


