Investment bubble – how to easily recognize it and what are the risks?
6 min readTable of Contents

Today we will continue our series of educational articles and the topic is investment bubble, when we show how to recognize this phenomenon. I understand that this is compared to previous posts on Safe Haven a Risk-Off / Risk-On Krapet is a profaned topic, but at the moment it is a topical issue. In my analyzes, I often mention that the current state of the stock market is not very good.
Respectively, we can observe that we have been participating in the shares for several years blows investment bubble. And every speculative bubble must burst once, which is good to remember from time to time. Today, of course, governments and central banks have many tools to save markets. However, nothing lasts forever and at the same time it has all its consequences.
What is an investment bubble?
The bubble in the context of the financial market means an economic cycle that is characterized by a dramatic rise in market values. This economic cycle has two most basic phases. Prices first they grow steeply, up to meaningless values. Then theirs follows steep decline. First the bubble forms (prices rise fast) and then bursts (prices are falling fast).
It’s a pretty pejorative concept, but it actually fits. After all, if any bubble bursts, the market crash is very fast and panic. Just a few days and a substantial part of the capital can easily disappear forever, as it was in the late 1920s. From a technical point of view, it is quite easy to recognize the bubble, which we will show in a moment.
From a fundamental point of view, this is also not a problem, but it does not have to be so striking. However, if the overall market is strong overpriced (for example, according to the P / E indicator) and the prices of titles that have no profit are in abundance, you can be sure that there is an investment bubble in the stock market. However, the truth is that until the investment bubble completes its cycle (bursts), we have no chance to guess its top.
It can only be stated that the expansion is at its peak. Bubbles can inflate for years. Even in the 1920s, investment mania lasted for several years. And that was a time when the Federal Reserve did not intervene at all, respectively the markets did not support in any way.
While today the central bank through basic interest rates a quantitative release stock market to a large extent supports. Otherwise, I will allow myself a brief comment on the attached chart. As I said, the then stock mania lasted for years, at least since 1921. By 1929, the value of the index had increased by about 500%.
Investment mania began to peak during 1928, when price expansion began to have a vertical structure. In the fall of 1929, the investment bubble burst, followed by a tough bear market that, in less than three years, meant for the Dow Jones devaluation about 90%. The vast majority of capital disappeared from the market at that time. It took 26 years to return to ATH.
Investment bubble and its anatomy
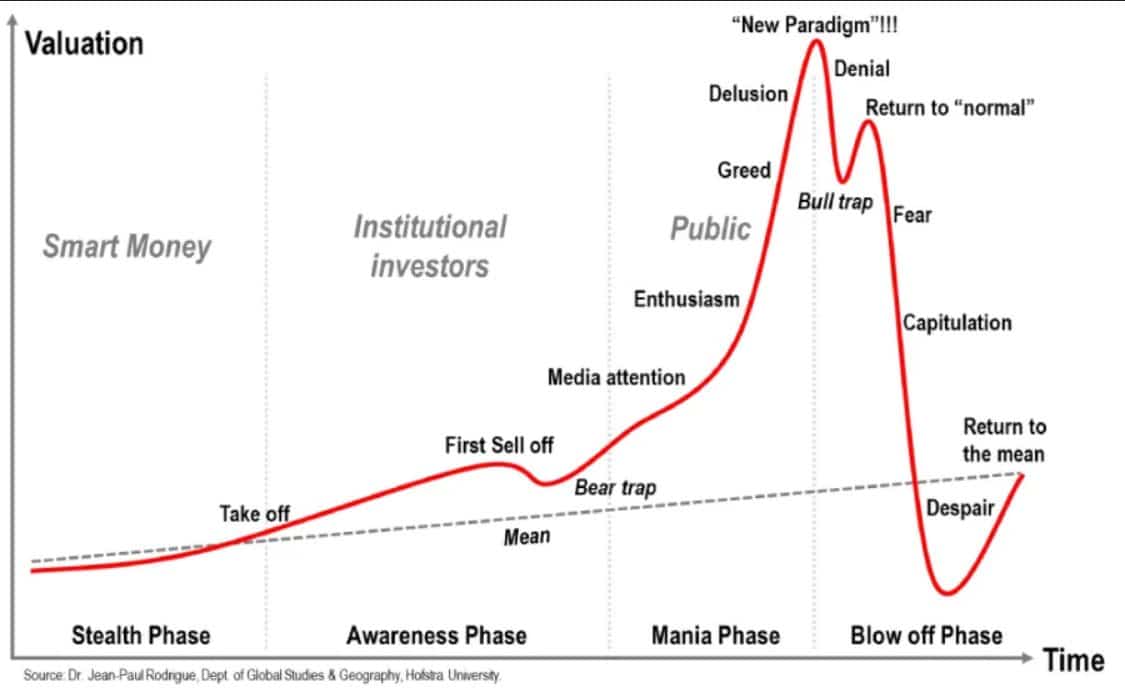
The following chart is certainly known to many of you, and in a moment we will show it in a specific market. As we said a moment ago, an investment bubble is in itself a kind of cycle of price growth and then decline. However, the bubble can be characterized by other psychological phases.
The first is the so-called Stealth Phase, when the asset is brand new or still very young. These are actually the first beginnings, when only a small group of people know about the asset. He is the type of people who somehow sympathize with the company or are fans of the technology.
This small group is also the only one that is able to realize the potential value of the stock at that moment. Therefore, they are sometimes referred to as the so-called Early Adopters. Of course, at this stage, the so-called Smart Money. That is, large institutions that see potential in some cheap stock.
In phase Awareness the shares get into the viewfinder of the big capital. By this we mean various funds, investment banking houses. There will also be a first sell off, as former investors collect part of the profits. This sale results in bear trap (bear trap). At the end of this phase, the market is beginning to be noticed by the media.
The next chart is the same as the previous one, but already shown on the Nasdaq technology index. Then dotcom bubble is absolutely textbook example, which is still used for technical visualization of speculative bubbles in financial markets. The Nasdaq index rose by about 1,700% from 1987 to the turn of the millennium. Subsequently, the index lost almost 80% of its all-time high.
Mania Phase (mania) probably doesn’t need to be described that much. Media interest will increase significantly, which will start to bring to the market crowds of retail investors who have no financial education and are also without any experience. Media interest is constantly rising and there is public speculation about future price growth.
There is a lot of sound during these speculations high numbers that are overwhelmingly absolute unreal. As a result, the price is still rising sharply and it seems to have no end. And even the most patient, who watch it for a long time, can no longer stand and also invest. Retail investors are getting into delusion, that the price will rise for a very long time.
The last stage is the so-called Blowoff Phase when the investment bubble is so inflated that its bursting is inevitable. So there will be the first unexpected and big slump, which of course scares retail investors. The price drop is not so extreme yet, but more experienced investors already know that market conditions have changed.
After falling, the price stabilizes at several-month-old levels and then continues to rise again. Everything seems to be fine and retail investors are calculating that the markets will soon reach a new all-time high. As in the attached chart with Nasdaq, under bull trap up to 60% of losses from the first slump were erased. Then, however, the decline began to continue and lasted until the market completely did not purify.
Financial bubble and foundation
Is it possible to detect a financial bubble on the basis of a foundation? It is clear from the fact that the market is fundamentally changing risk-off sentiment. As we showed in the risk-off / risk-on article, the steady rise in value on the dollar index at the time reliably indicated that market conditions were deteriorating dramatically. In short, the fundamental background changed, and this was reflected in the dollar index chart.
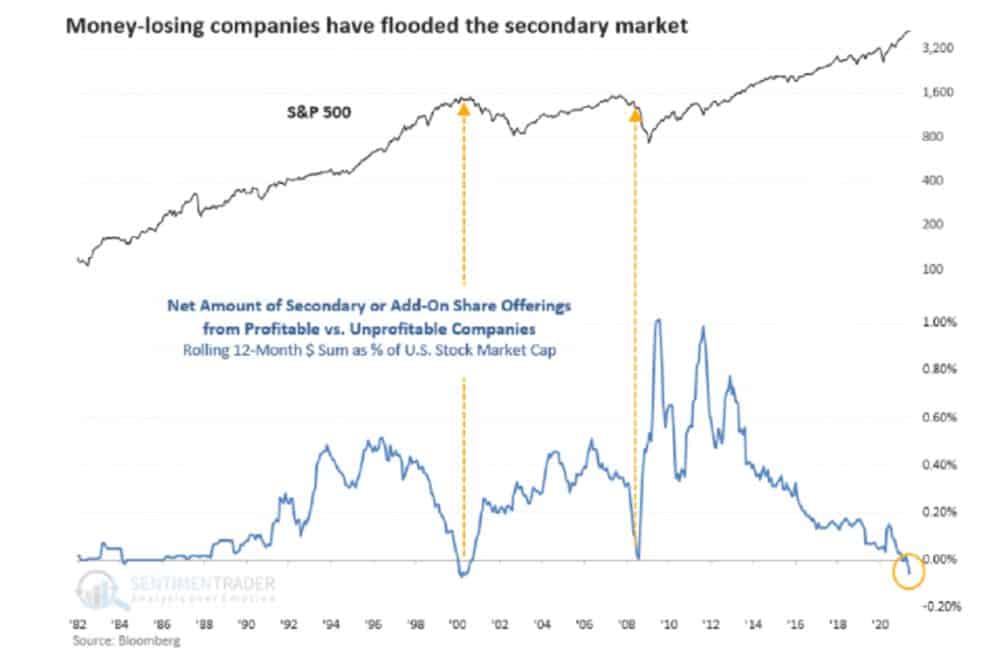
However, there are other tools that will tell you that something is fundamentally wrong. The graph you have in front of you visualizes the net number of for-profit companies listed in the S&P 500 index. When the dotcom bubble came to an end in 2020, there were already more companies in the index that they did not generate any profit at all.
When stocks are at their all time high and they still tend to rise sharply, even though most titles do not generate a profit at all, is not a natural condition. The situation was similar in 2008 and in 2021 we even surpassed the dotcom bubble.
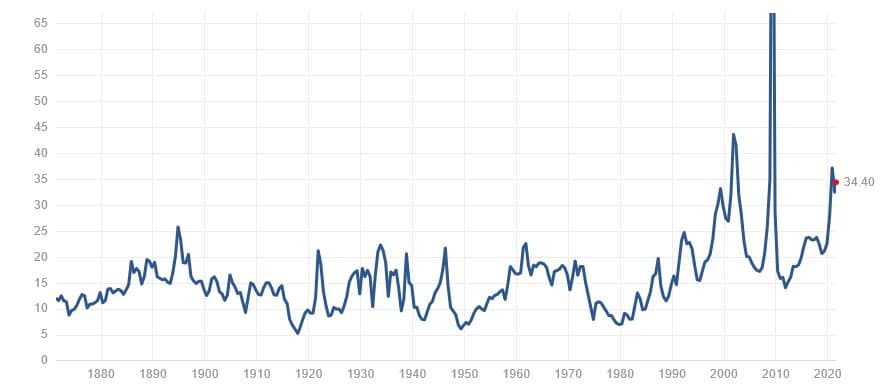
Then there is the possibility in the form of ordinary P / E ratio to the S&P 500 stock index. As the chart shows, in 2000 the ratio reached almost 45 points. In 2009, even an extreme 124 points. Anything over 20 points is enough. Levels around 50 points are already very high and they tell us there is a market overpriced.
In conclusion
The investment bubble is for every investor huge risk because after its collapse, the portfolio is completely decimated. That is why it is extremely important to be able to recognize a potential bubble, which I do not think is such a science. You need to keep rationality and put emotions aside, then it goes much better.
ATTENTION: No data in the article is an investment board. Before you invest, do your own research and analysis, always trading only at your own risk. Cryptheory team strongly recommends individual risk considerations!

