IOTA (IOTA) has been decreasing since Feb. 19, but has bounced at an important Fib retracement level.
Along with IOTA, Zcash (ZEC) has broken out from a long-term resistance area at $110 and validated it as support afterward. Similarly, QTUM has broken out from and validated the $4.80 area as support.
IOTA (IOTA)
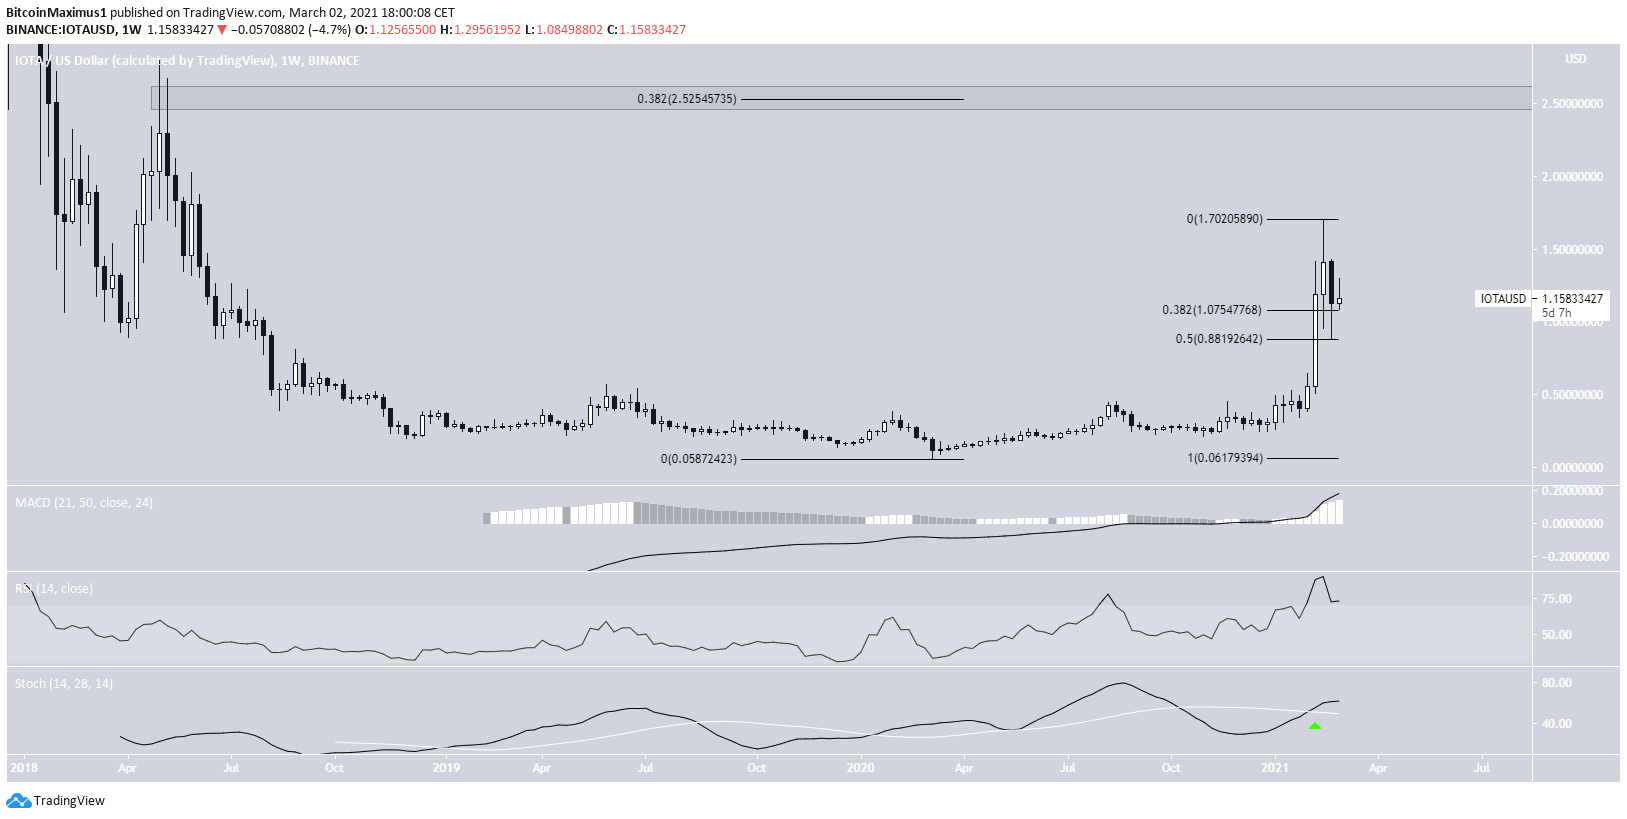
IOTA has been moving downward since reaching a high of $1.70 on Feb. 19.
While it has created a bearish candlestick on the weekly time-frame, IOTA has bounced at the 0.5 Fib retracement level and managed to reach a close above the 0.382 Fib at $1.07.
Furthermore, technical indicators are bullish, as evidenced by the bullish cross in the Stochastic oscillator (green arrow), suggesting that the trend is bullish.
If IOTA resumes its upward trend, the next closest resistance area would be found at $2.52.
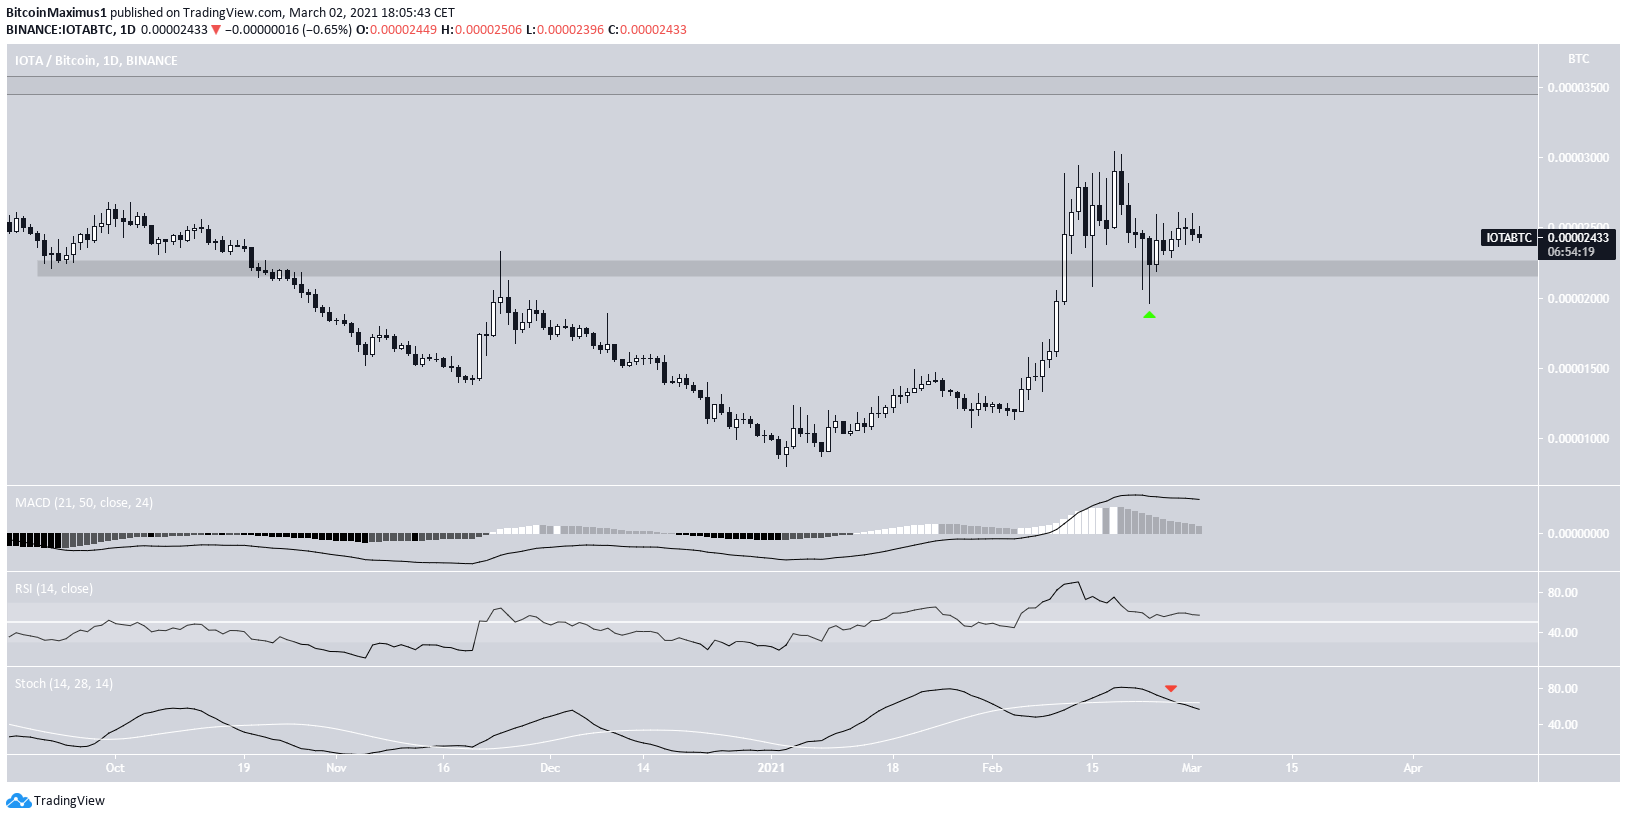
The IOTA/BTC pair is also bullish, since the chart shows a breakout from the 2200 satoshi resistance area and its subsequent validation as support.
Despite a bearish cross in the daily time-frame, both the MACD & RSI are still bullish. Therefore, as long as IOTA does not reach a close below the 2200 satoshi area, it would be expected to continue increasing towards the next closest resistance at 3500 satoshis.
Highlights
- Long-term indicators for IOTA/USD are bullish.
- IOTA/BTC is trading above support at 2200 satoshis.
Zcash (ZEC)
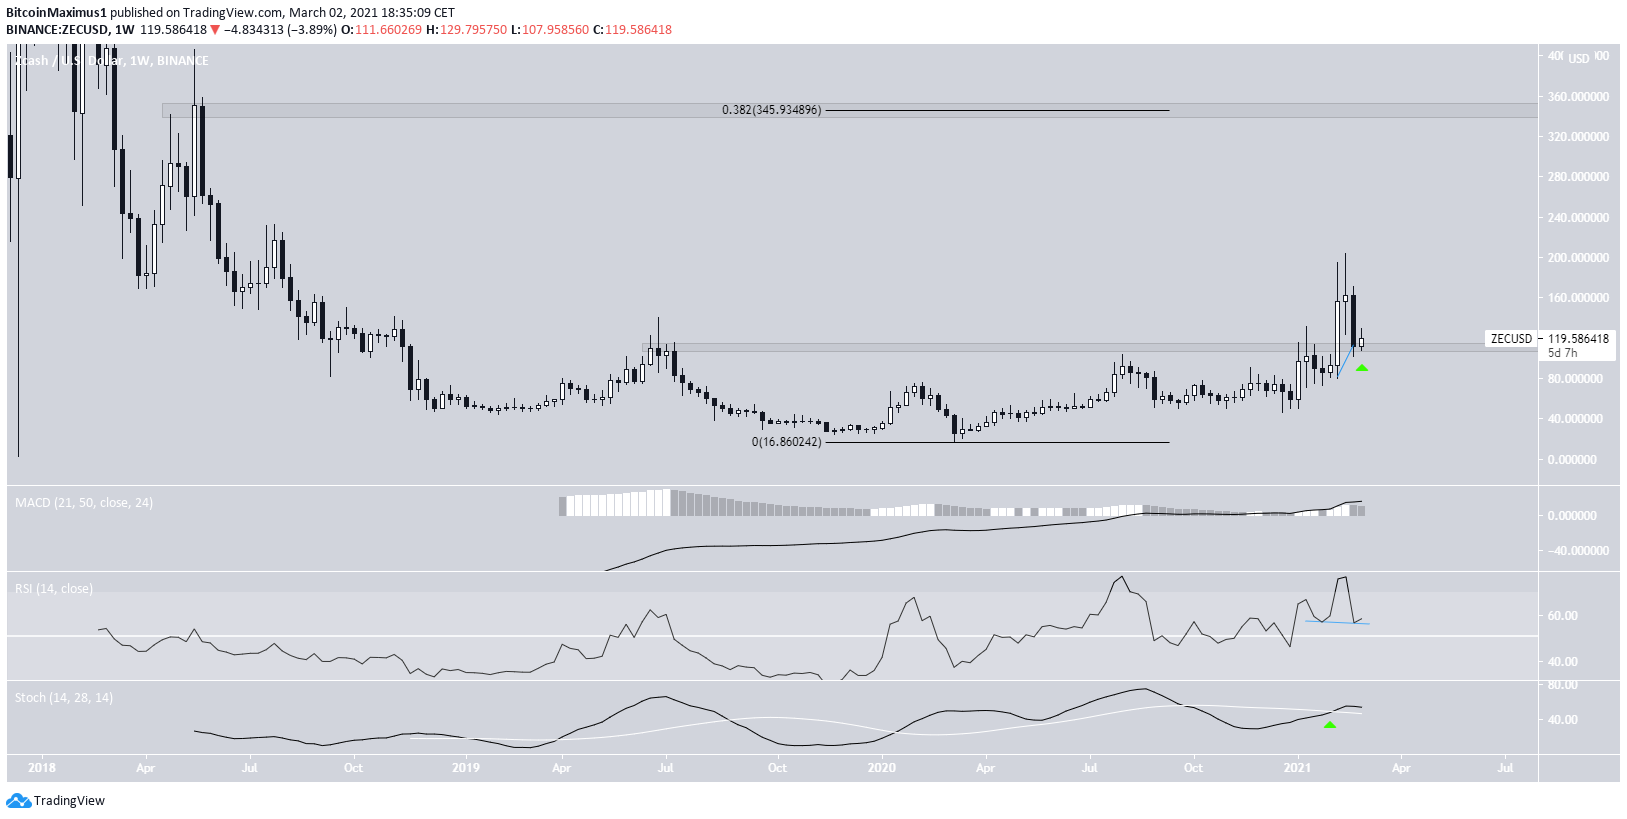
While ZEC has been decreasing since Feb. 19, creating a significant bearish candlestick last week, it has returned to validate the previous resistance area at $110 as support.
As long as it is trading above this level, the trend is considered bullish and ZEC is expected to continue increasing.
Technical indicators are bullish since the Stochastic oscillator has made a bullish cross and the RSI has generated hidden bullish divergence.
If ZEC continues increasing, the next resistance area would be found at $345.
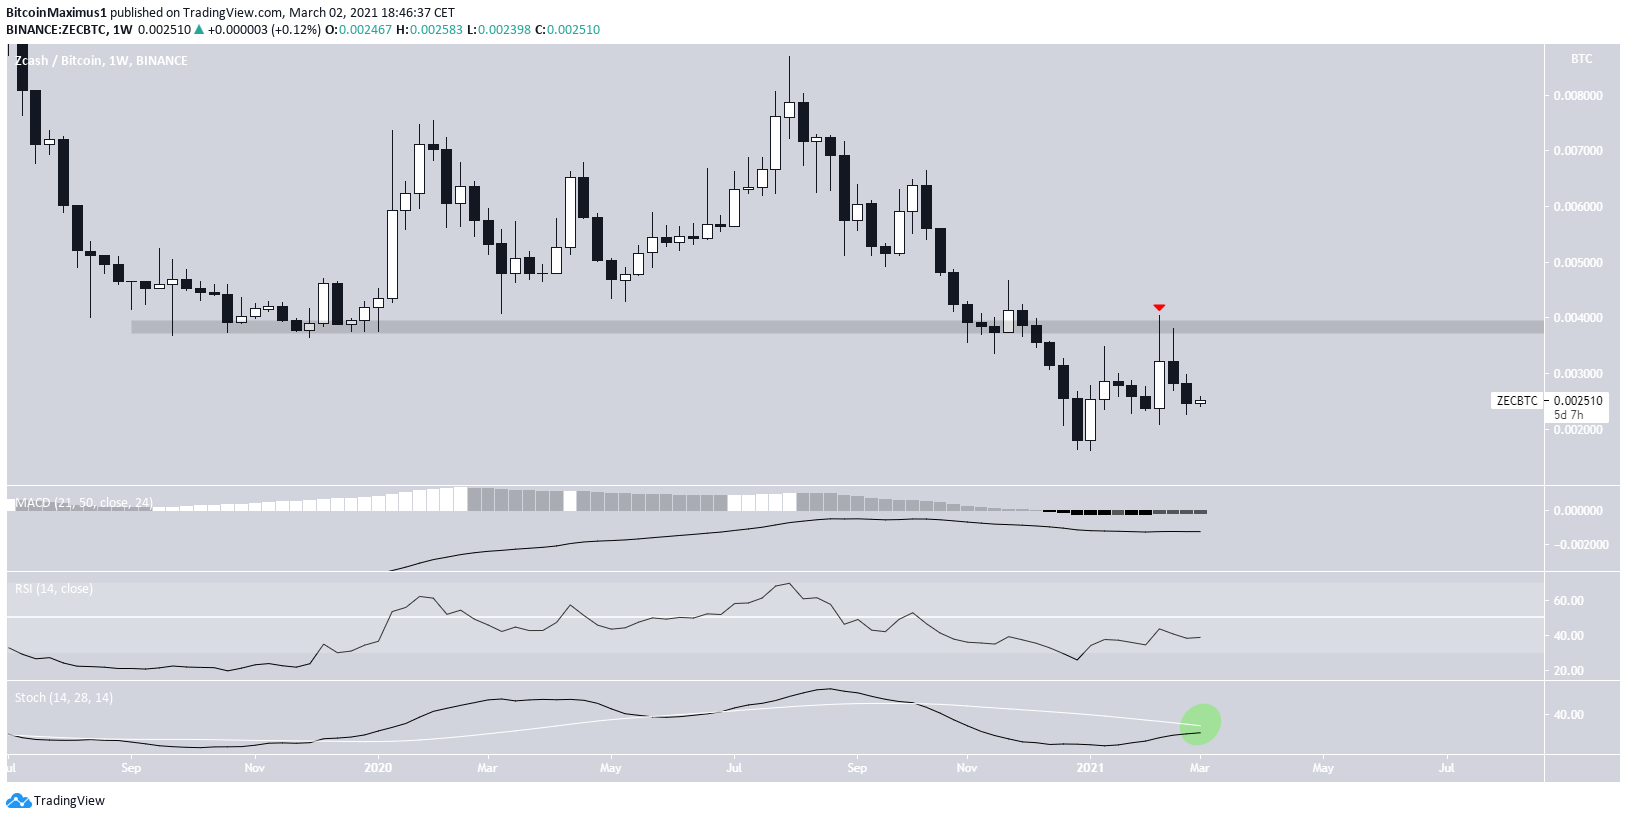
The ZEC/BTC pair does not look as bullish as its USD counterpart.
While ZEC has been increasing since reaching an all-time low price of 16,065 satoshis, it is still trading below the previous breakdown level at 38,000 satoshis.
Until ZEC reclaims it, we cannot consider the trend bullish.
Similarly, while indicators are showing bullish signs, we cannot confirm the bullish trend reversal until the RSI crosses above 50 and the Stochastic oscillator makes a bullish cross (green circle).
Highlights
- ZEC/USD is trading above support at $110
- ZEC/BTC is trading below the 38,000 satoshi resistance area.
Qtum (QTUM)
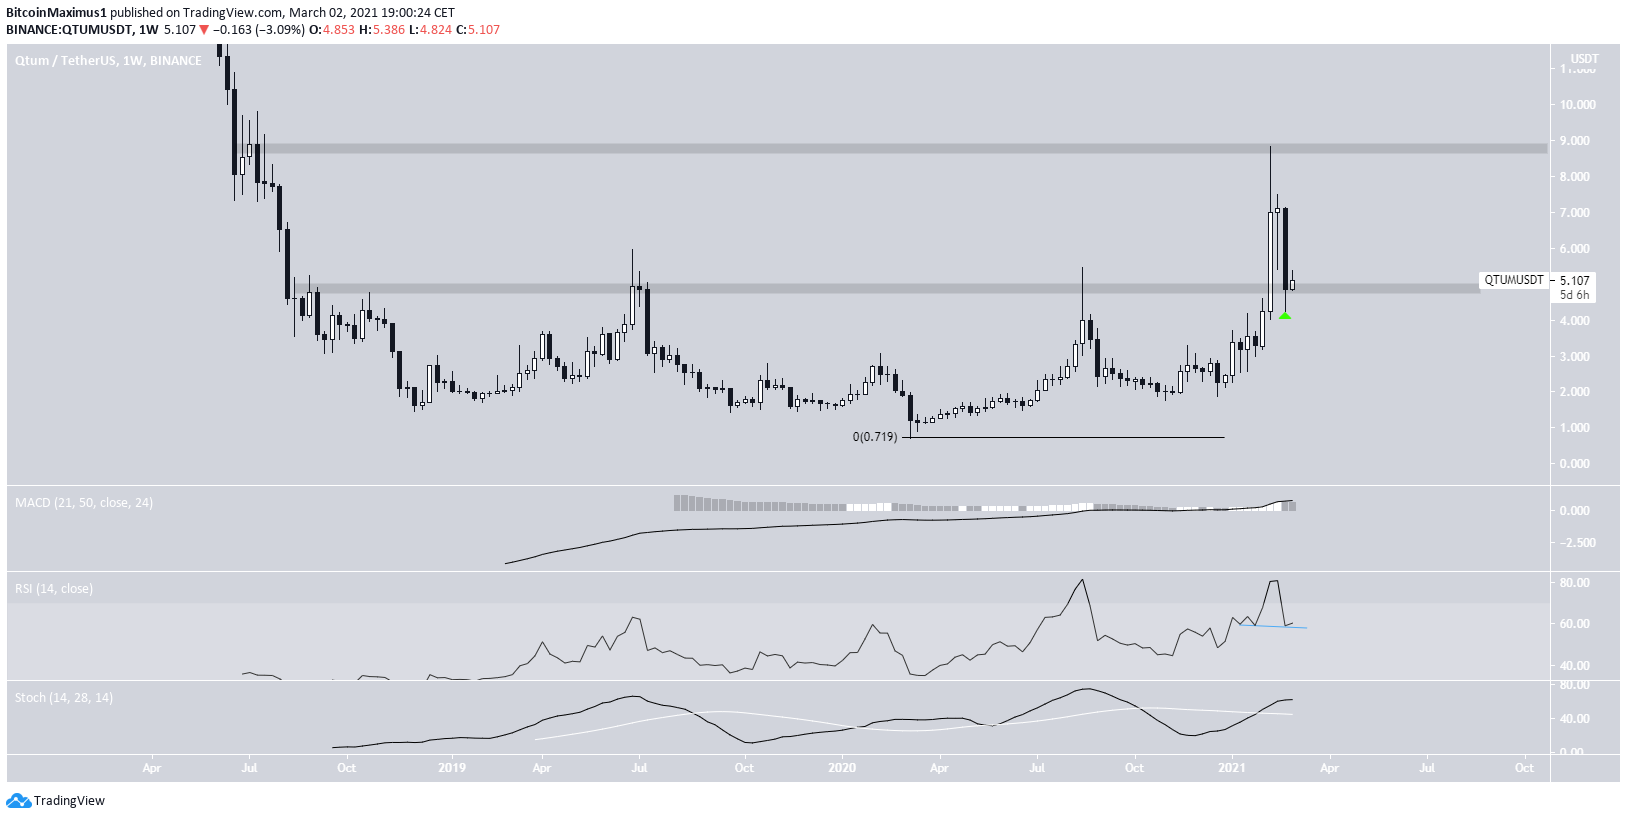
The price movement for QTUM is similar to that of ZEC. After trading below the $4.80 resistance area since Jul. 2018, QTUM managed to break out in the beginning of February and reached a high of $8.98.
Last week’s decrease has taken QTUM back to the $4.80 area, which is now expected to act as support. Both the MACD & Stochastic oscillator are increasing, and there even is a hidden bullish divergence in the weekly RSI, a strong sign of trend continuation.
If QTUM continues increasing, the next closest resistance area would be found at $8.80.
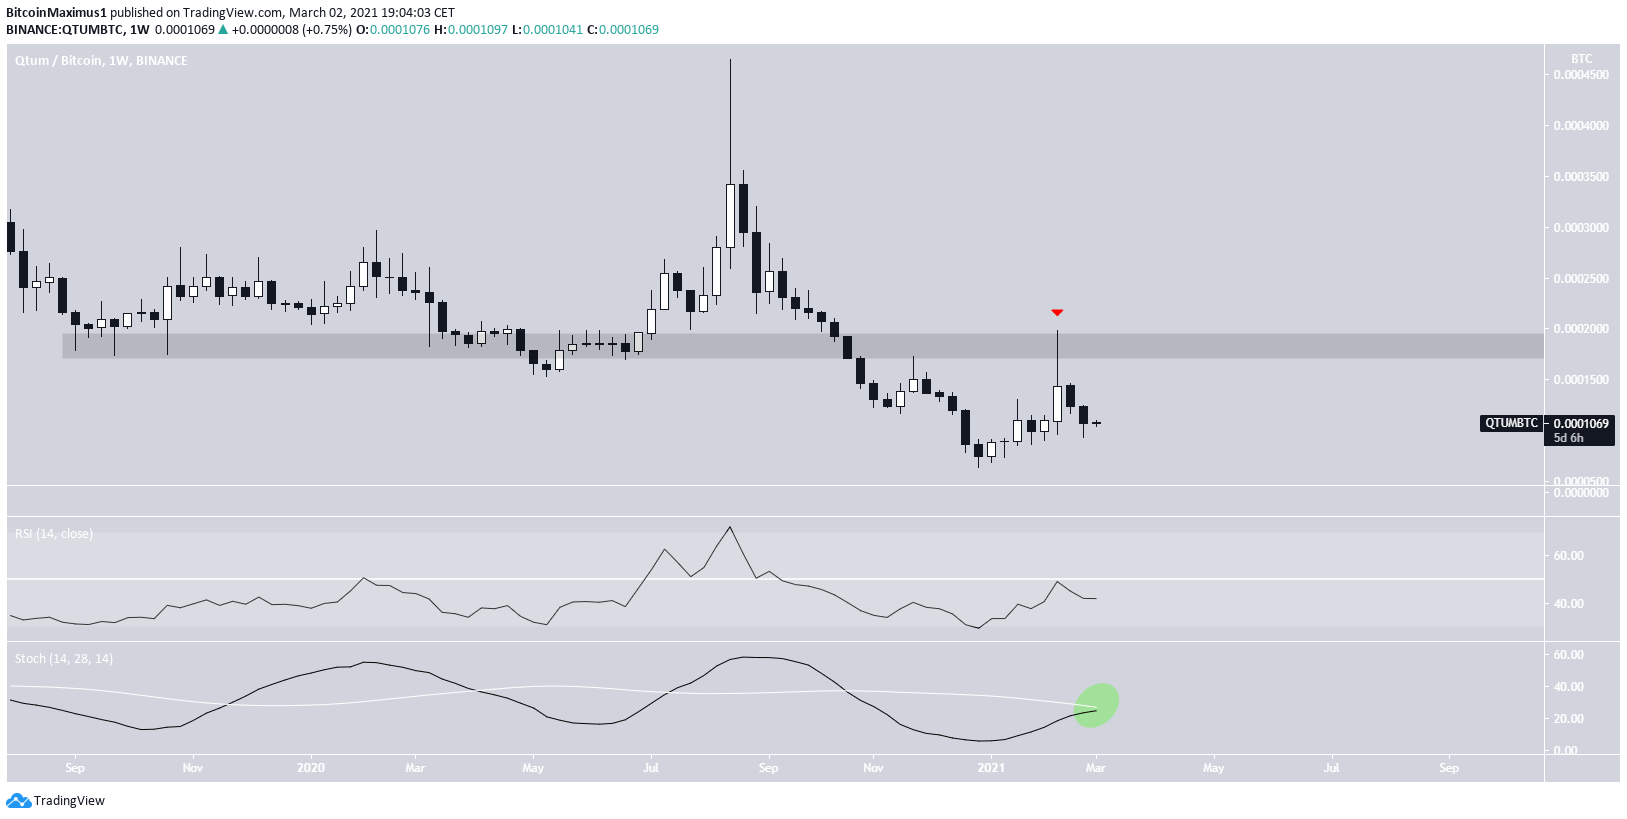
The QTUM/BTC pair has been moving upwards since an all-time low of 636 satoshis was reached on Dec. 28.
However, QTUM has failed to reclaim the 1800 satoshi resistance area, which is the previous breakdown level.
Despite the possible bullish cross in the Stochastic oscillator, we cannot consider the trend bullish until QTUM reclaims the 1800 satoshi area.
Highlights
- QTUM is trading above the $4.80 support area.
- QTUM/BTC is trading below resistance at 1800 satoshis.
For BeInCrypto’s latest Bitcoin (BTC) analysis, click here.
The post IOTA, ONT & QTUM: Technical Analysis For March 2 appeared first on BeInCrypto.


