KSM Finds Support After Breakdown
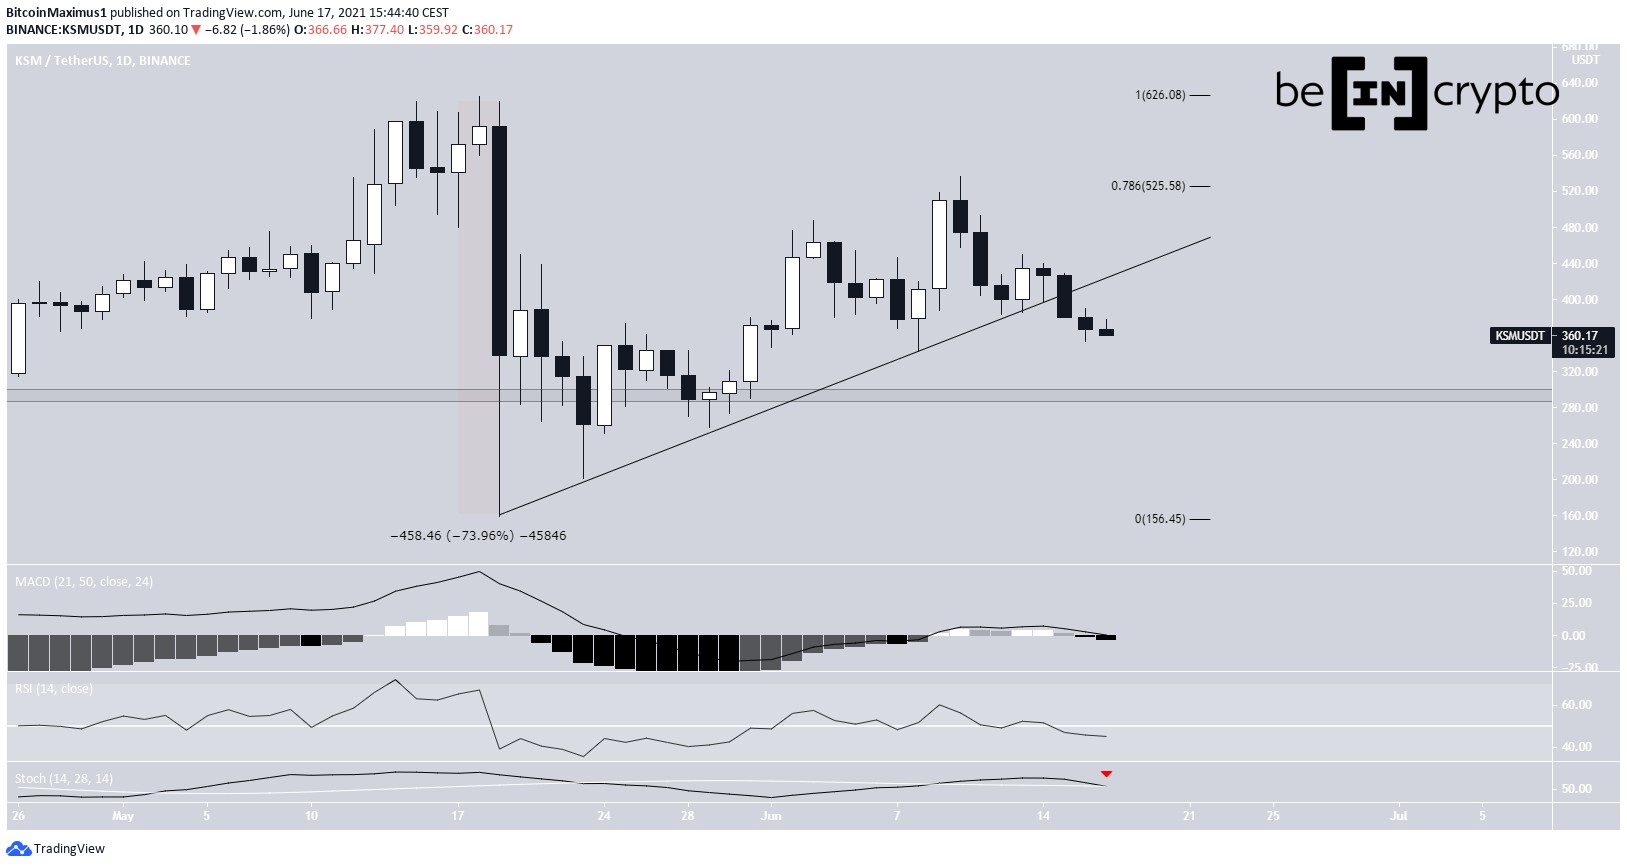
2 min readKusama (KSM) has been moving upwards since May 19, but broke down from an ascending support line on June 15.
It is trading inside a short-term bullish pattern, from which a breakout would be likely.
KSM bounce and breakdown
KSM was subject to a sharp decrease on May 19, at one point plummeting by 74.4%. This led to a low of $158.75 being reached.
However, an intense bounce followed, and the token has been moving upwards since.
KSM resumes its ascent alongside an ascending support line until it reached a high of $537 on June 10. The high was made right at the 0.786 Fib retracement resistance level.
What followed afterwards was a rejection that caused a breakdown below the ascending support line.
Currently, the token is approaching the long-term $290 support area.
Technical indicators in the daily time-frame are bearish. The MACD has crossed into negative territory, the RSI has dropped below 50 and the Stochastic oscillator has made a bearish cross (red icon).
Therefore, it is possible that a revisit of the $290 area will occur.

Short-term movement
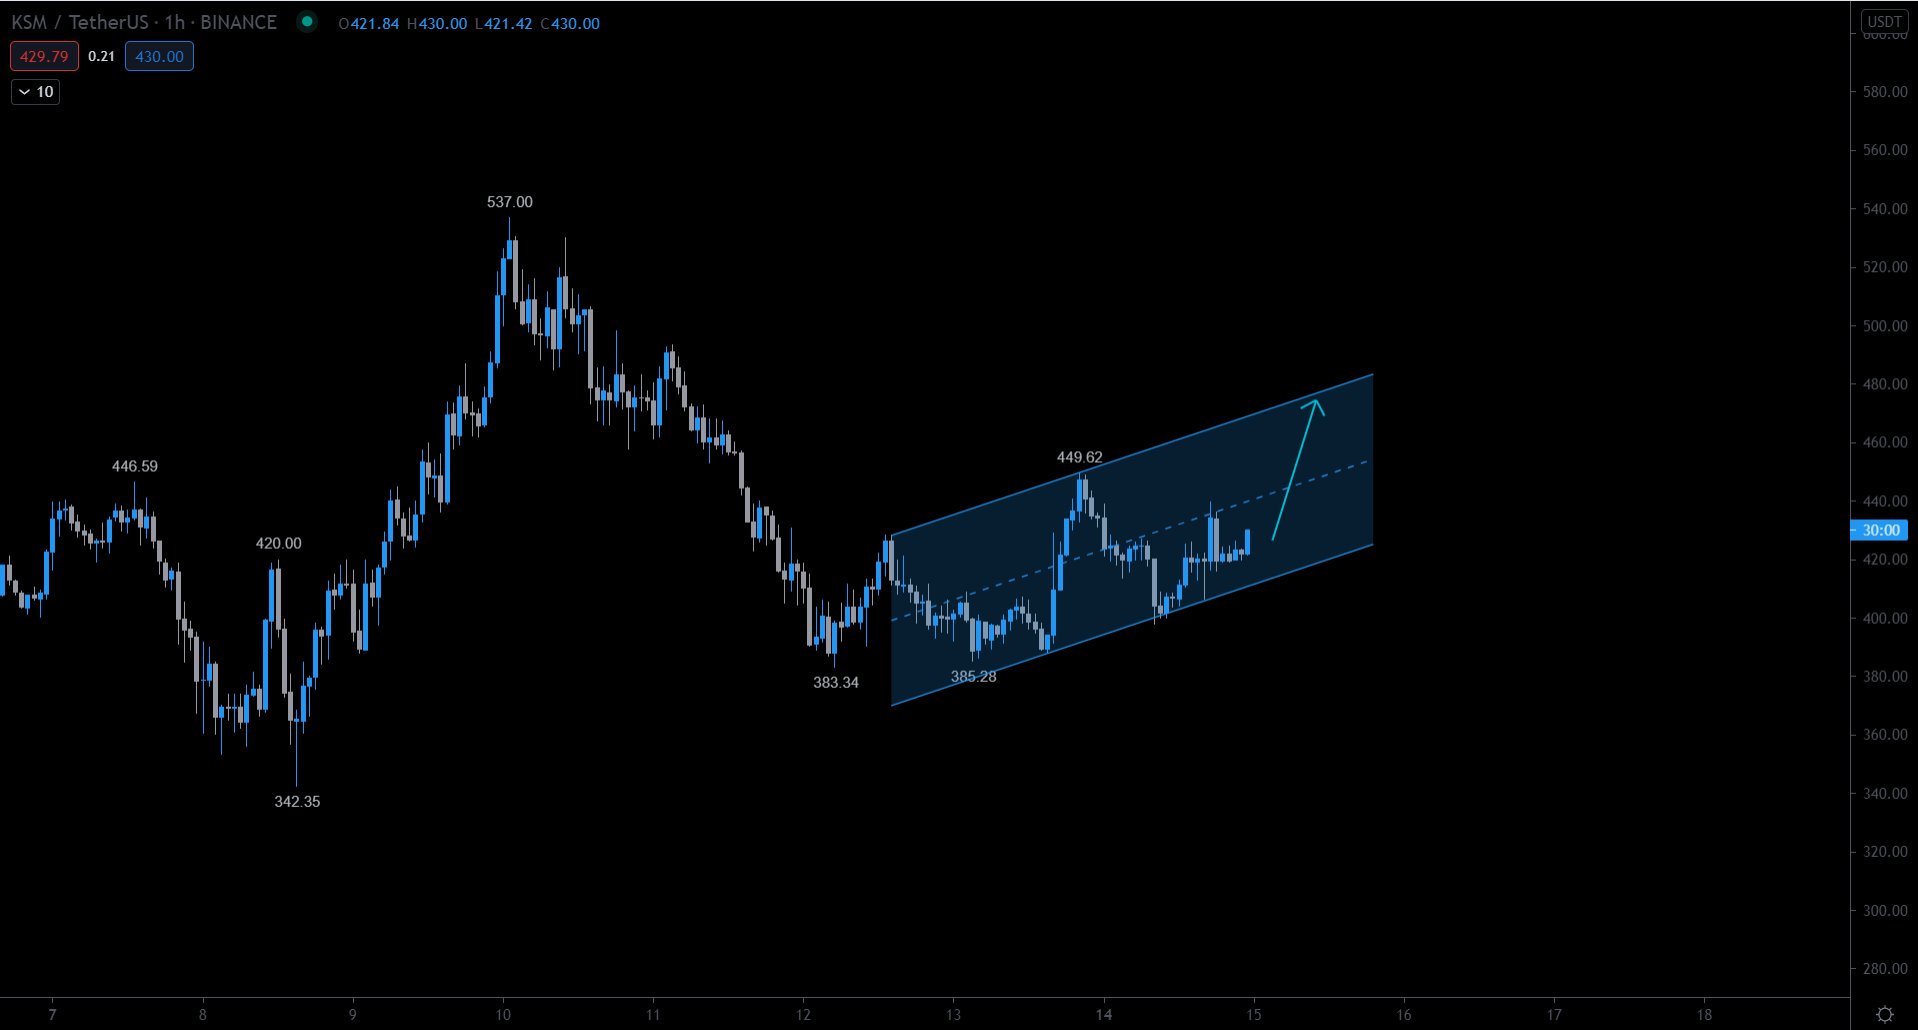
Cryptocurrency trader @TradingTank outlined a KSM chart, stating that it is likely to increase towards the resistance line of the current parallel ascending channel.

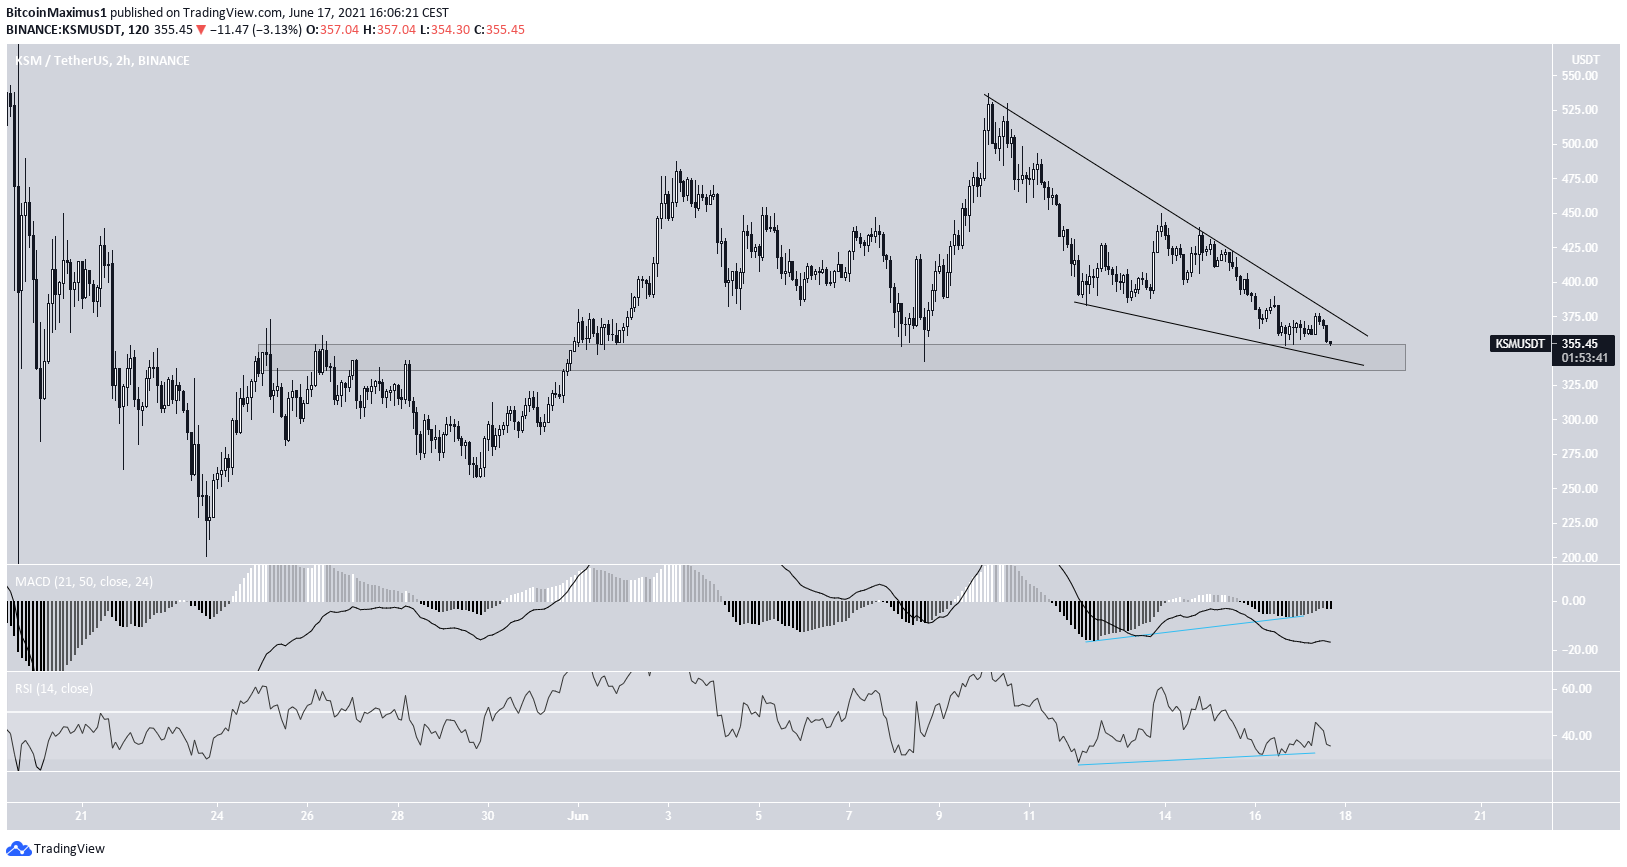
However, the token has broken down since the tweet. However, it has reached the minor $350 support area and is trading inside a descending wedge, which is considered a bullish reversal pattern.
In addition to this, both the RSI & MACD have generated bullish divergence.
As a result, a bounce at the support line and breakout from the pattern would be expected.
Despite this, the long-term trend is still likely to remain bearish.

KSM/BTC
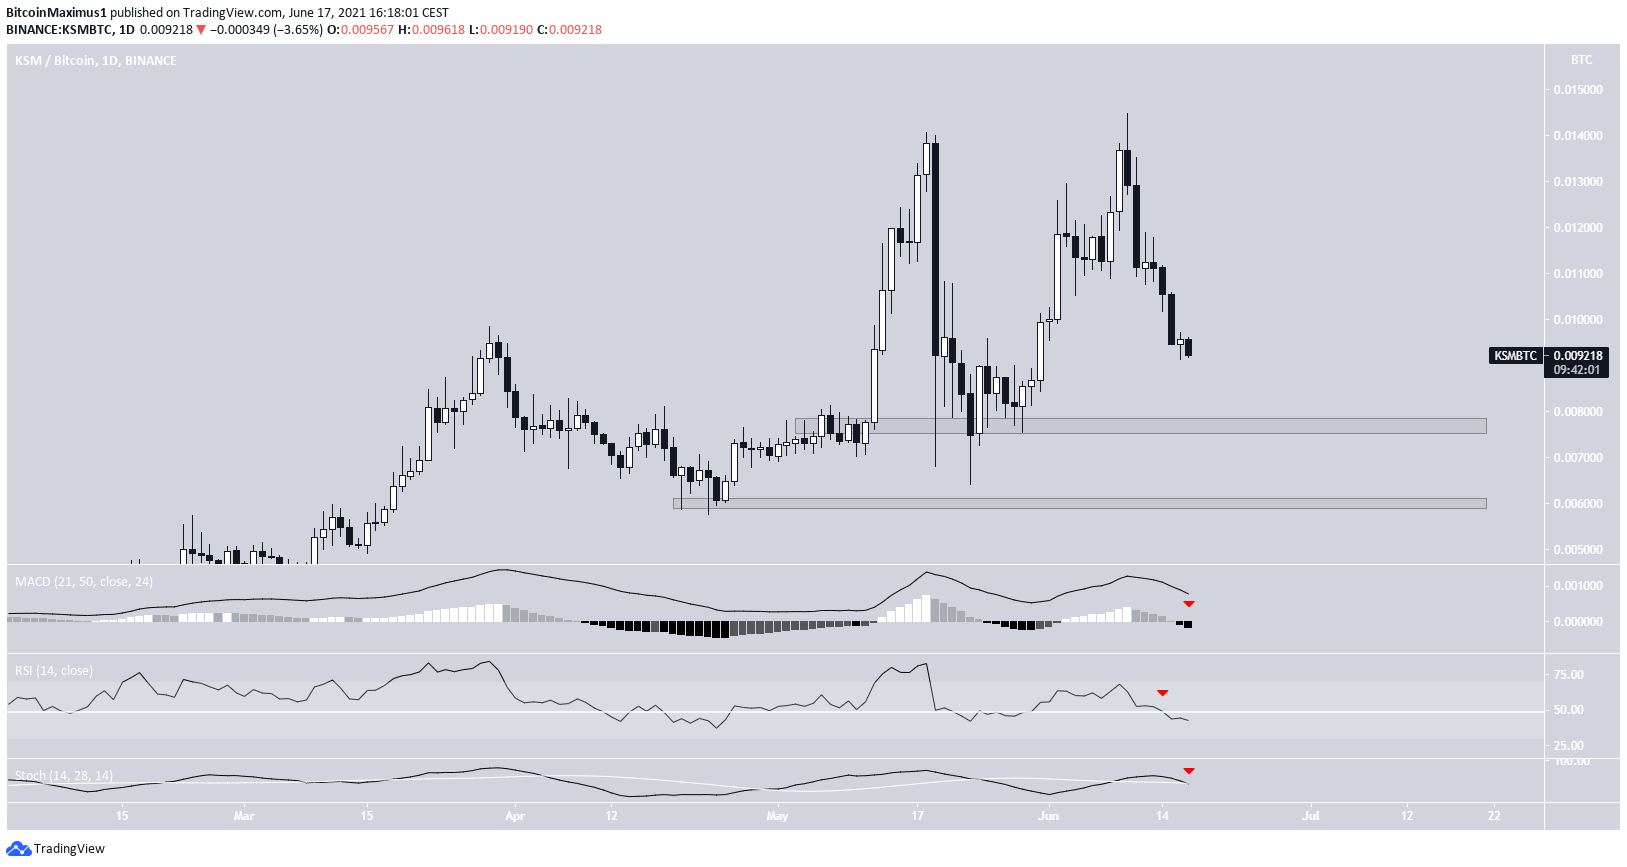
The KSM/BTC pair provides a similarly bearish outlook.
The token has been moving downwards since reaching an all-time high price of ₿0.0144 and creating a double top pattern on June 10.
Similarly to the USD pair, technical indicators are bearish.
The next closest support levels are found at ₿0.0079 and ₿0.006.

For BeInCrypto’s latest BTC (BTC) analysis, click here.
The post KSM Finds Support After Breakdown appeared first on BeInCrypto.


