Market cycle indicators – what do they tell us about the current state of the BTC market?
3 min read
Let’s look at some key on-chain market cycle indicators: what do they tell us about the current state of the BTC market? Today, we will look at some indicators to compare current values with historical ones and show when they indicate that the market is ready to bottom or peak, or that the values are neutral.
Based on about 20 on-chain market cycle indicators that we monitor, the market setting seems to range from neutral to bullish. However, we understand that the on-chain, macro-environment and state of the BTC derivatives market have an impact on BTC’s growth trajectory in one way or another, especially given its current high correlation with risky assets.
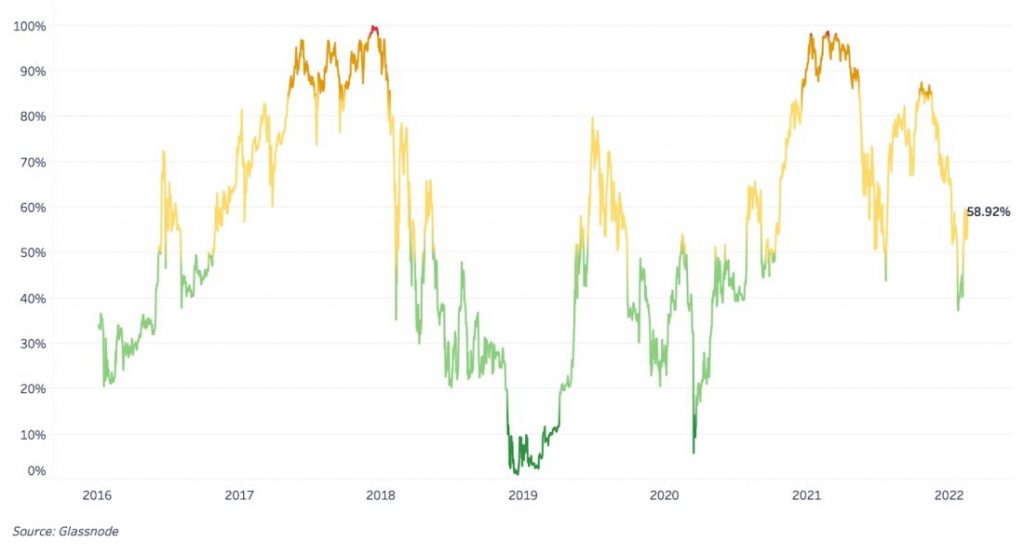
The ratio of the market value of BTC to the realized value (MVRV) monitors the current state of the market price in relation to the realized price of BTC for the current holders, or “fair value”. The Z-score for MVRV, MVRV-z, adds a standard deviation of market capitalization to the calculation to provide a better signal.
BTC price highs in 2021 did not take place as the peaks of previous cycles – with a period of parabolic growth, a sharp peak and a subsequent decline. But after a relatively smaller increase, it is probably reasonable to expect a relatively smaller decrease. To date, the BTC MVRV-z indicates neutral market conditions after several price increases from the $ 30,000 zone.

Further movement down to the “oversold” zone below the 15th percentile of the indicator so far seems unlikely unless there is a sudden sell-off caused by an unforeseen event (black swan).

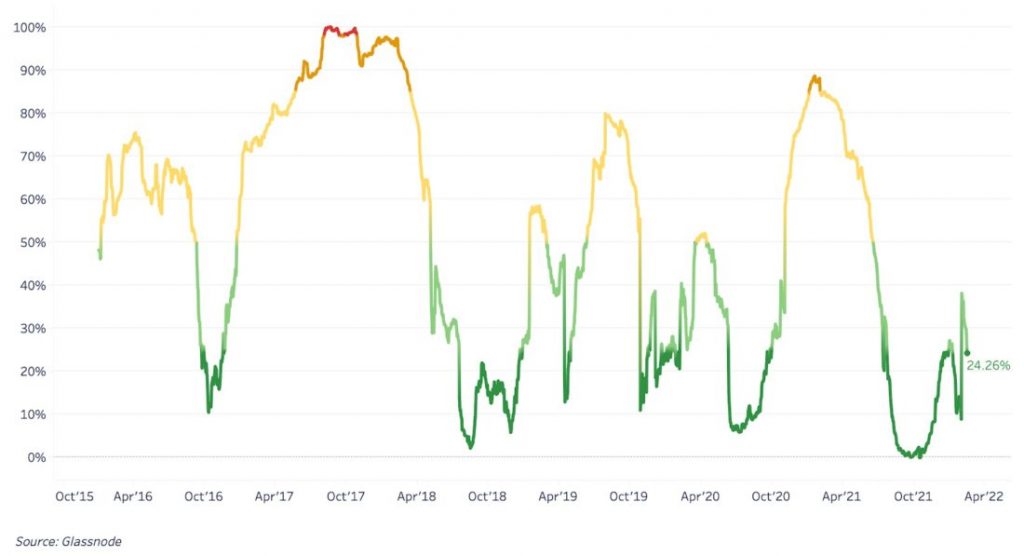
The 90-day Coin Days Destroyed (CDD) is another important indicator that helps analyze the activity of long-term holders. While the peak of the BTC in May 2021 may have seen an increase in the number of CDD, there has been no significant increase in long-term holders’ spending at the November peak. In the last few months, the old coins have hardly moved, suggesting that most “smart money” is sitting quietly waiting to grow, with no intention of breaking with its BTC at current prices.

In the last few months, the values of the indicator indicate a period of accumulation ranging from medium to active, with the 90-day CDD moving below its 25th percentile.

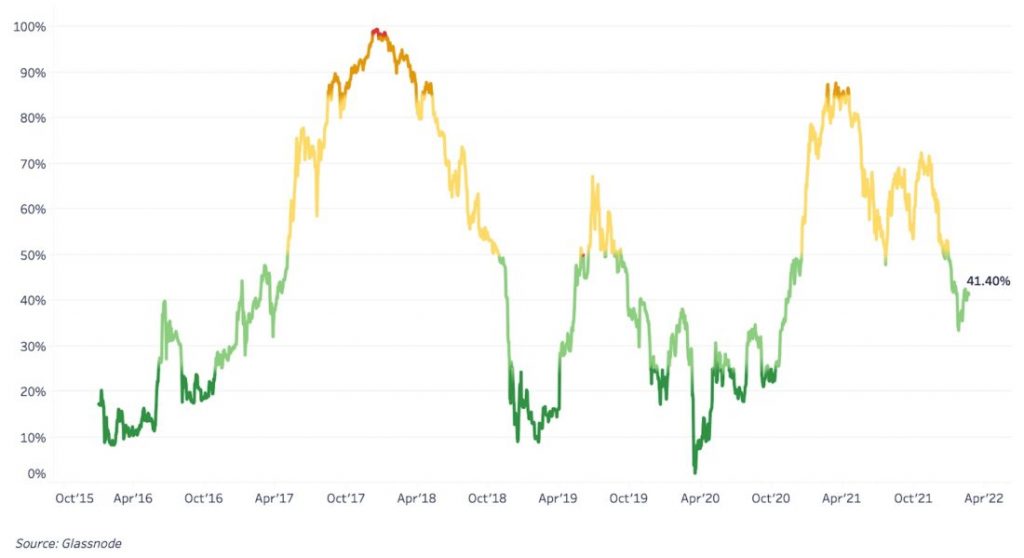
Reserve Risk is a more sophisticated on-chain indicator that evaluates the risk / return ratio for investing in BTC based on the beliefs of its long-term holders. The indicator is calculated as the ratio of the BTC price to express the beliefs of long-term holders.
Reserve Risk is currently accelerating and rebounding from the bottom when the price of BTC fell to $ 35,000. Throughout BTC’s history, Reserve Risk has generated very few “maximum opportunity” buying signals. The current values of the indicator, which is in the “opportunity” zone, confirm our assumption of a smaller decline after a more moderate and neutral market peak in 2021.

Low values of reserve risk are observed with a high conviction of hodler against the background of relatively low prices. And this is another metric that suggests strong confidence among long-term holders in BTC’s future growth prospects.


