Technical analysis ETH / USD – significant losses wiped out, but volumes stagnate
2 min readThis time we will focus again on ETH, to which we have not devoted any time at all. As today’s headline suggests, ETH has erased a substantial part of its losses. However, the last few days are almost without progress and the fresh structure of the market does not seem to me to be corrective. It’s quite confusing.
Current situation at 1D TF ETH / USD
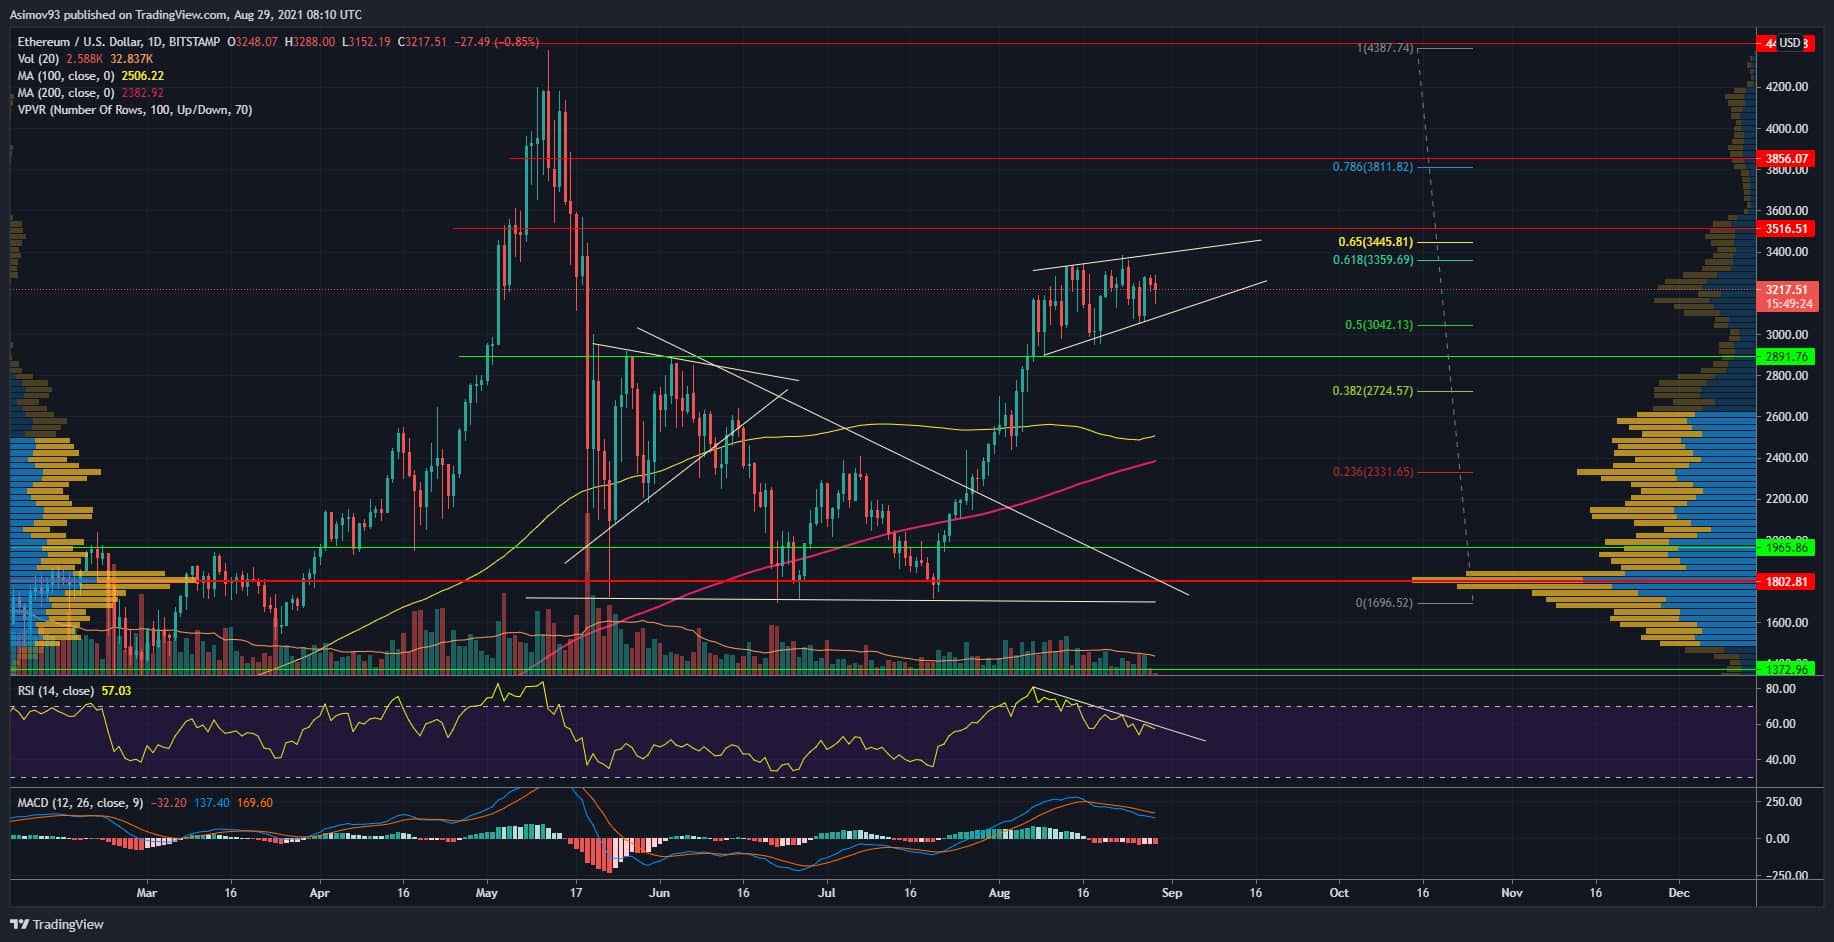
If I remember correctly, in the last analysis for ETH, price just broke $ 2,891, which was a significant and rapid progress. The market was thus able to completely break the bearish structure that had been forming in our chart since May. Volumes grew, Price Action was very dynamic. But that changed about two weeks ago.
Volumes have stagnated at first glance since then, which is not a very good sign. As if the market didn’t know where he wanted to go. Price Action itself is a terrible rage, because the pump is immediately followed by a dump and so on. The resulting market structure is then kind of growing wedge, or perhaps a rising triangle. Hard to say under the circumstances.
However, I think that whatever the pattern, the market momentum has simply weakened markedly. However, ETH is still close to the S / R level of $ 3,516. It is close to this level Low Volume Node on the volume profile and on the one hand the so-called Golden Ratio on the Fibonacci sequence. It is therefore unequivocally around the level confluence.
It is therefore quite important for the market to break through this confluence, as this will practically open the door to test all time high. However, from the current price development, it is seriously complicated to try to estimate, at least roughly, what the market intends. There are simply times when it is better to remain patient.
Indicators
Both indicators are also a story in itself. The RSI and MACD have a striking negative correlation with price developments. There are exactly three bearish divergences on the first indicator. While on the MACD histogram, the values are even negative. The development of the curves also goes in the opposite direction than the course.
It is not very smart to ignore this indirect relationship between price and indicators. They tell us that the price momentum has no real basis at the moment.
In conclusion
ETH had a similar market structure in January this year, but in the end the market went awry and went up anyway. At that time, however, different market conditions prevailed, so there is no guarantee that the exchange rate will break through the $ 3,516. It really pays to be patient at some point, because now it’s like throwing coins.


