The Magnificent Seven: SHIB, REV, MATIC, AR, HT, YFI, AAVE — Biggest Gainers, May 7—14
3 min readTable of Contents
BeInCrypto looks at the seven altcoins that increased the most over the past seven days, from May 7 to May 14.
These altcoins are:
- SHIBA INU (SHIB) – 816%
- Revain (REV) – 99.5%
- Polygon (MATIC) – 72.2%
- Arweave (AR) – 67.0%
- Huobi Token (HT) – 48.2%
- yearn.finance (YFI) – 45.3%
- Aave (AAVE) – 24.9%
SHIB
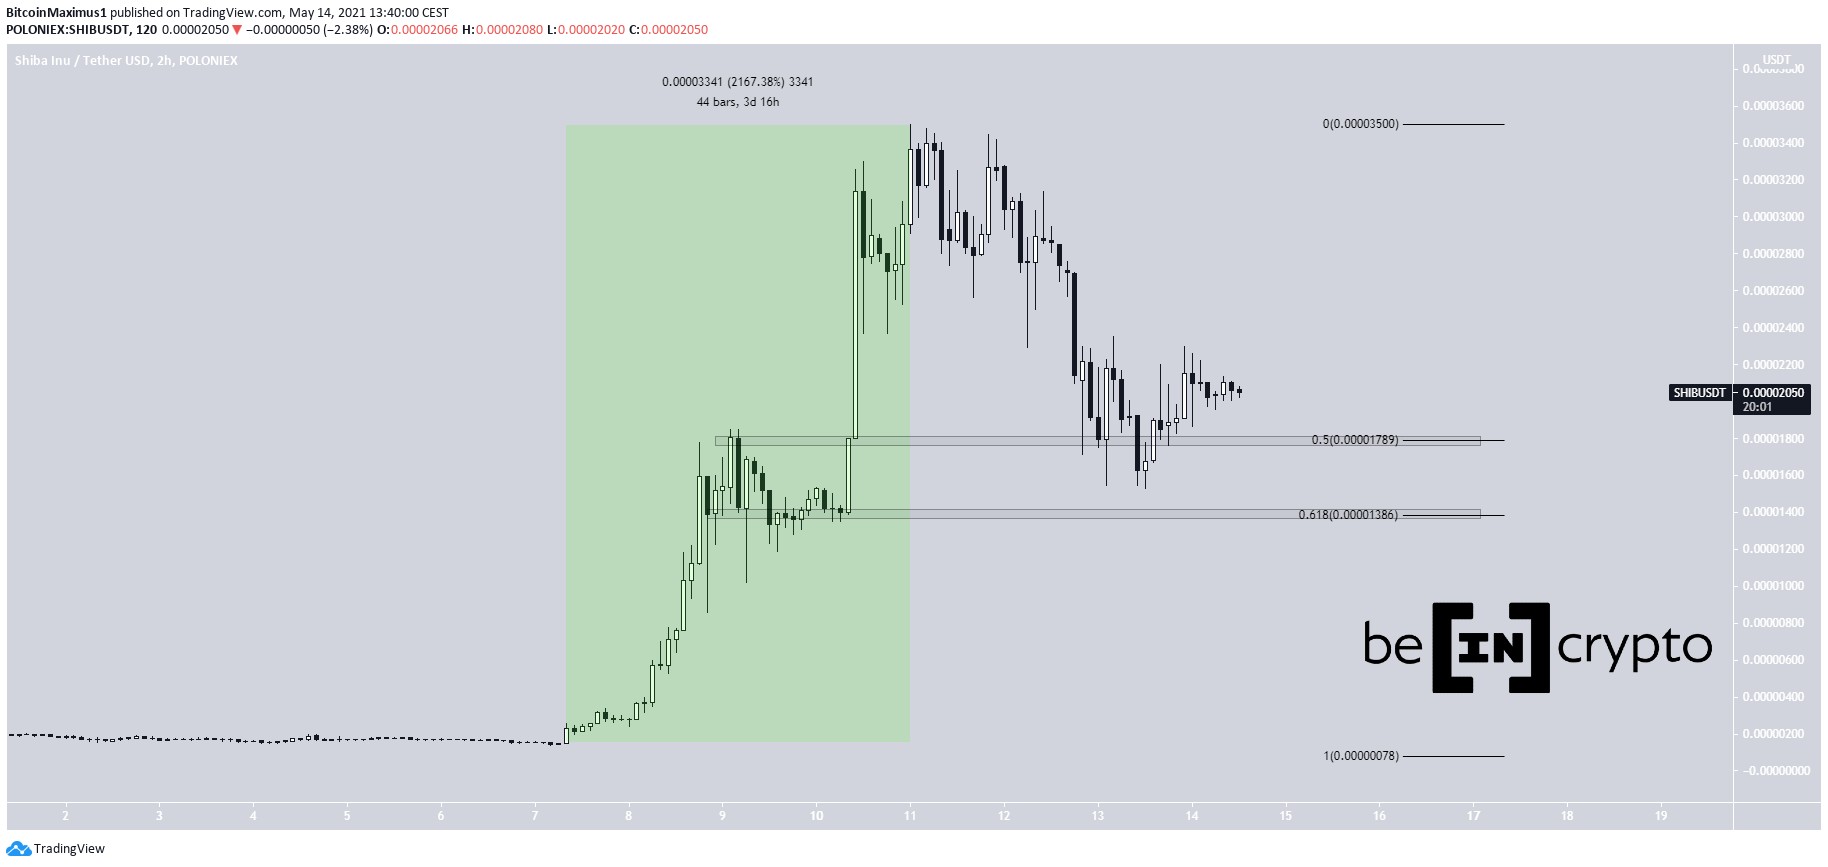
SHIB was the subject of a massive increase beginning on May 7. In less than four days, it moved upwards by a full 2,167%, leading to an all-time high price of $0.000035 being reached on May 11. However, it has been moving downwards since.
On May 13, SHIB reached the 0.5 Fib retracement support level at $0.000018 and bounced. Nevertheless, the bounce has been weak so far, indicating that the token could fall towards the next support level, found at $0.14.
REV
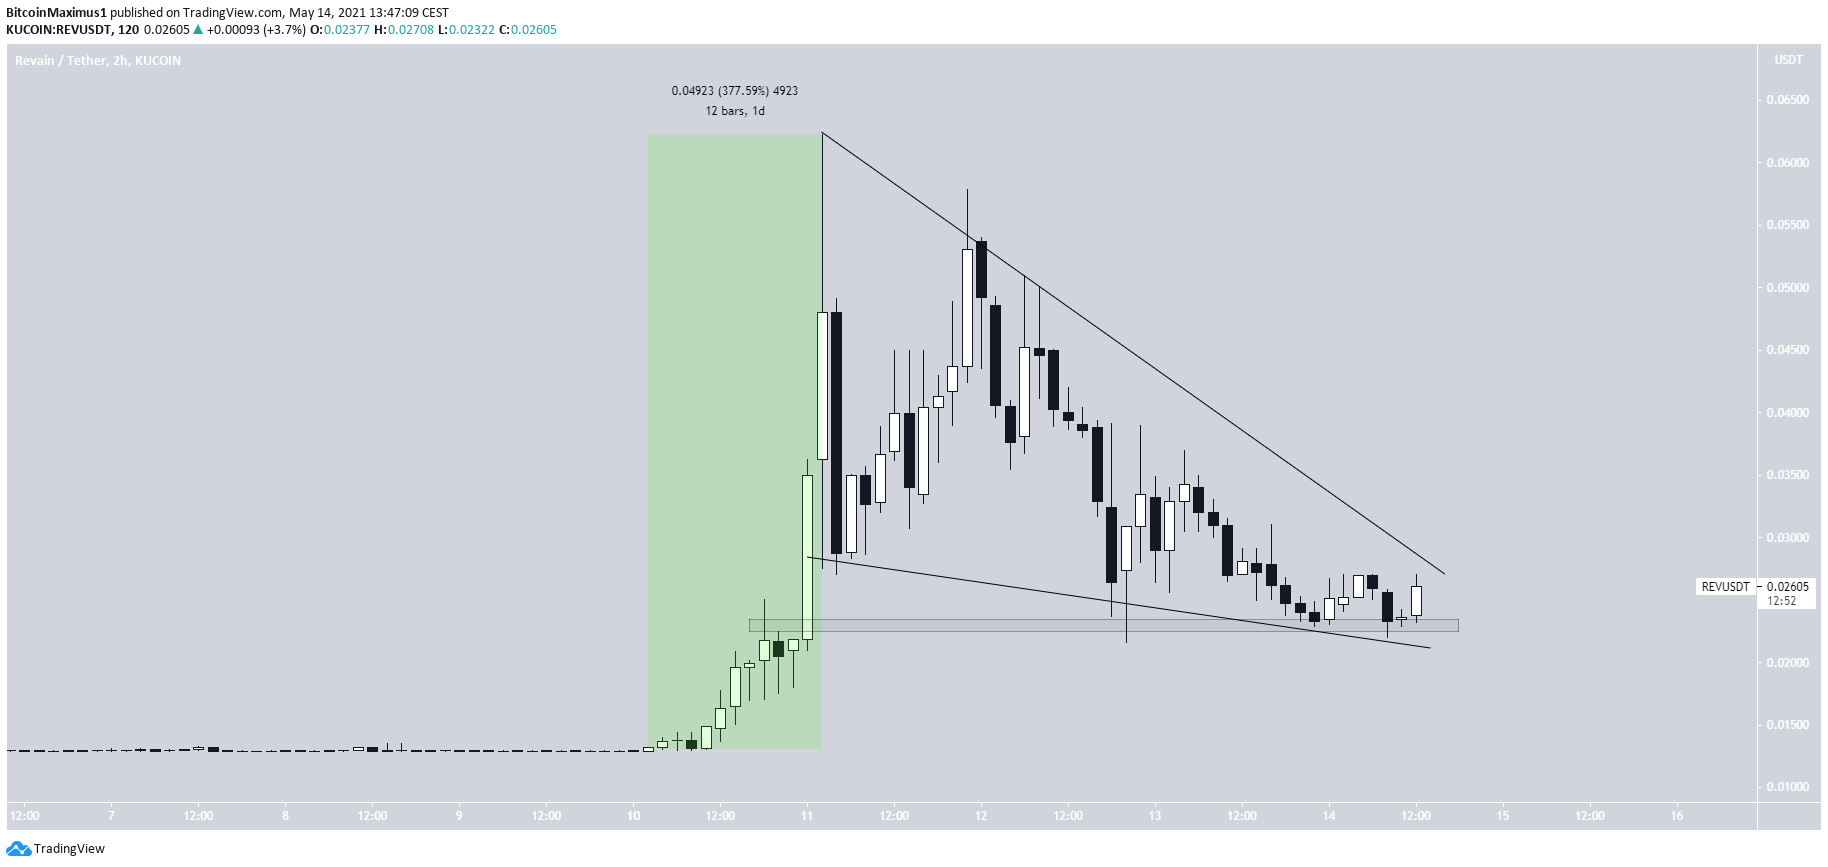
Similarly to SHIB, REV was subject to a significant increase beginning on May 10. In exactly one day, it increased by 377%, reaching a new all-time high price of $0.062.
Since then, it has been trading inside a massive descending wedge. This is considered a bullish pattern. In addition, it has reached the $0.023 support area.
If REV breaks out, the next closest resistance area would be found at $0.047.
MATIC
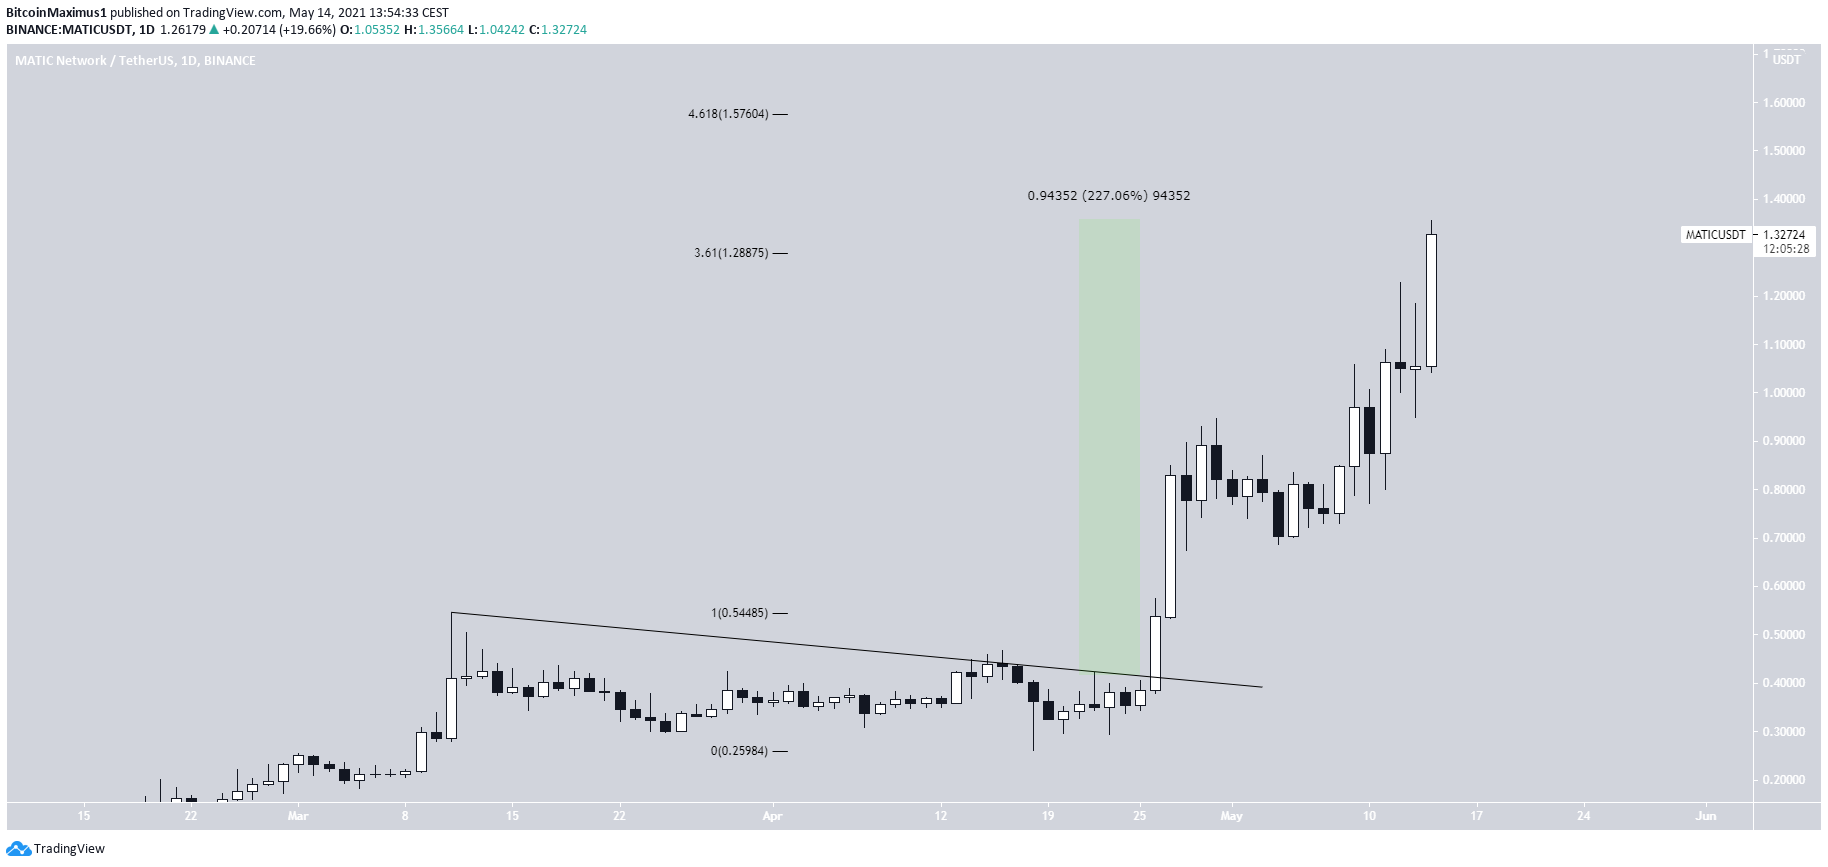
MATIC has been increasing since breaking out from a descending resistance line on April 26. Since then, it has moved upwards by 227%, leading to a new all-time high price of $1.356 being reached on May 14.
The token has just moved above the 3.61 external Fib retracement resistance, found at $0.129. The next significant resistance area is found at $1.57, the 4.61 external Fib retracement resistance.
AR
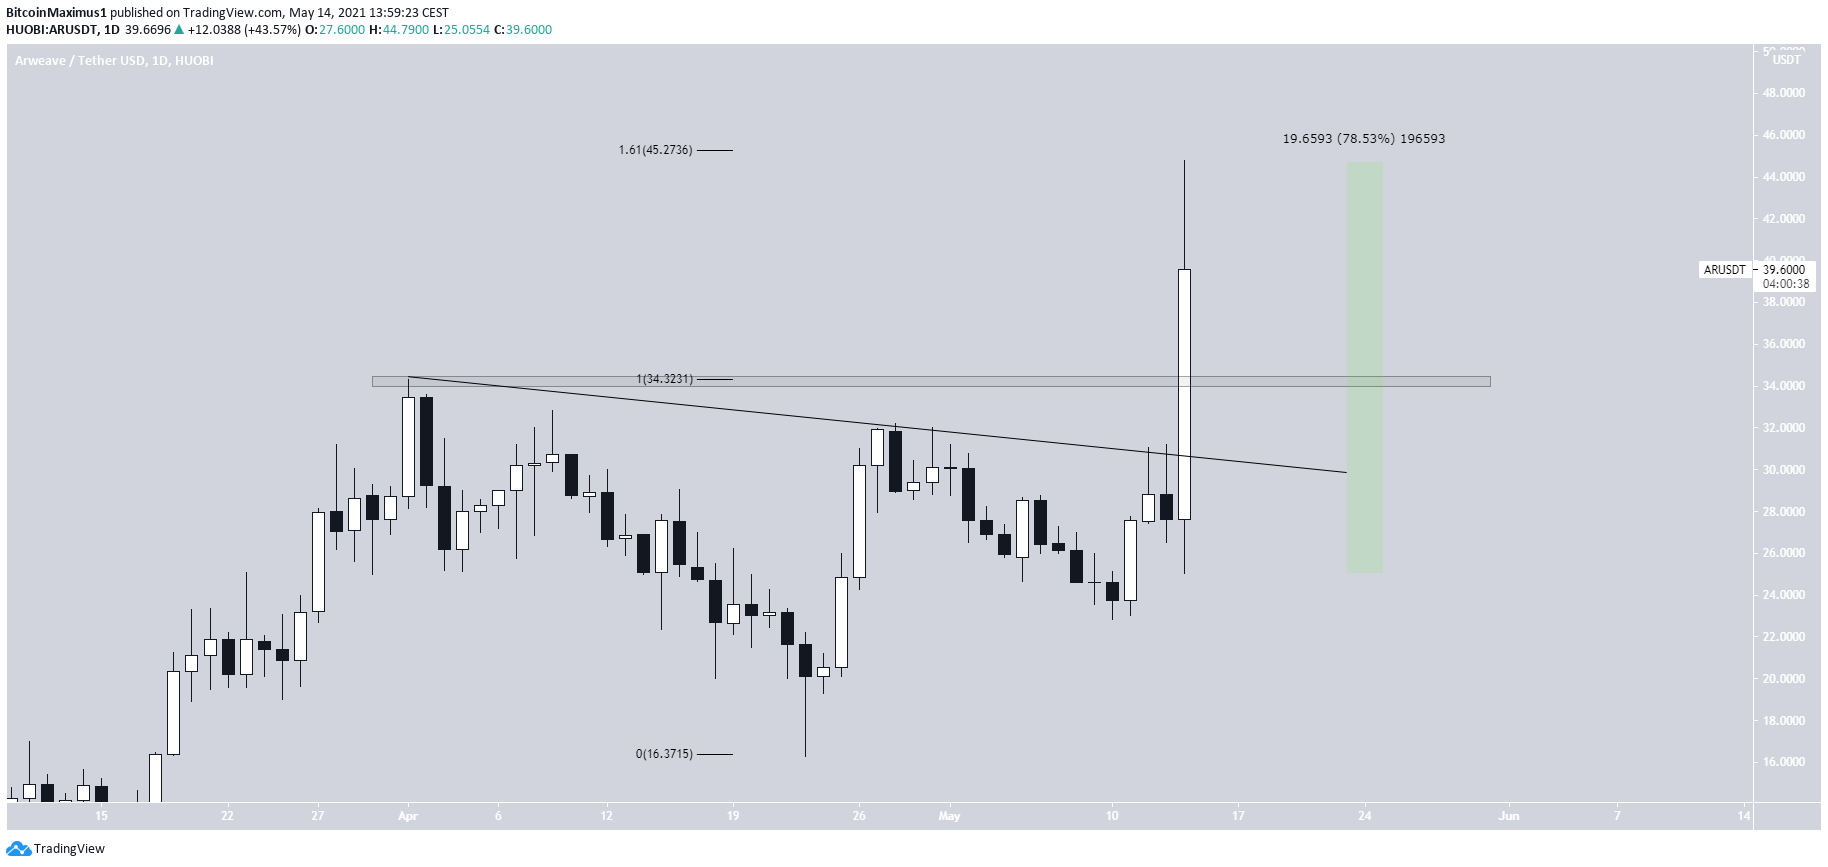
AR had been following a descending resistance line since reaching a then all-time high price of $34.33, on April 1.
After three unsuccessful attempts, it managed to break out from it on May 14. The same day, it proceeded to reach a new all-time high price of $44.79. The high was reached right at the 1.61 external Fib retracement of the previous drop.
At its highest point, the token had increased by 78.53% on the day.
However, it has decreased considerably since the high, currently being close to $38.
Nevertheless, the trend can be considered bullish as long as AR is trading above the $34.30 area, which is now likely to act as support.
HT
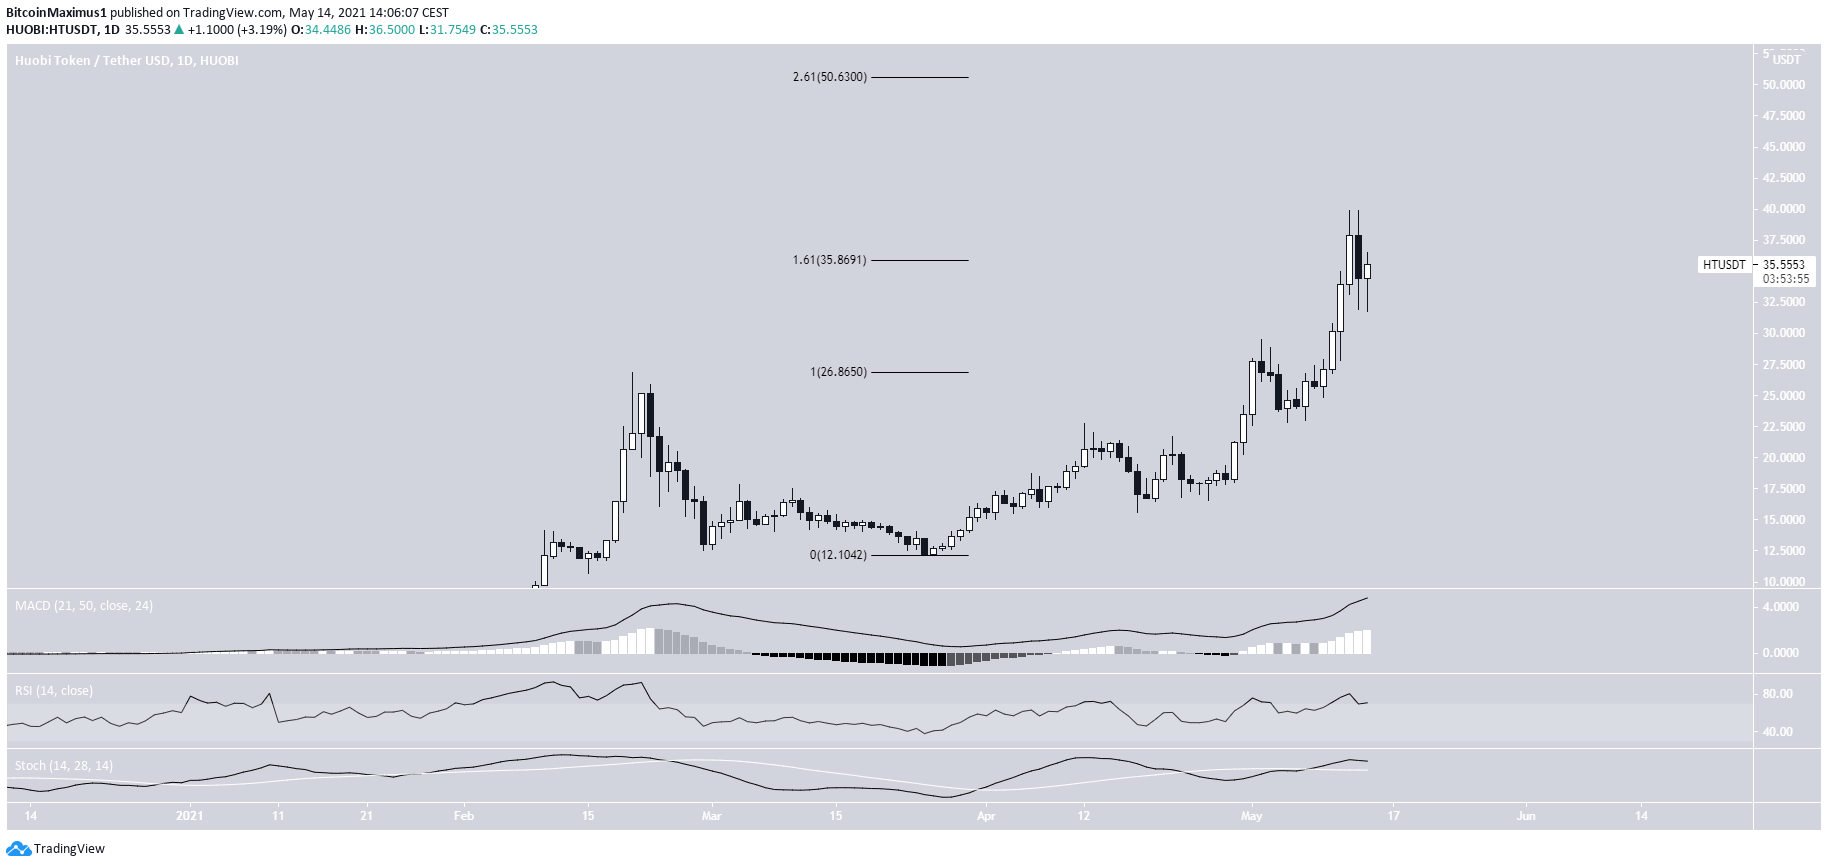
HT has been moving upwards since March 25. On May 2, it managed to break out above the previous resistance of $27. It proceeded to increase until May 12, when it reached a new all-time high of $34.99.
The high was made slightly above the 1.61 external fib retracement level of the most recent drop.
While HT has been rejected since, technical indicators do not show significant signs of weakness.
The next resistance area is found at $50.60, created by the 2.61 external Fib retracement of the same drop.
YFI
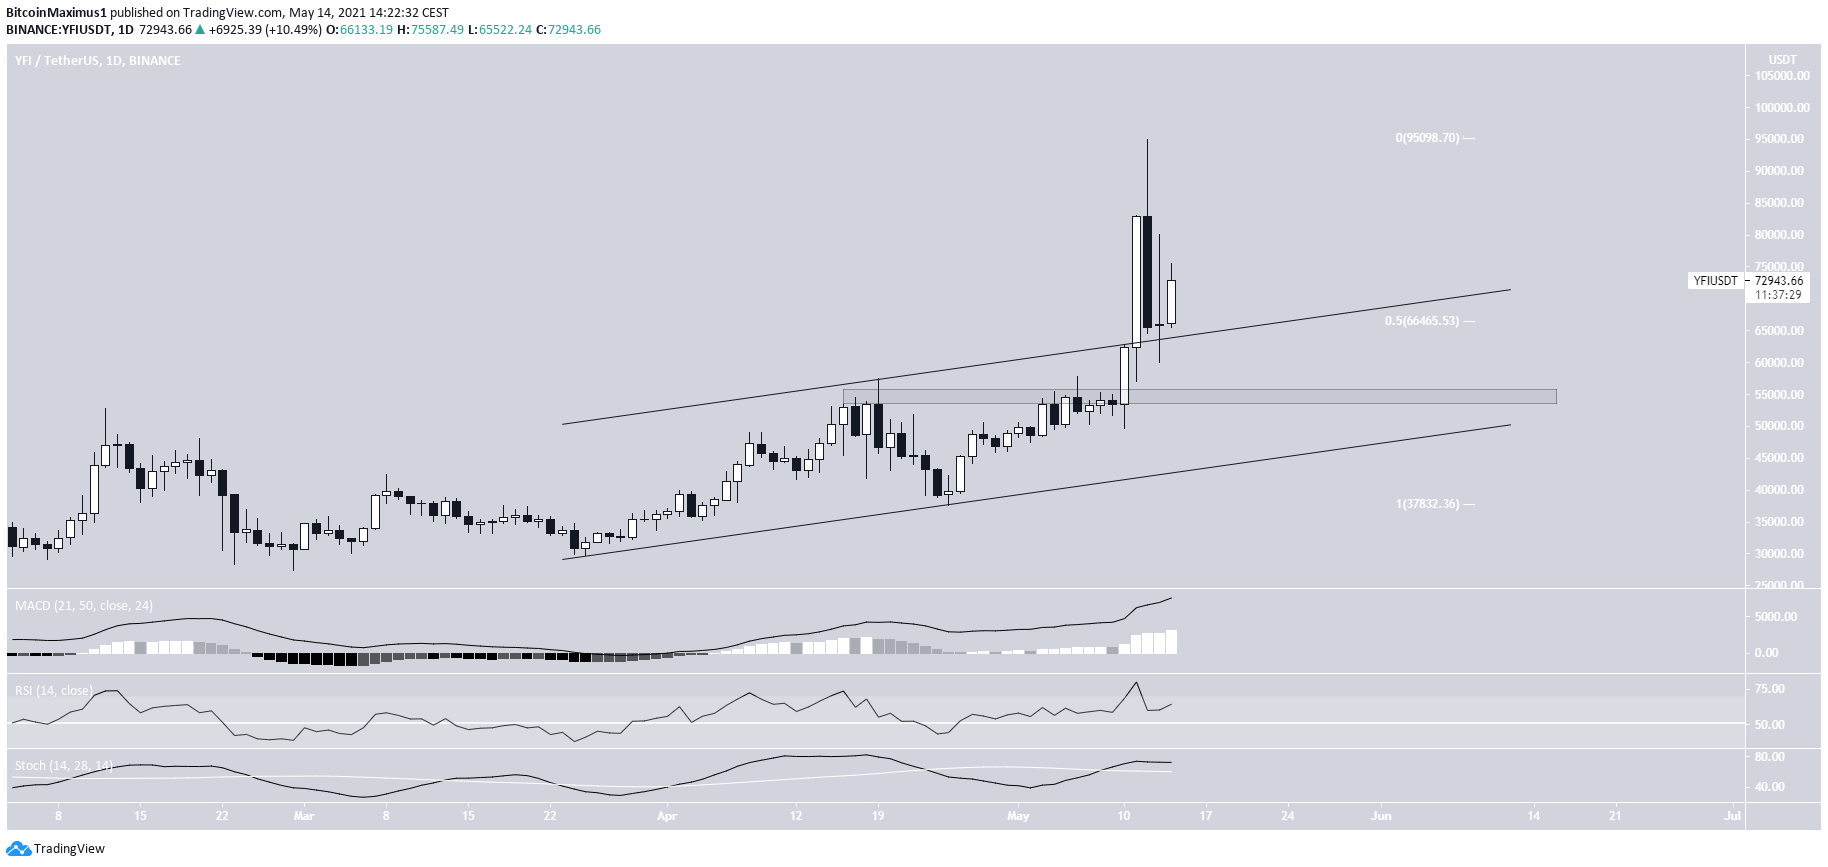
YFI has been moving upwards since breaking out from an ascending parallel channel on May 10. Two days later, it managed to reach a new all-time high price of $95,000.
While it was rejected afterwards, it has bounced at the 0.5 Fib retracement level. Furthermore, it is possible that the current decrease is a fourth wave pullback. If so, this would lead to a new all-time high price.
The possibility is also supported by the fact that technical indicators are bullish, as evident by the increasing MACD & Stochastic Oscillator.
If not, the next closest support area would be found at $55,000.
AAVE
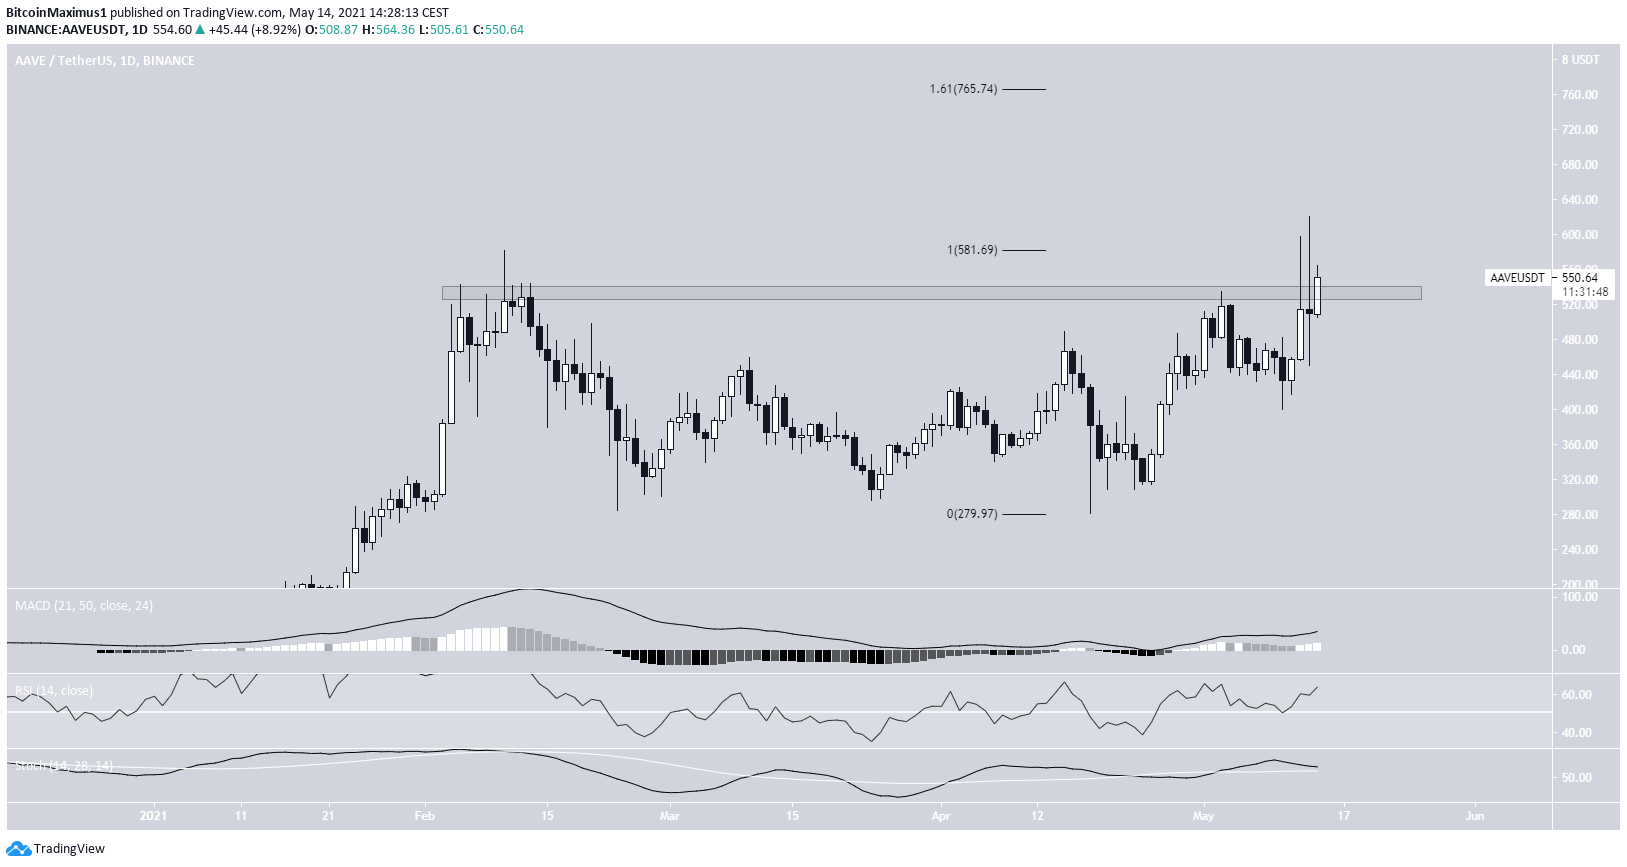
AAVE has been moving upwards since April 18. It proceeded to reach a new all-time high price of $621 on May 13, before decreasing slightly.
It is currently below the $520 resistance area. Its reclaim would indicate that the token is heading for a new all-time high price. If so, the next resistance area would be found at $765.
Technical indicators are bullish, supporting the continuation of the upward movement.
For BeInCrypto’s latest BTC (BTC) analysis, click here.
The post The Magnificent Seven: SHIB, REV, MATIC, AR, HT, YFI, AAVE — Biggest Gainers, May 7—14 appeared first on BeInCrypto.


