Table of Contents
August was an extremely bullish month for the cryptocurrency markets. BTC (BTC) increased by 17% while more than ten tokens posted triple digit rates of increase.
The ten altcoins that increased the most in August are:
- TrueFi (TRU) – 234.3%
- Solana (SOL) – 221.4%
- Keep3rV1 (KP3R) – 194.1%
- CertiK (CTK) – 155.6%
- Coti Network (COTI) – 148.4%
- Audius (AUDIO) – 127.4%
- Near Protocol (NEAR) – 123.9%
- Trust Wallet Token (TWT) – 120.0%
- Loopring (LRC) – 119.2%
- Serum (SRM) – 115.3%
TRU
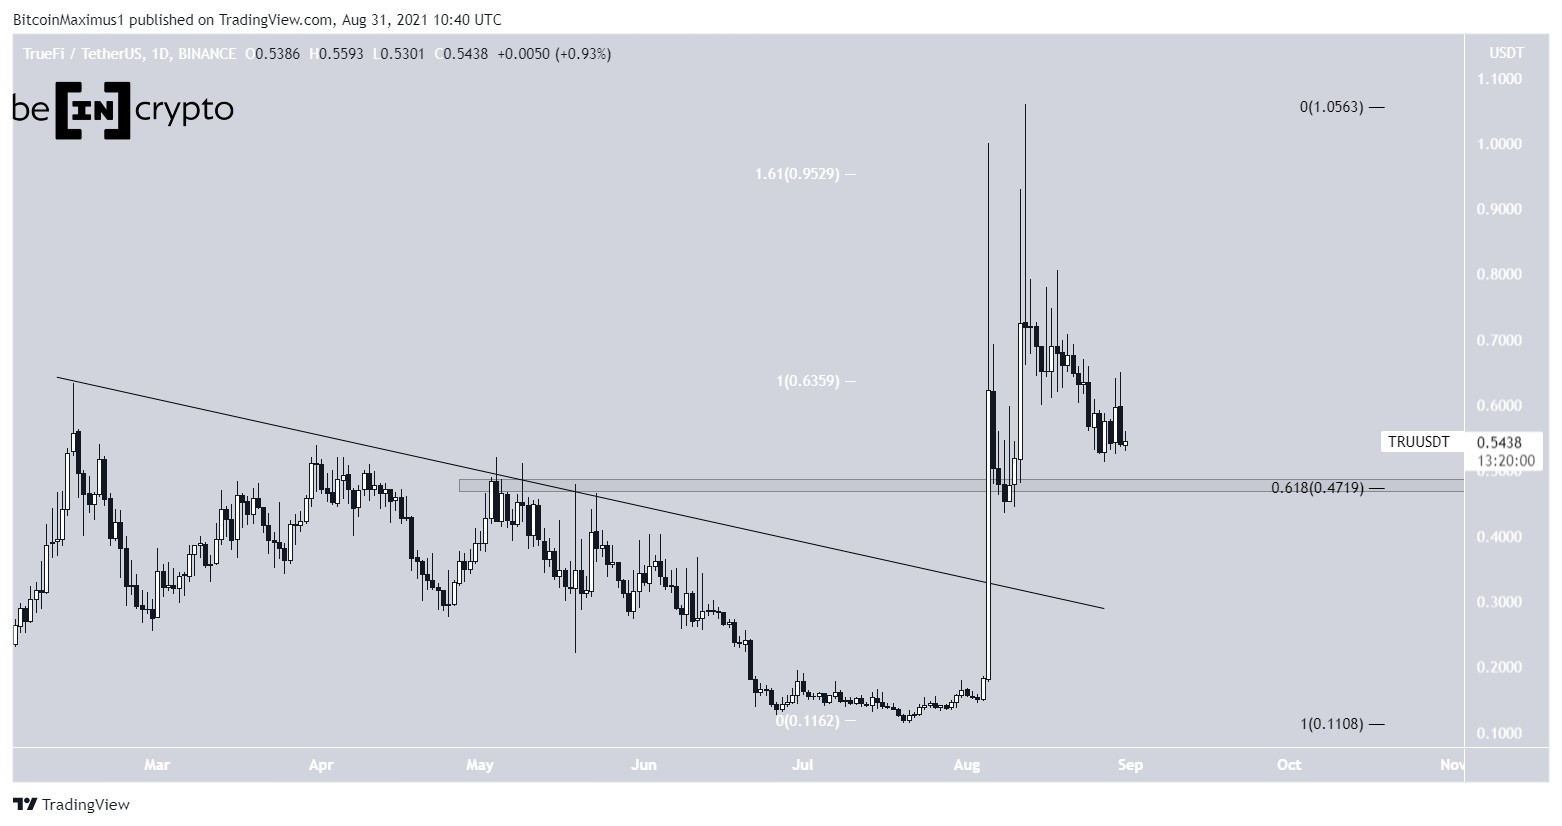
On Aug. 5, TRU broke out amidst a massive bullish engulfing candlestick and proceeded to reach a new all-time high price of $1.
After a sharp drop, it initiated another upward movement which led to a new all-time high price of $1.06 on Aug. 12. Both highs were made very close to the 1.61 external Fib retracement resistance level of $0.952.
The token has been moving downward since. However, it is still trading above the $0.47 horizontal support level, which is also the 0.618 Fib retracement support level when measuring the entire upward movement.
As long as it is doing so, the trend can be considered bullish.
SOL
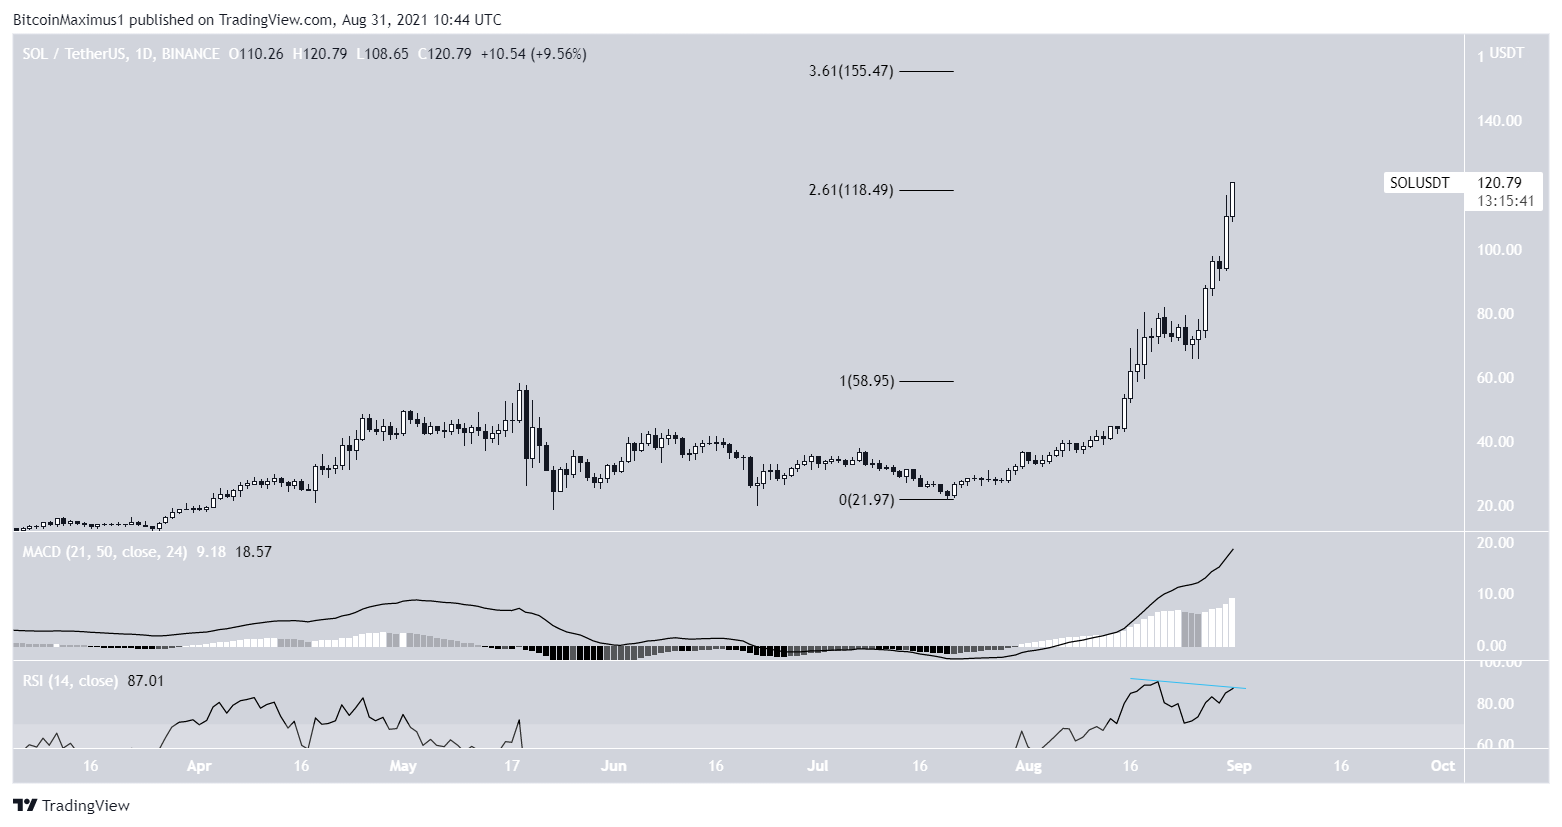
SOL has been increasing at a rapid pace since July 21. On Aug. 21, it reached a then all-time high price of $82. After a slight drop, it resumed its upward movement and reached a new all-time high of $120.5 on Aug. 31.
Currently, the token is trading right at the 2.61 external Fib retracement resistance level when measuring the most recent portion of the drop. This area could act as resistance.
If SOL manages to break out, the next resistance would be at $155.
There is a potential bearish divergence developing in the oversold RSI. However, the MACD is still bullish.
KP3R
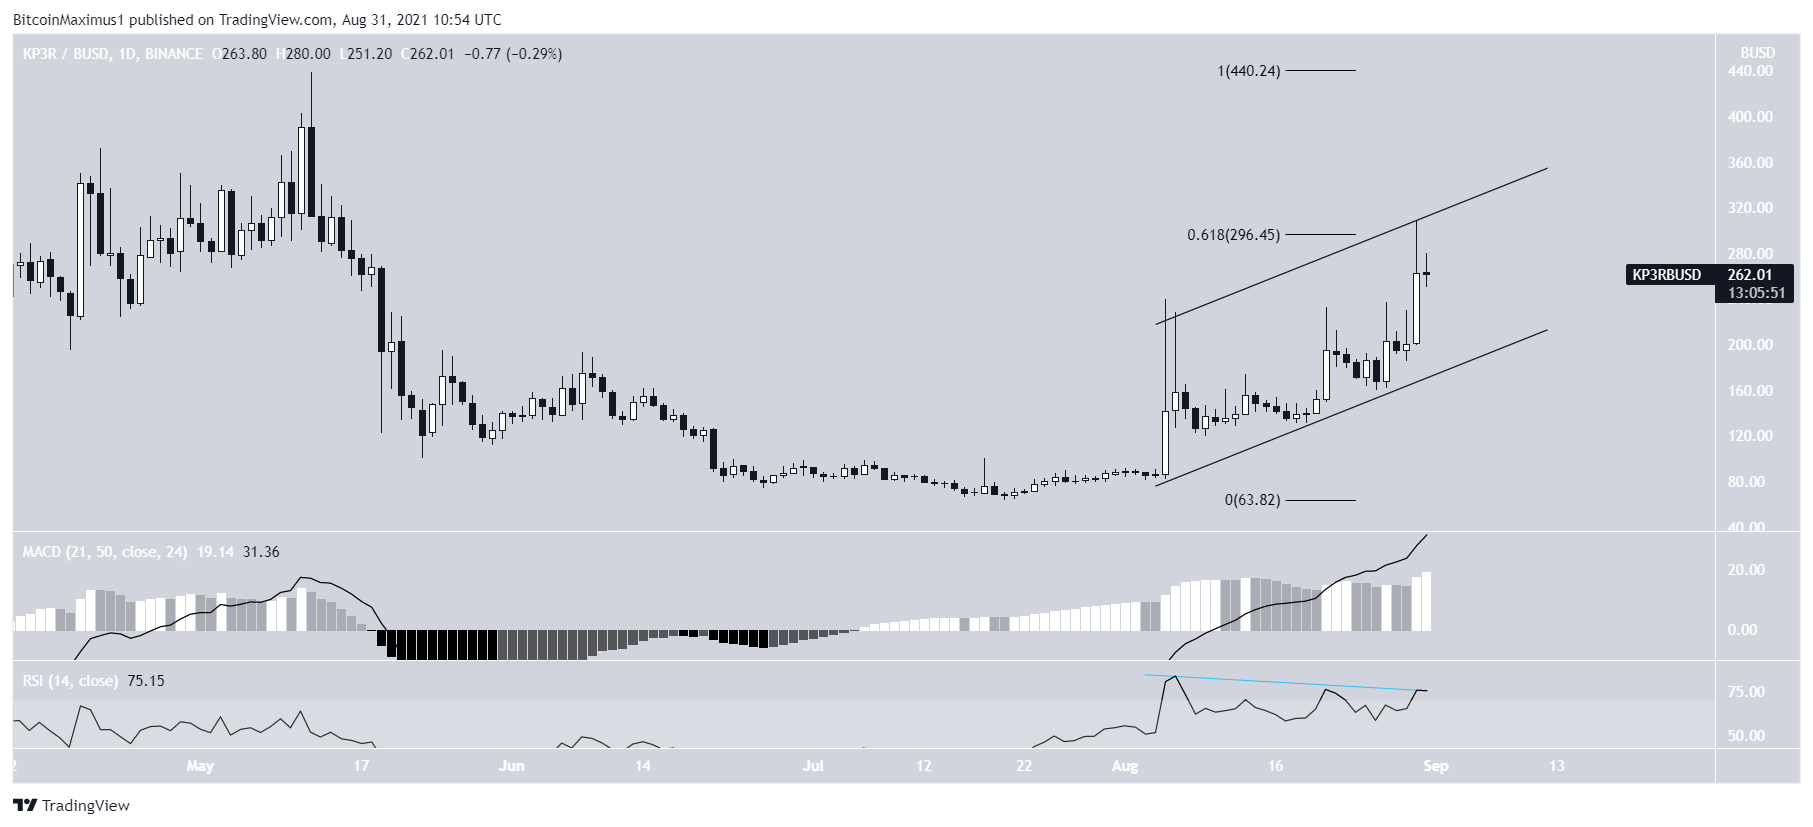
KP3R has been increasing alongside an ascending parallel channel since Aug. 5. Such channels usually contain corrective structures.
So far, it has managed to reach a high of $309, doing so on Aug. 30. However, it was rejected by the 0.618 Fib retracement resistance level at $297 and has been moving downwards since.
The rejection also coincides with the resistance line of the channel. In addition to this, the RSI has generated bearish divergence.
This supports the possibility that the movement is corrective and KP3R will not break out from the channel in the short-term.
CTK
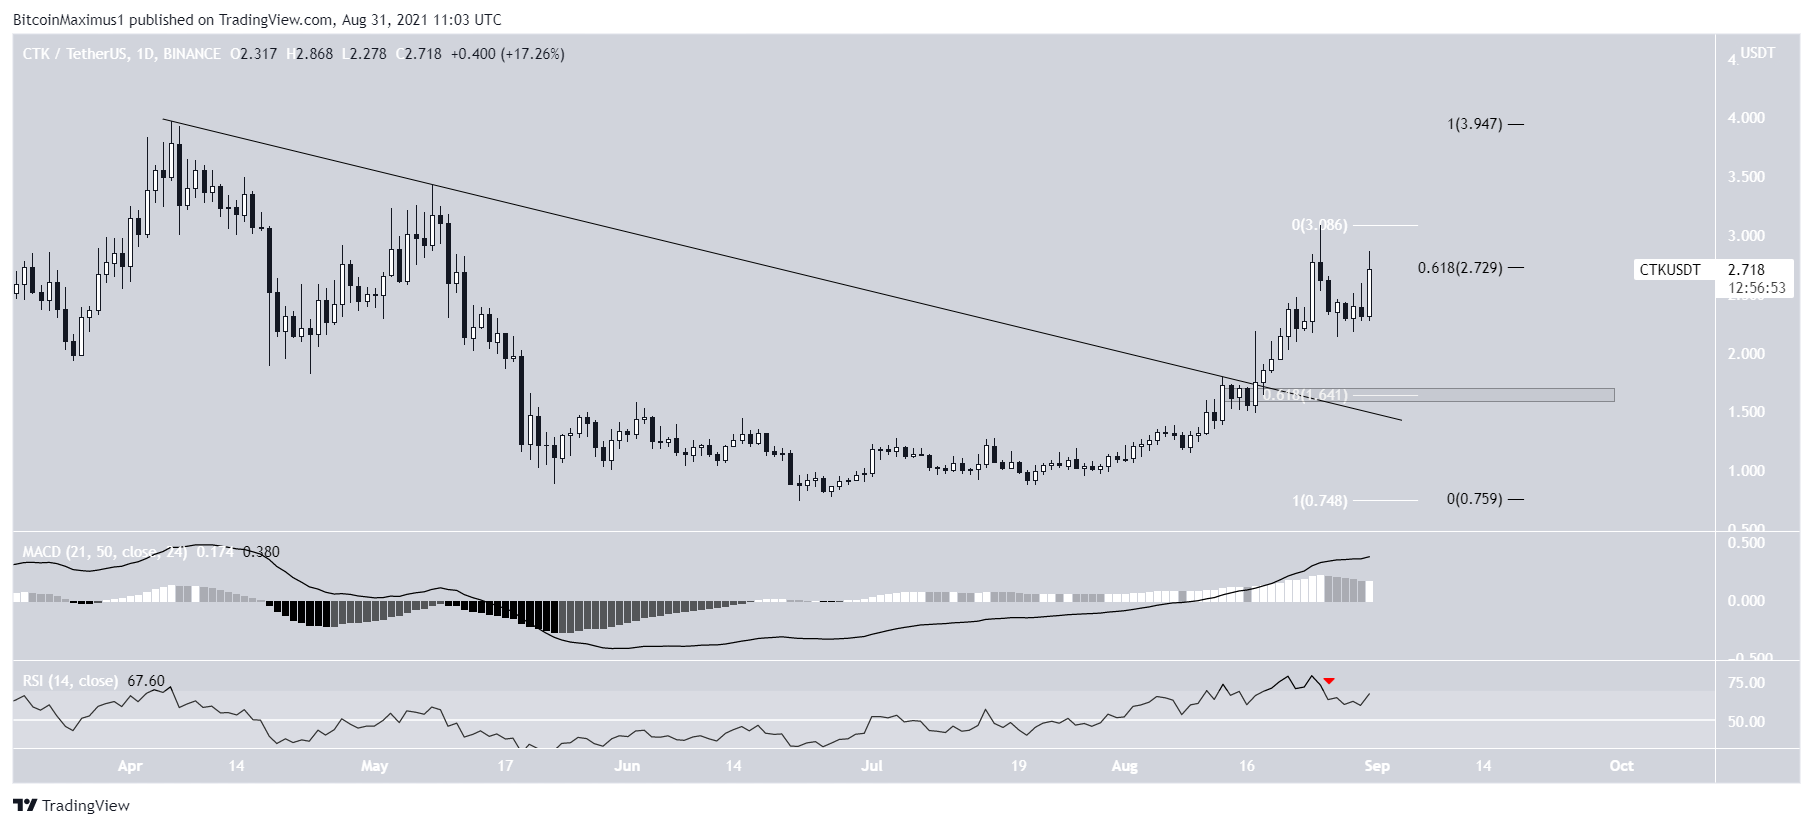
On Aug. 18, CTK broke out from a descending resistance line. It continued increasing until it reached a high of $3.085 on Aug. 25.
While the high was made above the 0.618 Fib retracement resistance level of $2.72, the token has fallen below it since.
Both the MACD and RSI are showing signs of weakness. The former has created four consecutive lower momentum bars, while the latter has fallen below 70.
The closest support area is at $1.64. This is both a horizontal support area and the 0.618 Fib retracement support level (white).
COTI
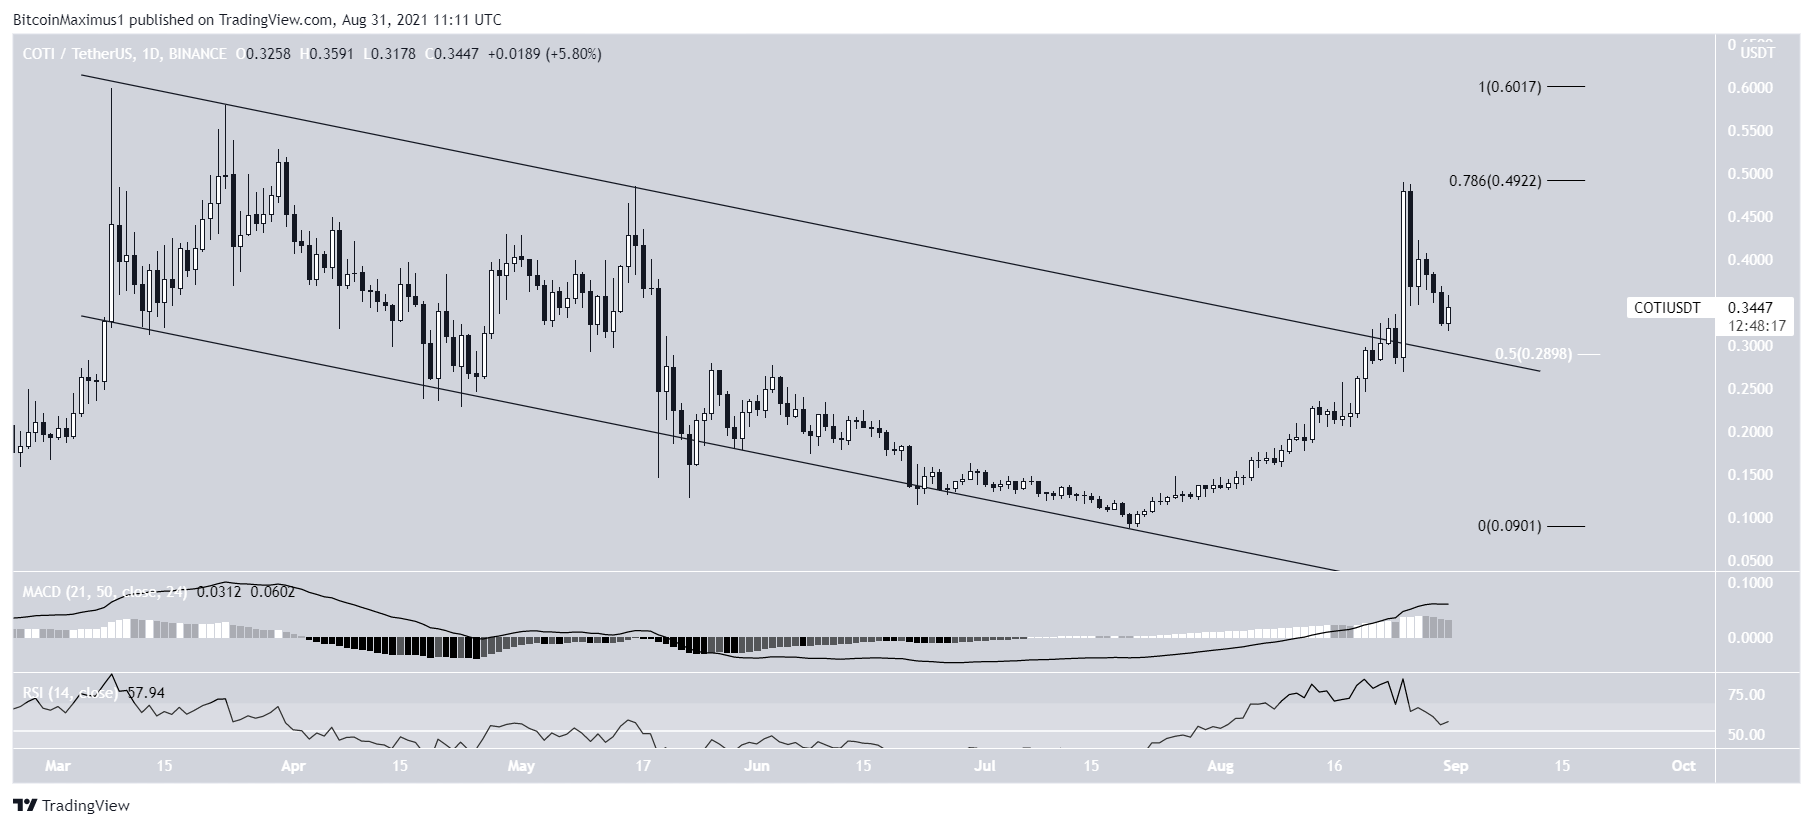
COTI had been trading inside a descending parallel channel since March 8. On Aug. 25, it broke out amidst a massive bullish engulfing candlestick and proceeded to reach a high of $0.49.
However, it was rejected by the 0.786 Fib retracement resistance level and fell sharply the next day.
In addition to this, both the MACD and RSI are showing bearish signs. The former has generated three lower momentum bars while the latter has fallen below 70.
The token is currently attempting to find support above the 0.5 Fib retracement support level and the resistance line from the parallel channel.
AUDIO
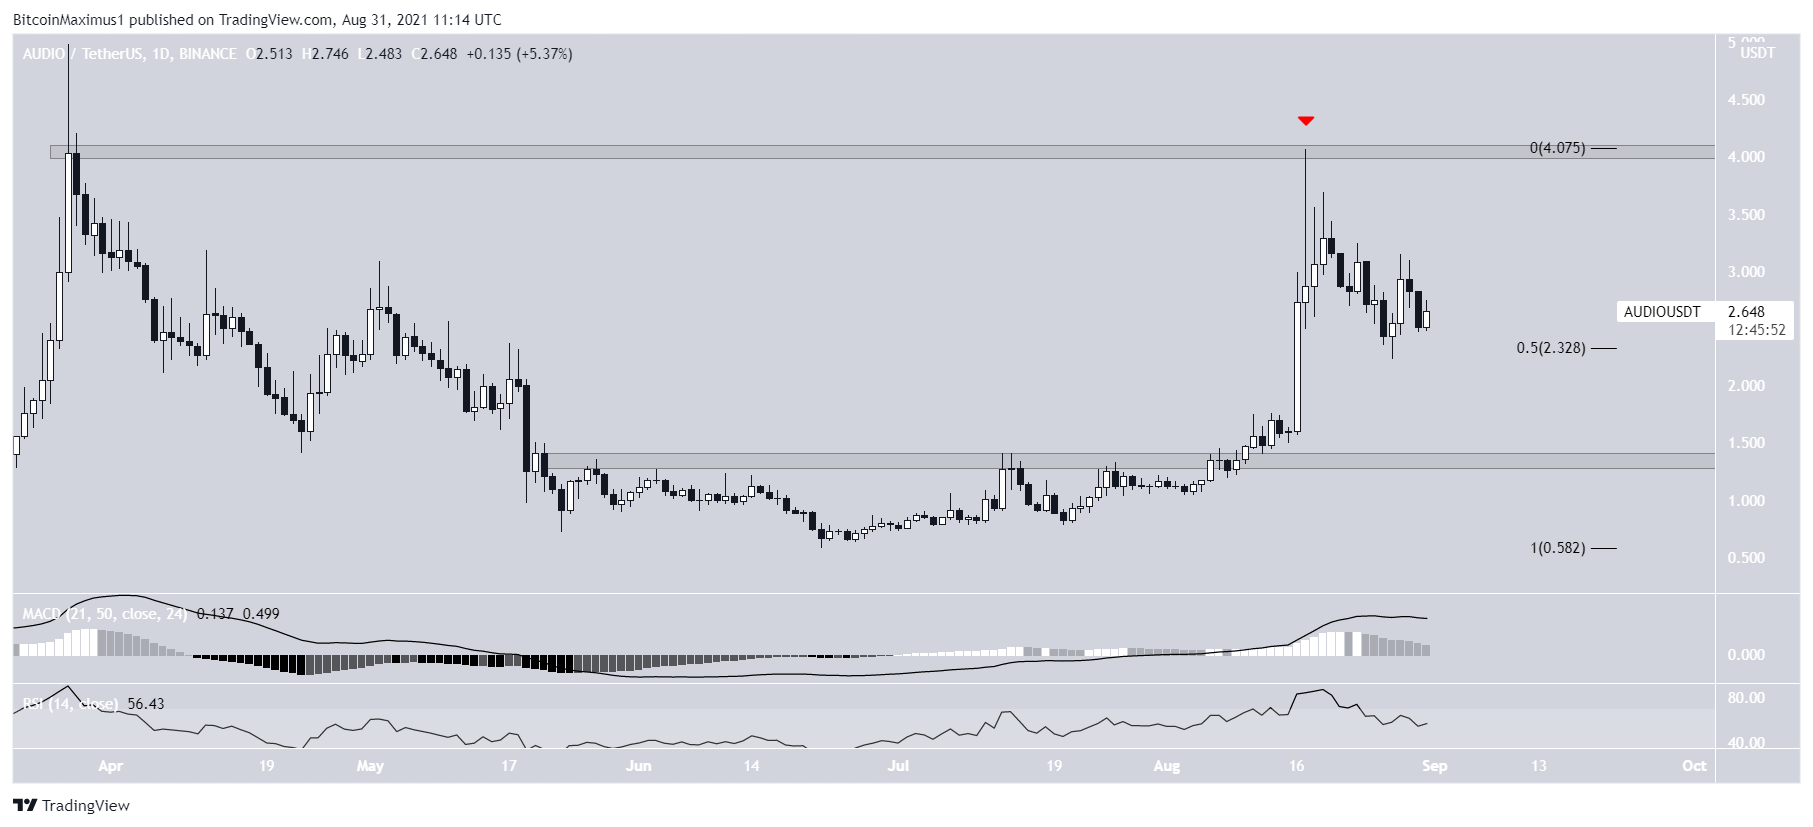
AUDIO has been moving downward since Aug. 7, when it reached a high of $4.07. It created a long upper wick (red icon) the same day, validating the $4.05 horizontal area as resistance.
The token has been moving downwards since, a decrease that has been combined with a fall in both the MACD and RSI.
Currently, AUDIO is trading just above the 0.5 Fib retracement support level at $2.32. The closest horizontal support area is at $1.40.
NEAR
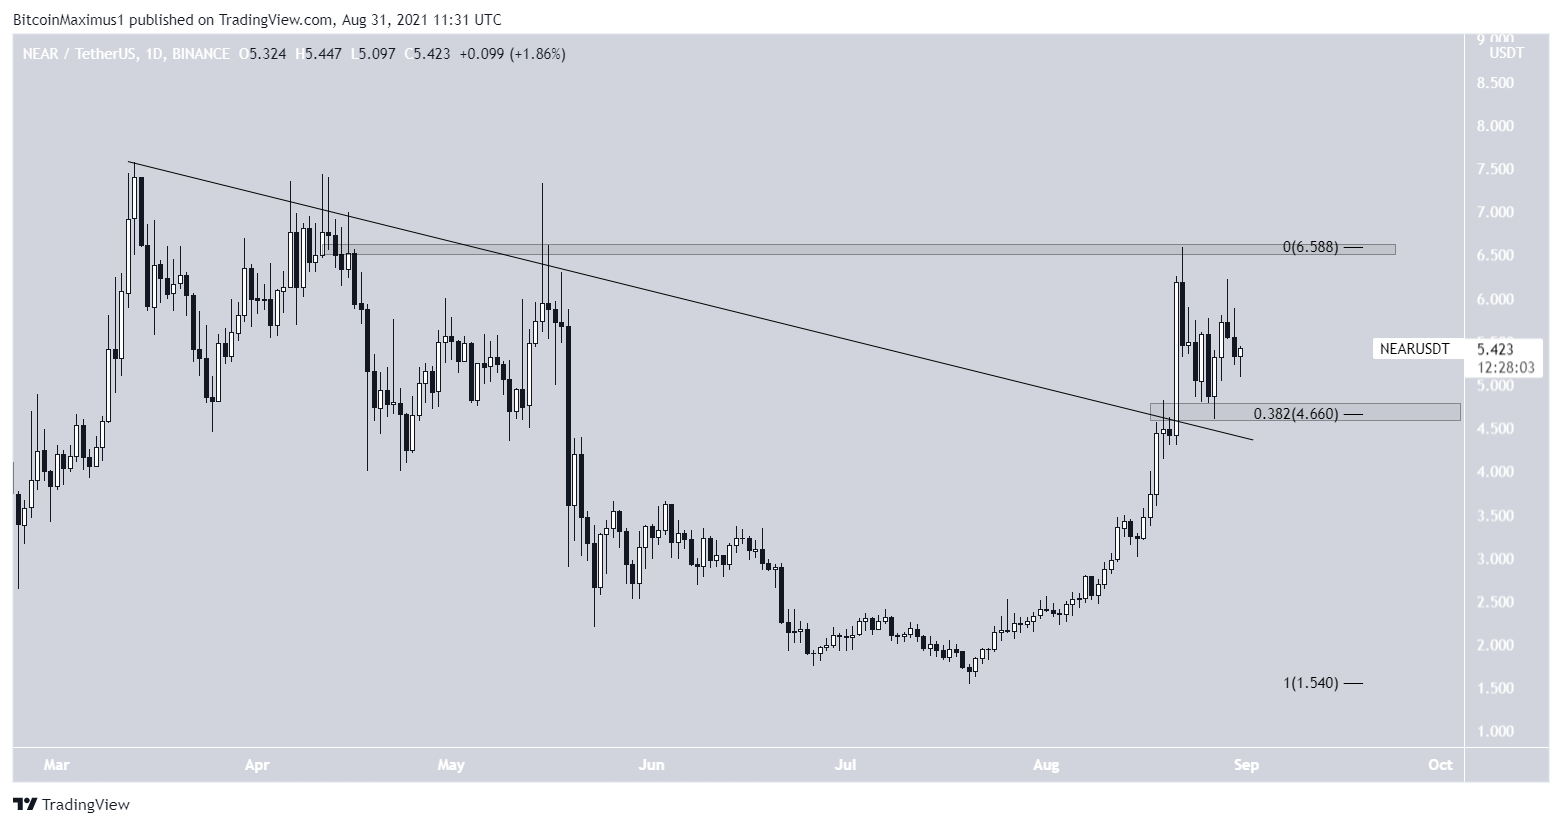
NEAR broke out from a descending resistance line on Aug. 21. It proceeded to reach a high of $6.59 the next day.
However, it was rejected by the $6.60 resistance area and has been moving downwards since.
On Aug. 27, it bounced at the $4.66 horizontal support area, which is the 0.382 Fib retracement support level and coincides with the resistance line from which NEAR broke out.
As long as it is trading above it, the trend can be considered bullish.
TWT
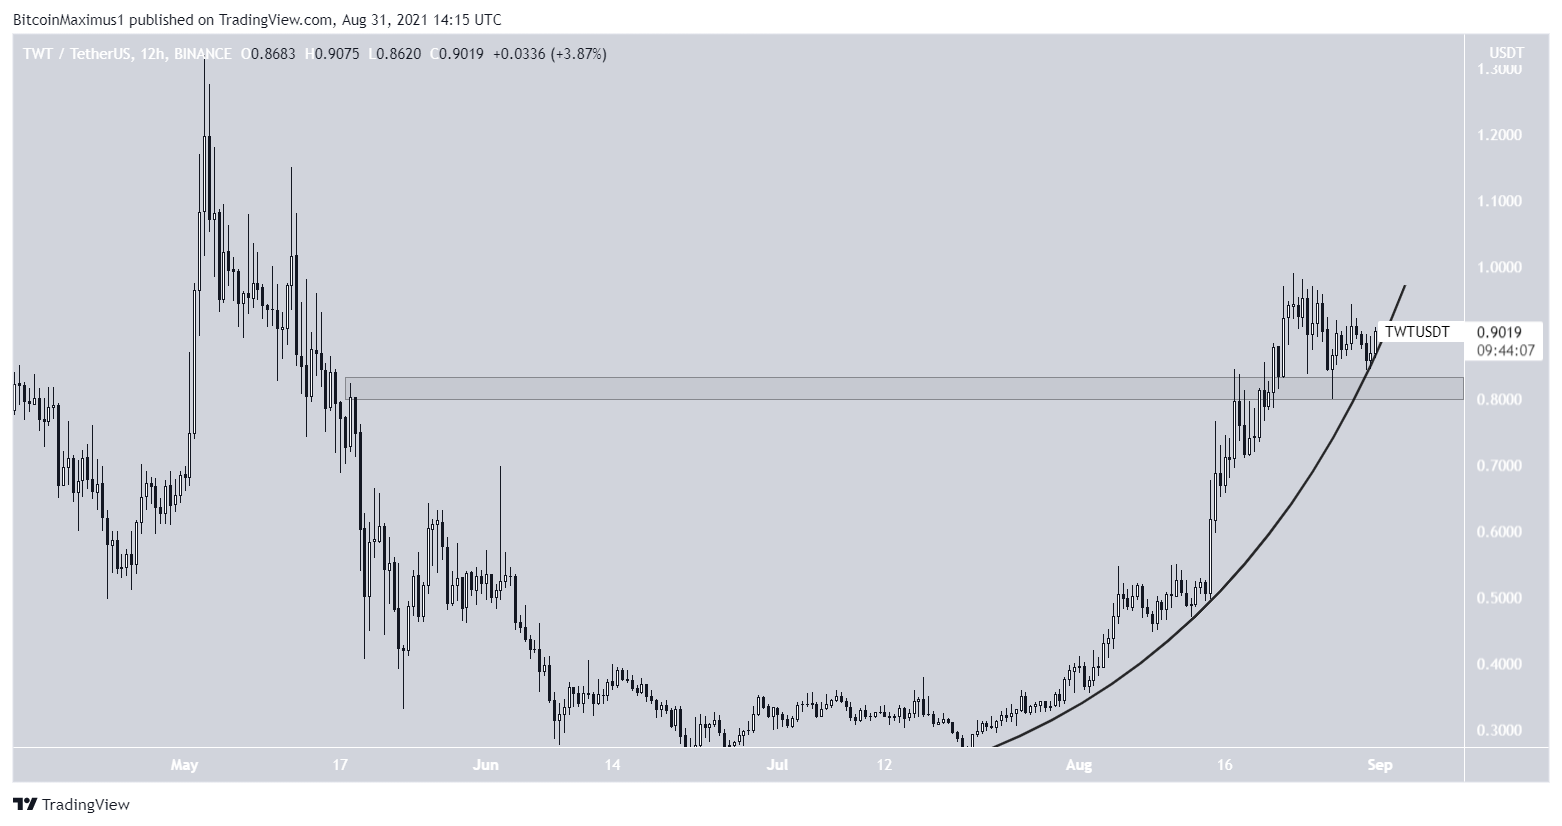
TWT has been increasing rapidly alongside a parabolic support line since July 20. So far, it has reached a high of $0.99, doing so on Aug. 23.
Currently, it is in the process of validating both the parabolic support line and the $0.80 horizontal area. Successfully doing so would likely trigger an upward movement towards a new all-time high price.
LRC
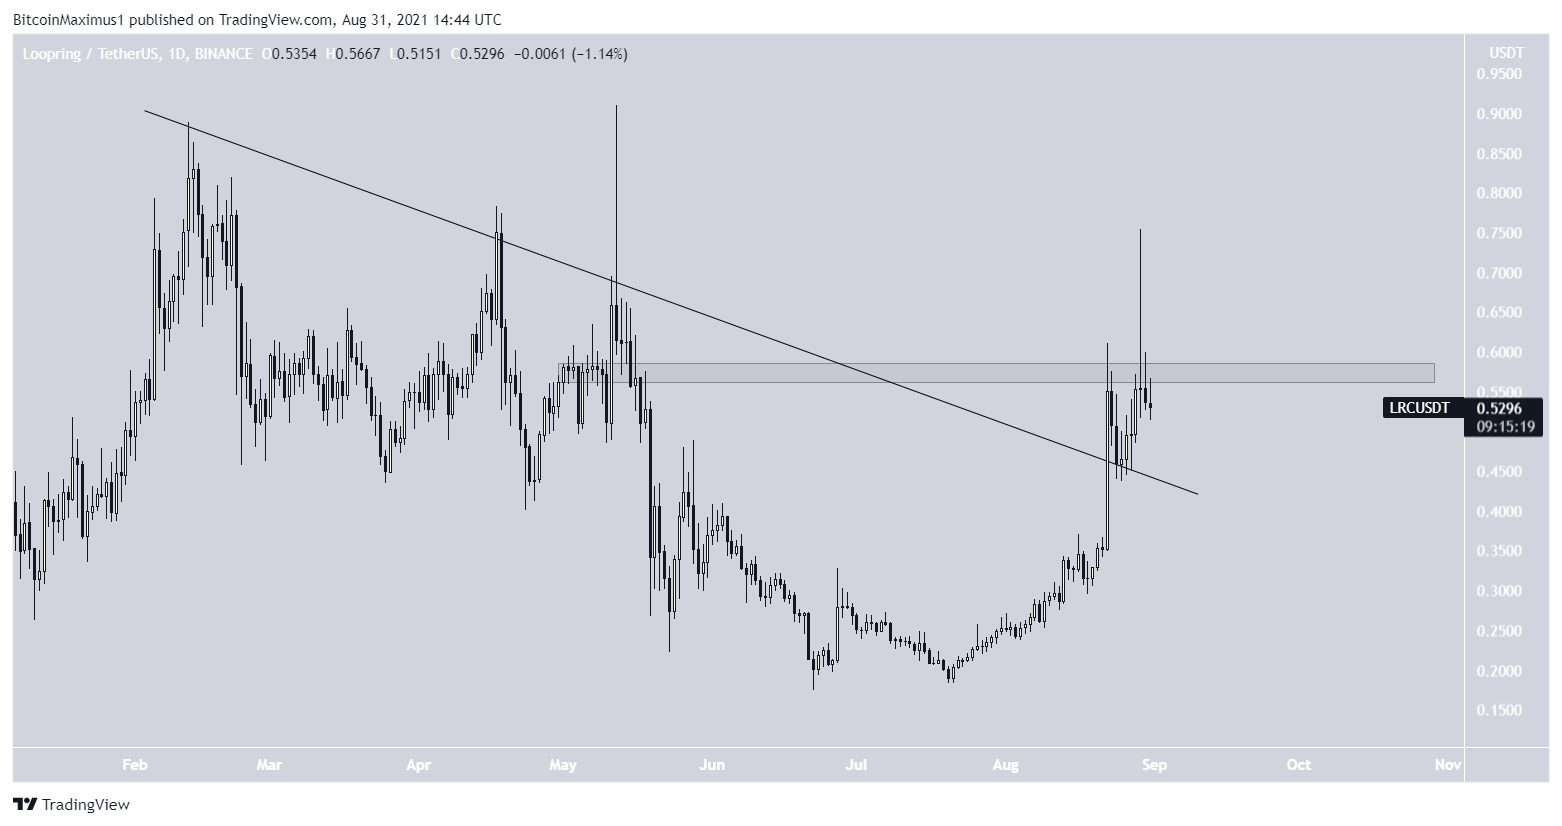
On Aug. 22, LRC broke out from a long-term descending resistance line and proceeded to reach a high of $0.61. It initiated another upward movement on Aug. 29, which led to a high of $0.75.
However, the breakout could not be sustained and created a long upper wick. LRC is now trading below the $0.58 horizontal resistance area.
In order for the trend to be considered bullish, LRC has to break out above this area.
SRM
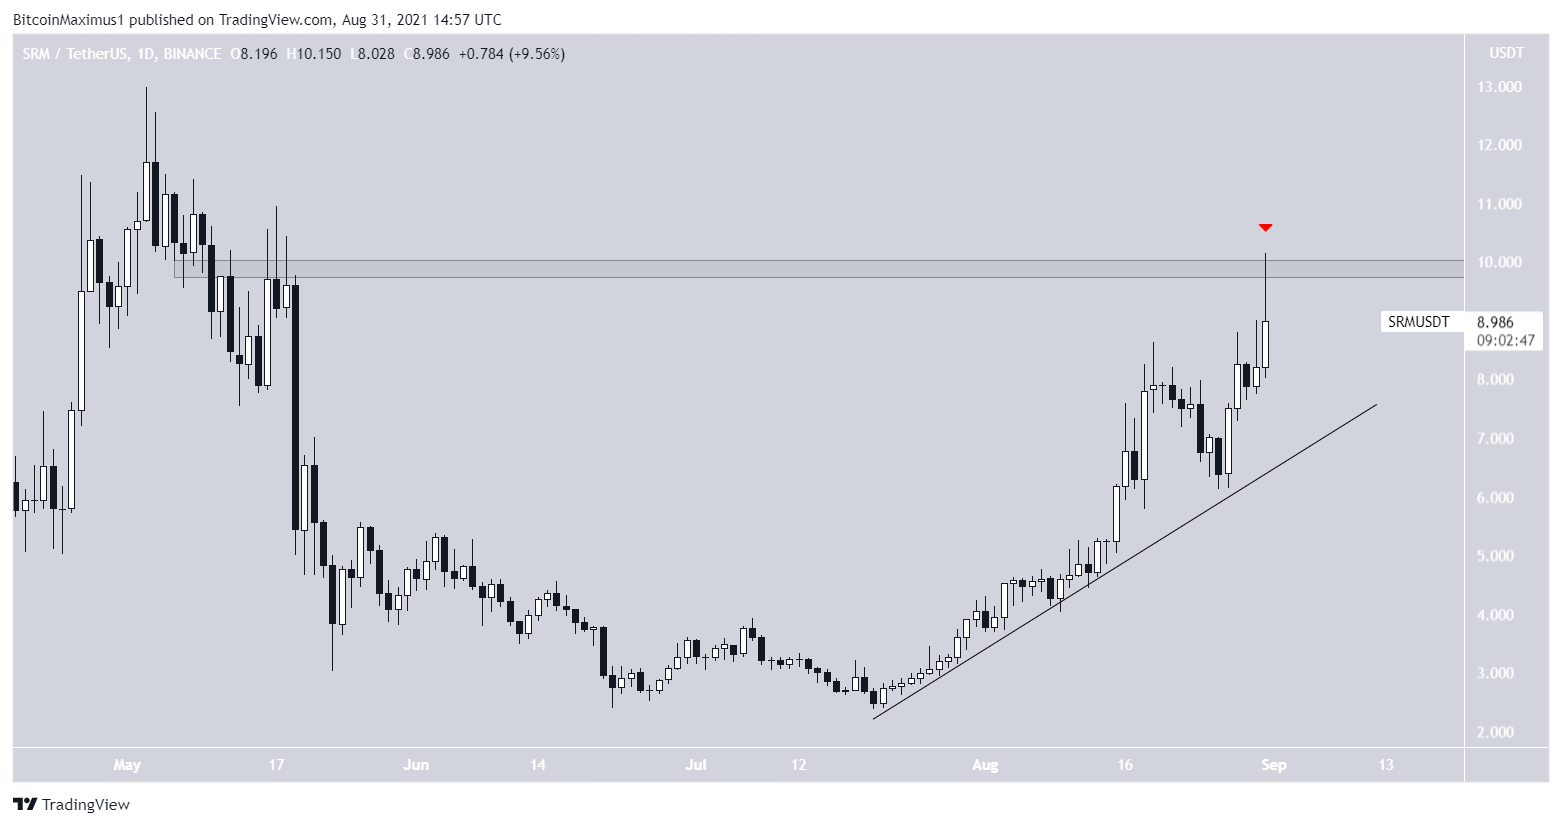
SRM has been increasing alongside an ascending support line since July 21. It initially reached a high of $8.62 on Aug. 19. After a drop that validated the support line once more, SRM reached a high of $10.15 on Aug. 31.
However, it failed to break out above the $10 resistance area and created a long upper wick.
In order for the trend to be considered bullish, SRM has to break out above this area.
For BeInCrypto’s latest BTC (BTC) analysis, click here.
The post Top 10 Altcoin Performer Showcase for August 2021 appeared first on BeInCrypto.


