While both the Cryptocurrency Total Market Cap (TOTALCAP) and the Altcoin Market Cap (ALTCAP) have been increasing since the beginning of September, TOTALCAP has done so at a much higher rate.
This makes the outlook for the future of the TOTALCAP much more bullish than its ALTCAP counterpart.
Total Cryptocurrency Market Cap
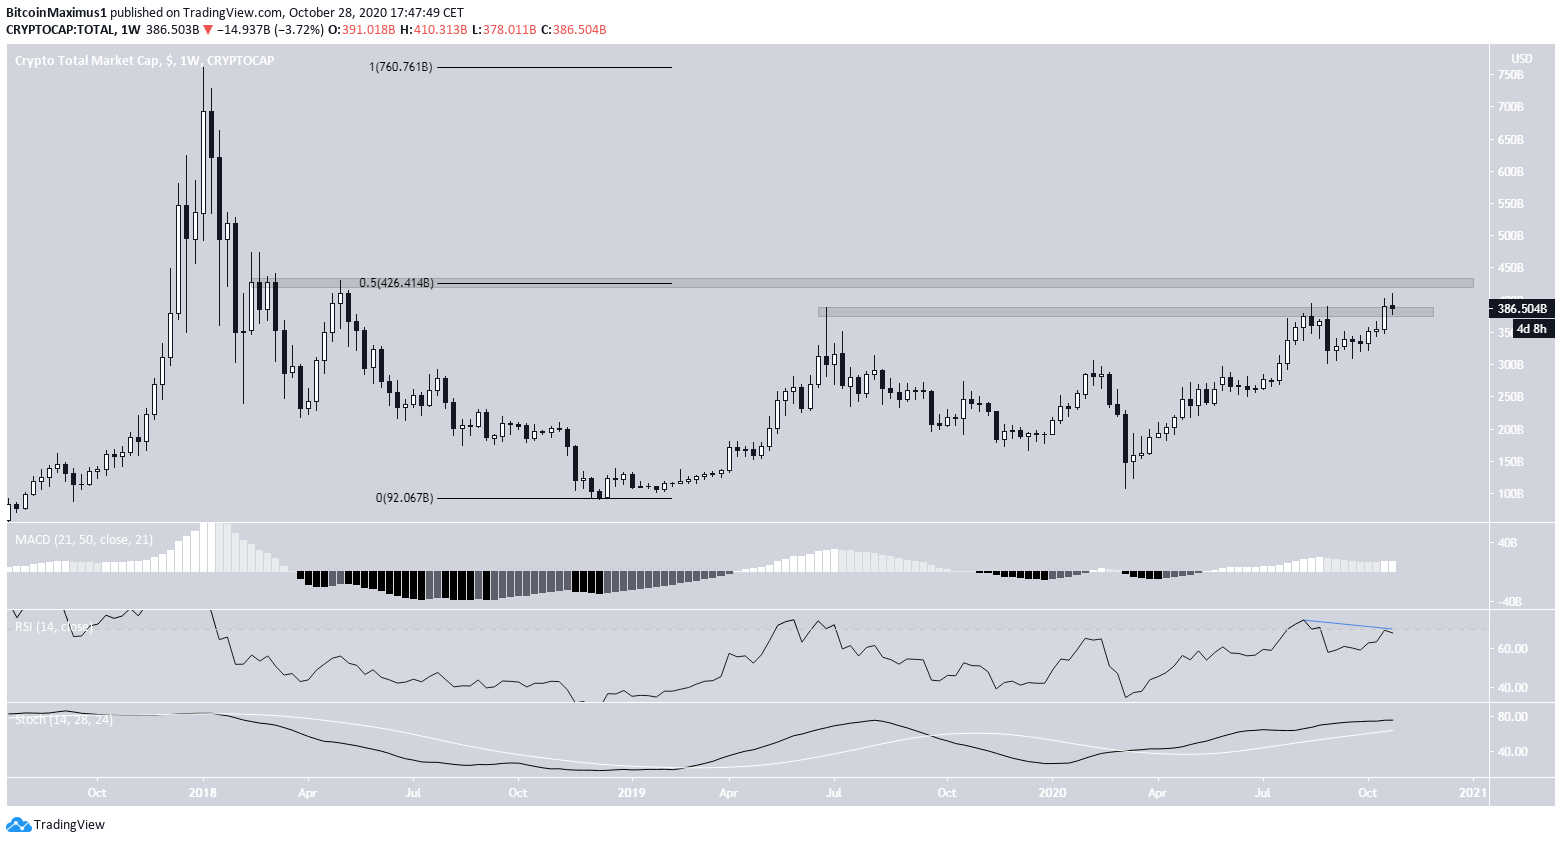
This week, TOTALCAP increased above the $390 billion resistance level to reach a high of $410 billion. This is the highest value recorded since Apr 2018. However, it has fallen back below $400 billion since.
Technical indicators have begun to show weakness. The weekly RSI has generated some bearish divergence, as has the weekly MACD, which has begun to decrease.
Furthermore, $425 billion is both a previous resistance level and the 0.5 Fib level of the entire decrease, so it will likely provide strong resistance in the future.
Until the TOTALCAP is successful in moving above this level, we cannot confidently state that the long-term trend is bullish.
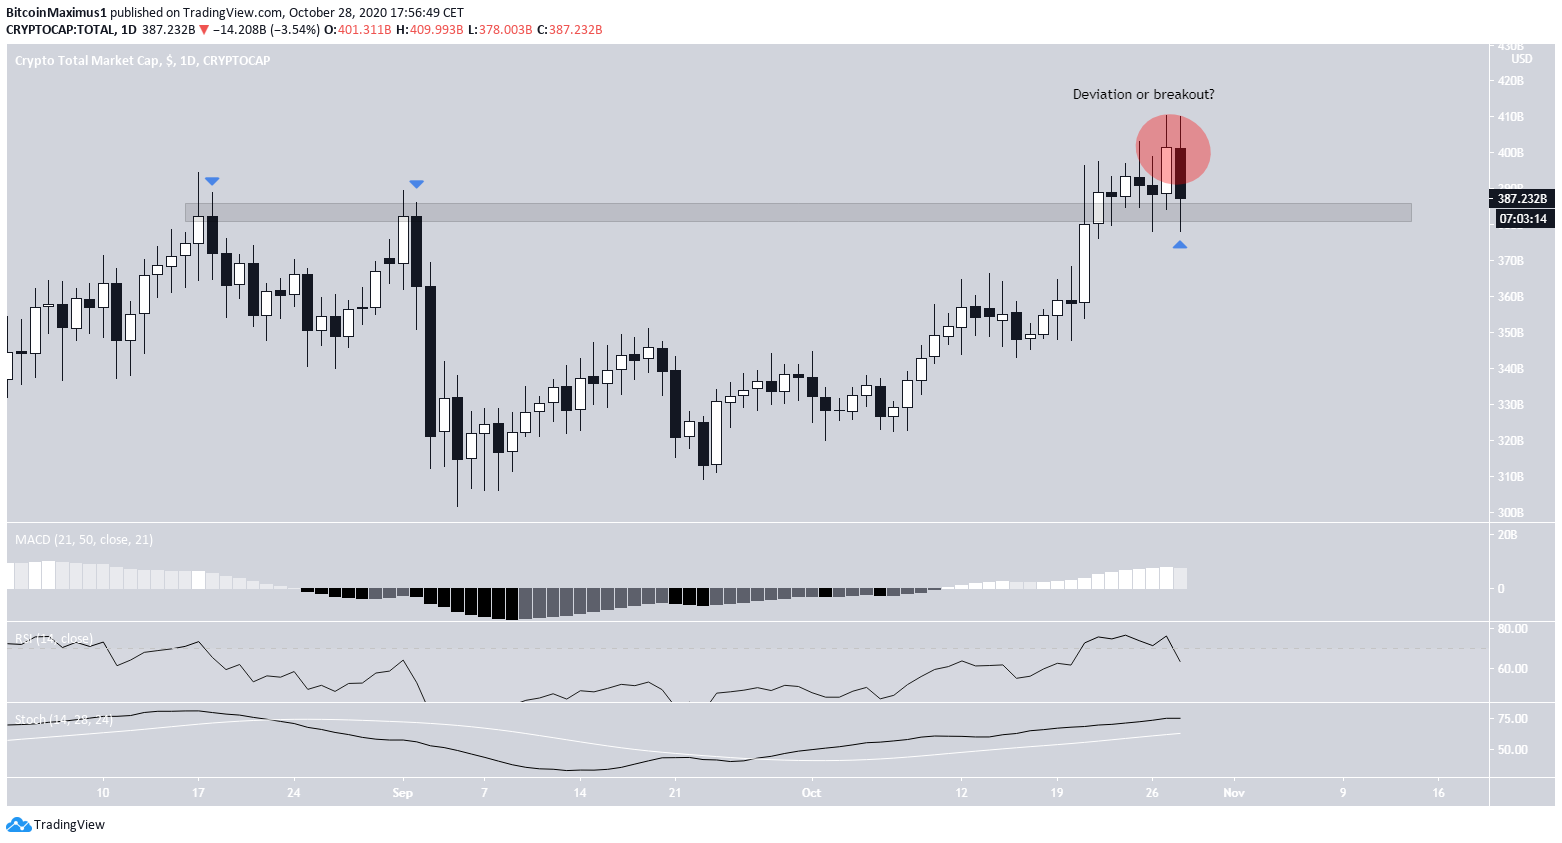
The daily chart is even more bullish. The TOTALCAP has flipped the $383 billion resistance level and is now in the process of validating it as support. As long as the cap is trading above this level, it is expected to make another attempt at moving above $415 billion.
Technical indicators are bullish and do not yet show weakness, even though the RSI is overbought.
Failure to stay above the $383 billion level would be a major bearish development since the current breakout would be considered a deviation above the range high. This could potentially be followed by a sharp move in the opposite direction.
At the time of press, there are no indications that the cap will decrease below the $383 billion support.
ALTCAP Wave Count
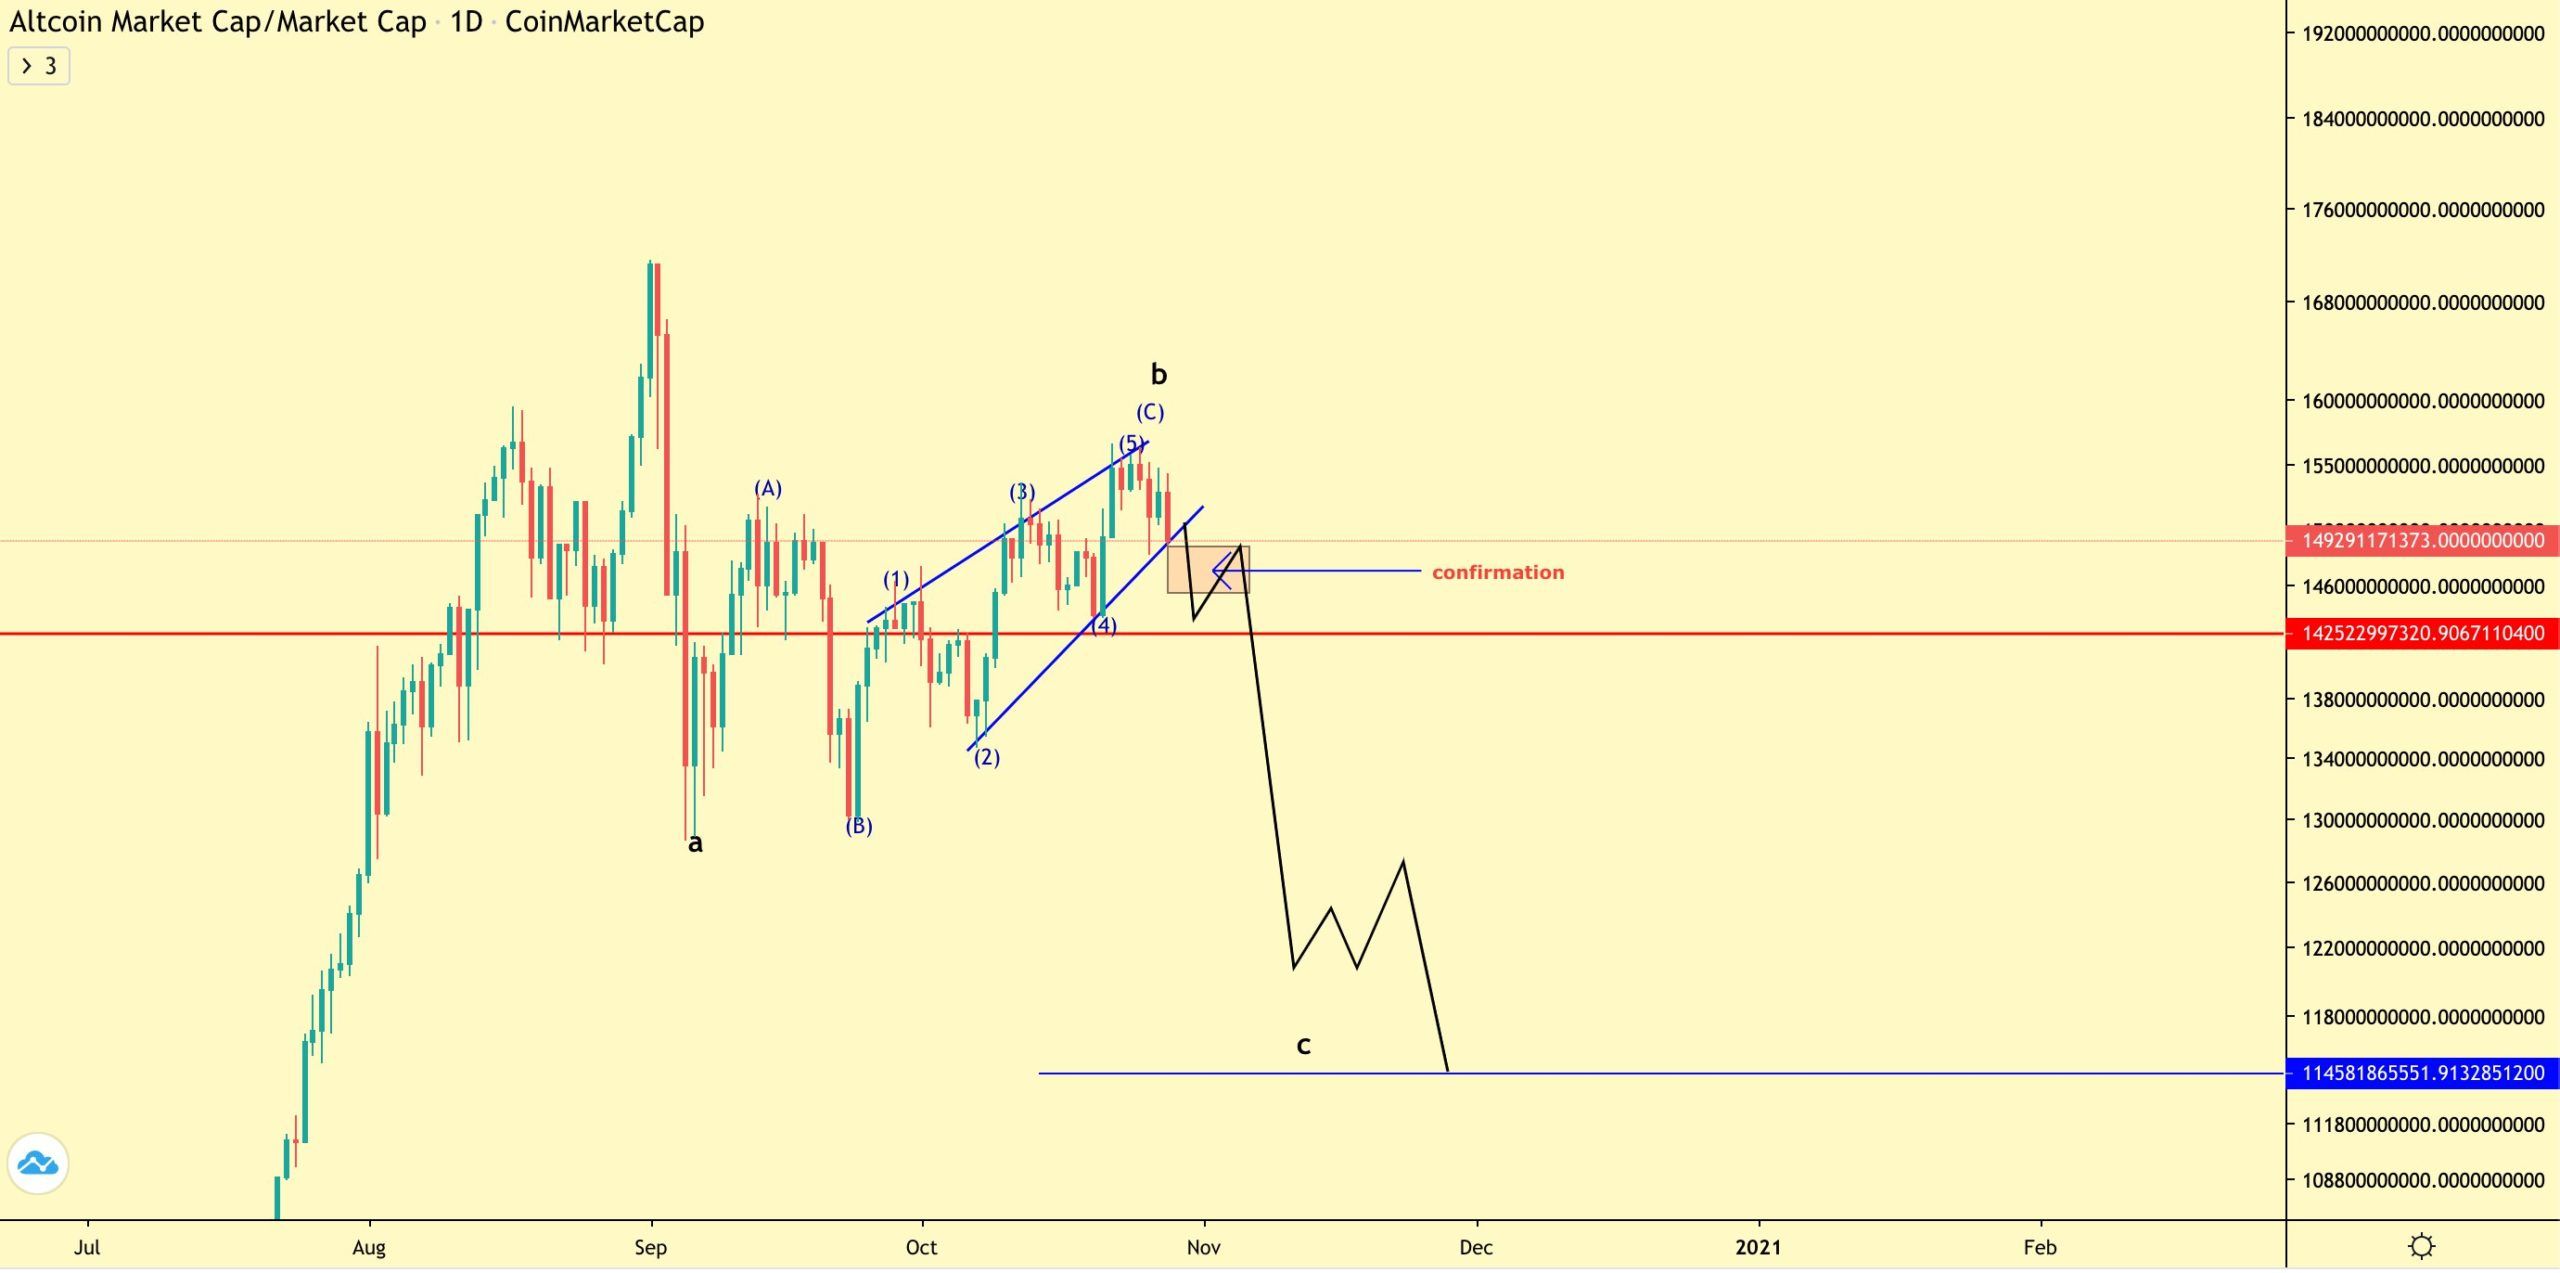
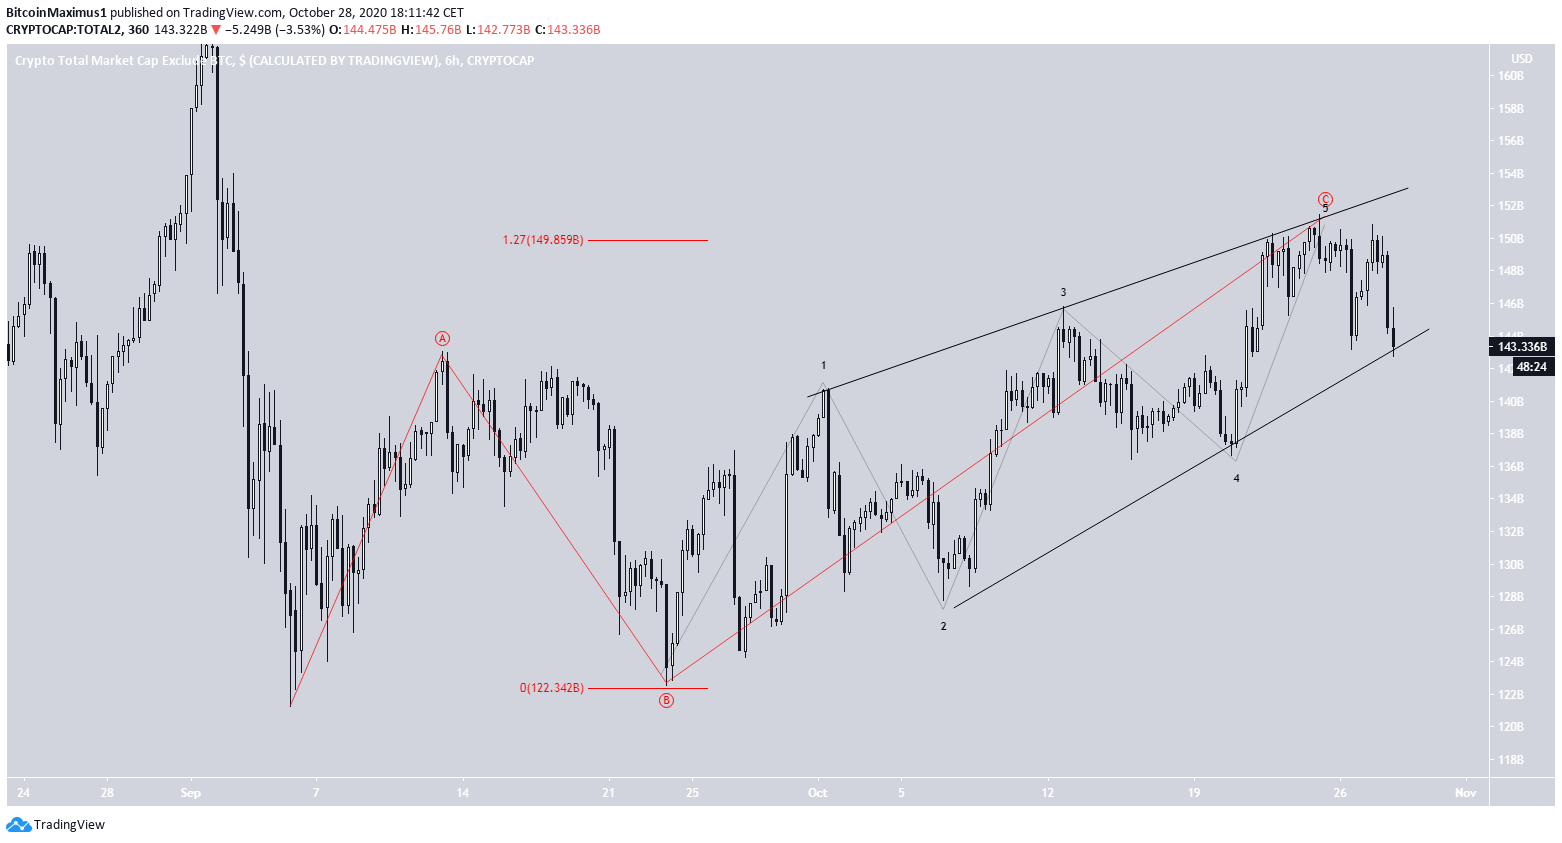
Cryptocurrency trader @TheEWguy stated that the altcoin market cap will likely decrease considerably since it has completed an ascending wedge, which is normally a bearish reversal pattern.
In addition, it is in the B wave of an A-B-C correction, so the C wave is expected to send the price back down.
An interesting observation is that the ALTCAP has not moved above its Sept 4 high of $160 billion, but rather created a long upper wick and decreased after touching the level. This is a bearish sign which indicates selling pressure.
Furthermore, technical indicators are bearish as both the RSI and MACD are decreasing, and the Stochastic Oscillator has made a bearish cross.
The main support area is found at $125 billion, a level that has stood since the ALTCAP broke out in August.
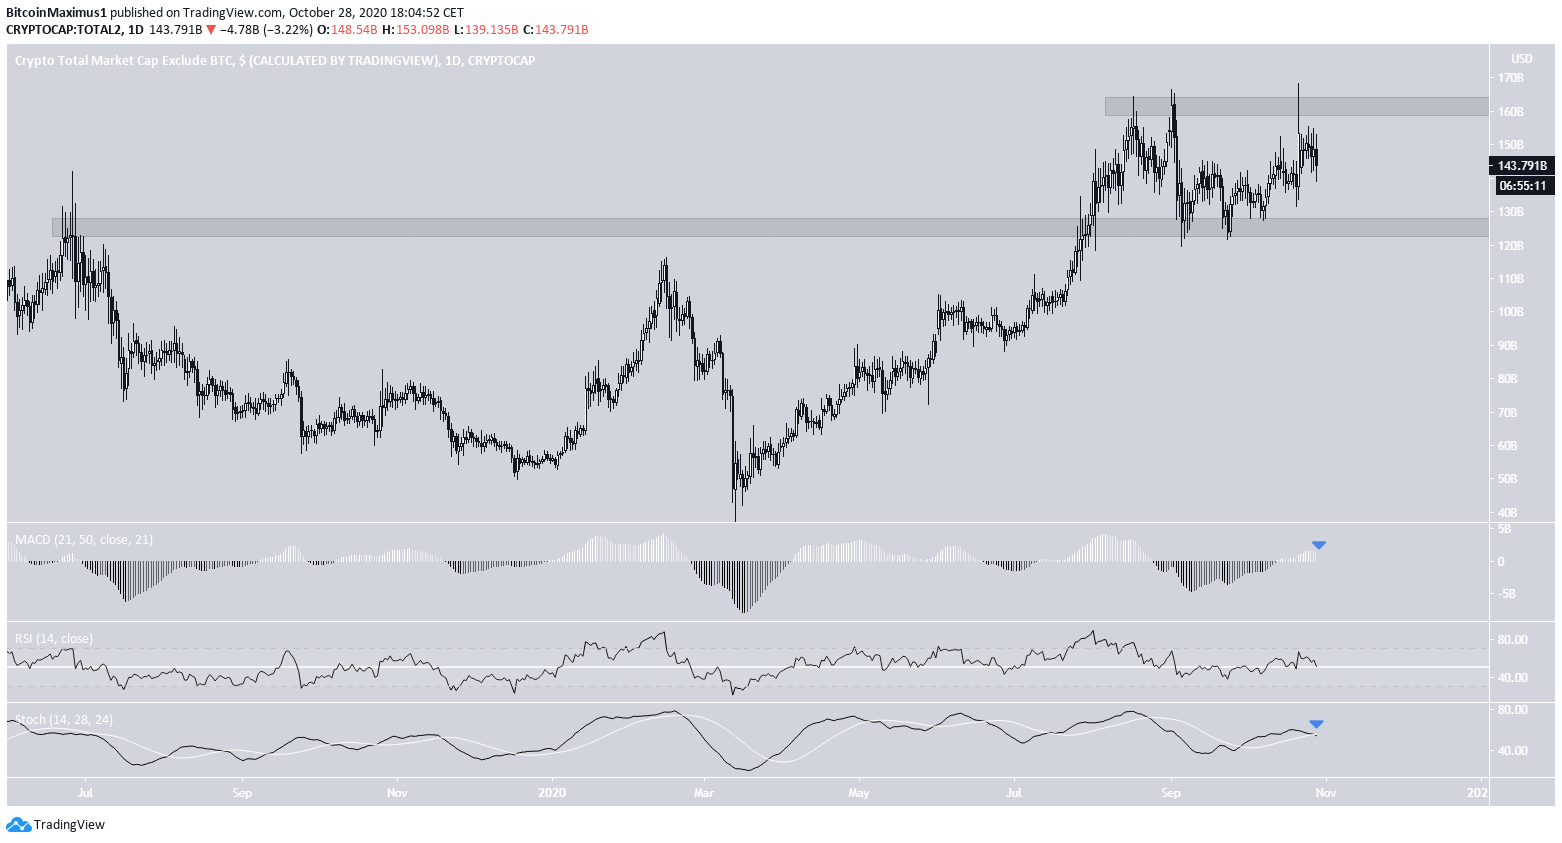
As for the wave count, it looks as if the ALTCAP has completed an A-B-C correction (shown in red below), in which the A:C waves had a 1:1.27 ratio, common in such corrections.
The C wave transpired in an ending diagonal (black). If the count is correct, the ALTCAP would be expected to decrease, as outlined in the tweet.
A decrease below the wave 4 low of $136 billion would likely confirm this possibility, while an increase above the wave 5 high at $151 billion would invalidate it.
For BeInCrypto’s previous Bitcoin analysis, click here!
Disclaimer: Cryptocurrency trading carries a high level of risk and may not be suitable for all investors. The views expressed in this article do not reflect those of BeInCrypto.
The post Total Cryptocurrency Marketcap Rapidly Outperforming the Altcoin Market Cap appeared first on BeInCrypto.


