XRP analysis
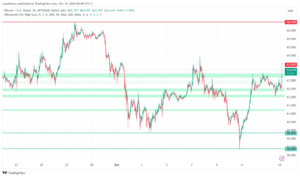
3 min readDespite a price jump in March, Ripple failed to generate a sustained breakout. Although the XRP price temporarily rose to a new high for the year at $0.58 after several positive news reports, confirmation above the blue resistance zone between 0.51 and 0.55 USD failed again. As a result, yesterday, Wednesday, April 26, XRP price slipped back to the 200-day moving average (EMA200) (blue) at 0.43 USD. As long as Ripple stabilizes above this important average line, the buyer side is still in control for the time being. Only a sustained fall below the horizontal support at 0.40 US dollars would cloud the chart again.

XRP: Bullish price targets for the next few weeks
Bullish price targets: 0.47 USD, 0.51 USD, 0.55 USD, 0.65 USD, 0.69 USD, 0.75/0.78 USD, 0.86/0.89 USD, 0.94/1.00 USD
The hoped-for directional decision has been postponed. The XRP course is currently in no man’s land. As long as the bulls are unable to generate sustained price momentum and attack the area of the highs from autumn 2022 and subsequently overcome the strong resistance at 0.56 USD, the chances of an increase are limited from a technical point of view.
If it succeeds in recapturing 0.47 USD, Ripple must then also break through the 0.51 USD mark. Only then does a directional decision at 0.55 USD come into consideration again. If the bulls manage to stabilize above this make-or-break level, a medium-term directional decision will be made in the orange zone. In addition to the high for the year, the 38 Fibonacci retracement of the overall downward movement also runs in this zone.
The buyer side initiates a liberation here, according to the first target price of 0.65 US dollars. The XRP price last failed here in May 2022. A jump above it activates further price targets at USD 0.70 and USD 0.75. The purple zone between 0.75 and 0.78 USD acts as a medium-term upside target. This is also where the parent 50 Fibonacci retracement of the full move down from the April 2021 high is found.
Only when this resist zone is broken could the XRP price continue towards the previous year’s highs of 0.89 US dollars. If Ripple breaks through this overarching price target, from a technical point of view, a march through to the maximum target zone between USD 0.94 and USD 1.00 cannot be ruled out.
Ripple: Bearish price targets for the next few weeks
Bearish price targets: 0.42 USD/0.40 USD 0.38 USD, 0.36 USD, USD0.33, 0.31/0.29 USD
The sellers were back on the floor at the last second and prevented a bullish change in market structure at the end of March. XRP price corrected by more than 20 percentage points in the last 4 weeks of trading. As long as the price remains capped below the blue zone, an extension of the correction is possible at any time. A first indication would be a relapse below the EMA200 including downward acceleration in the direction of the yellow support zone. If the ripple corrects below USD 0.42, it will be exciting between USD 0.40 and USD 0.38.
If the buy side remains abstinent here, XRP price should head for the cross support from the red downtrend line and March lows at $0.36. If the bears also manage to undercut this area, Ripple could fall back to the purple support zone on a direct path. Stabilization must set in here in order to avert a sell-off back towards the lows for the year. A break below 0.33 USD would take Ripple into the key 12-month support range of 0.31 to 0.29 USD.
Looking at the indicators
Both indicators RSI and MACD show a sell-signal in the daily chart. The RSI has failed to rise into the neutral zone between 45 and 55 several times in the last seven days. Due to the current stalemate, the RSI is also threatening to dive back into the neutral zone between 45 and 55. Although the MACD has now breached the 0-line to the upside, this buy-signal does not help the bulls in the short-term due to the sluggishness of the MACD indicator.

