XRP Reclaims Support, EOS and TRX Look to Do the Same
2 min readXRP (XRP) is trading inside a descending parallel channel and has reclaimed the $0.90 horizontal area.
EOS (EOS) is trading inside a range between $5.10 and $8, respectively.
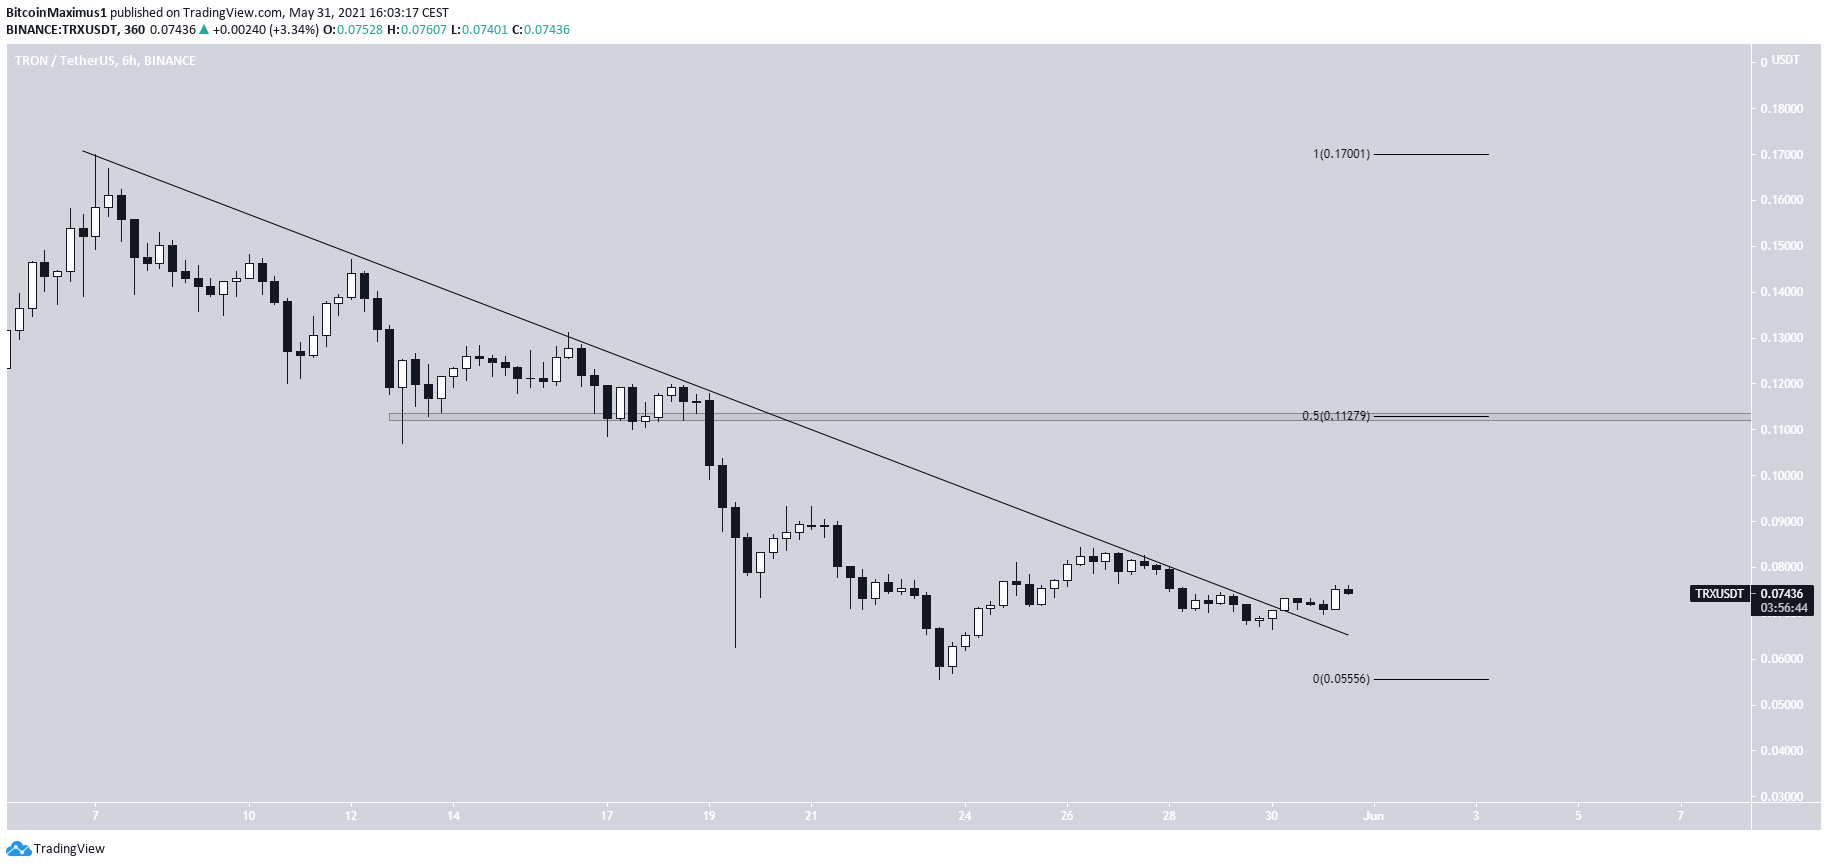
Tron (TRX) has bounced at the $0.0625 support area and broken out from a short-term descending resistance line.
XRP
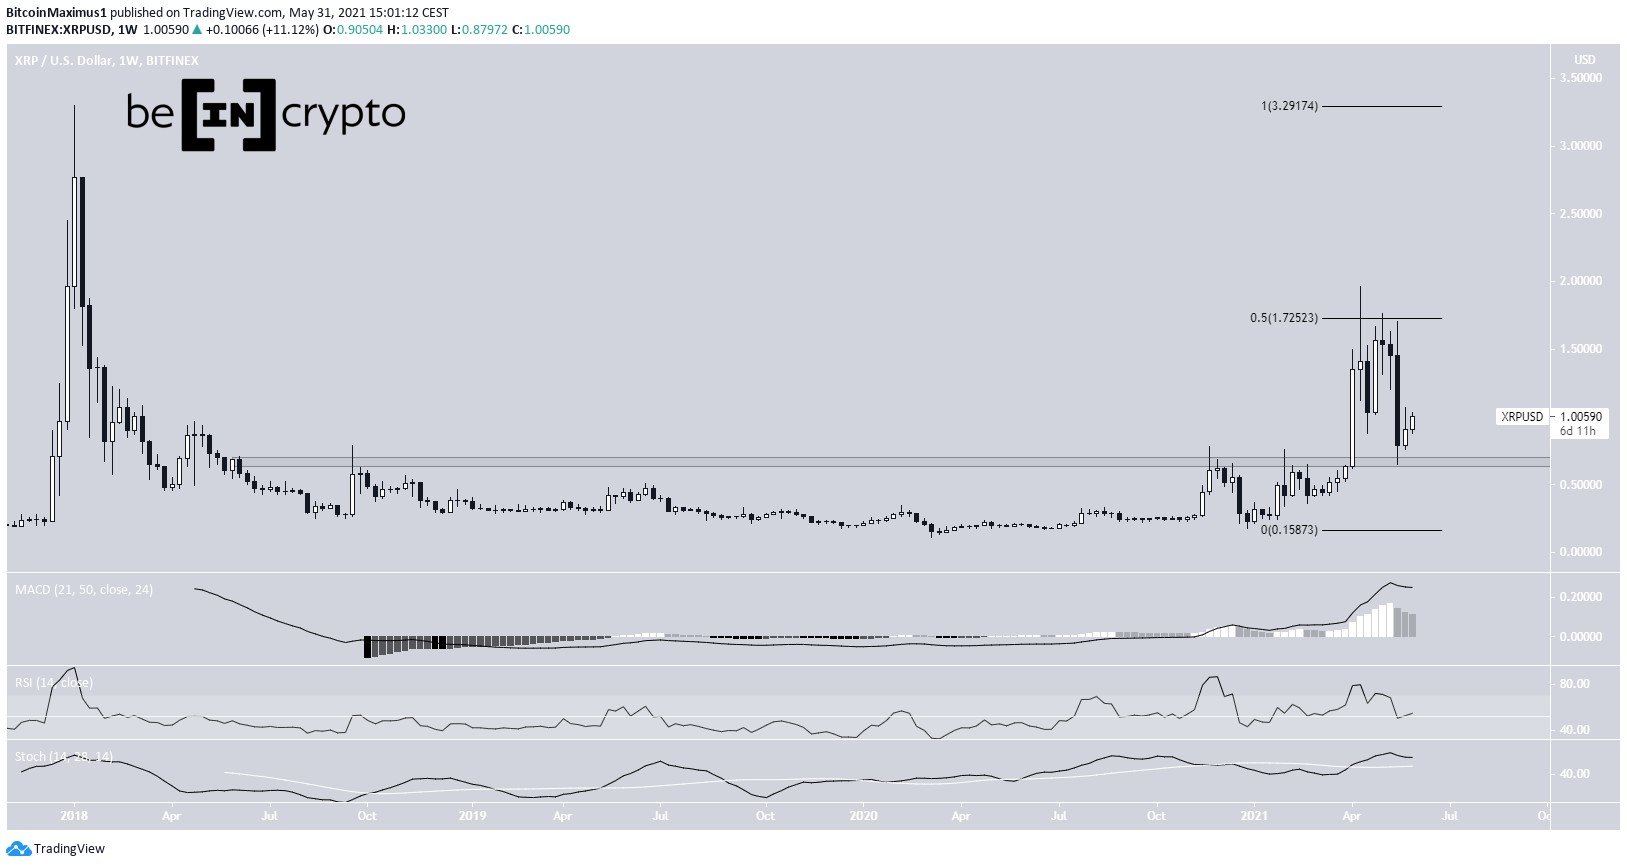
Despite the ongoing decrease, the weekly chart for XRP still looks bullish.
The drop served to validate the long-term $0.66 area as support. The price has been increasing since and could potentially resume its bounce.
Technical indicators are still bullish. The RSI is above 50 and the Stochastic oscillator is still increasing. Therefore, the price action combined with technical indicators suggest that an upward movement is more likely than a breakdown.
The daily chart aligns with this view.
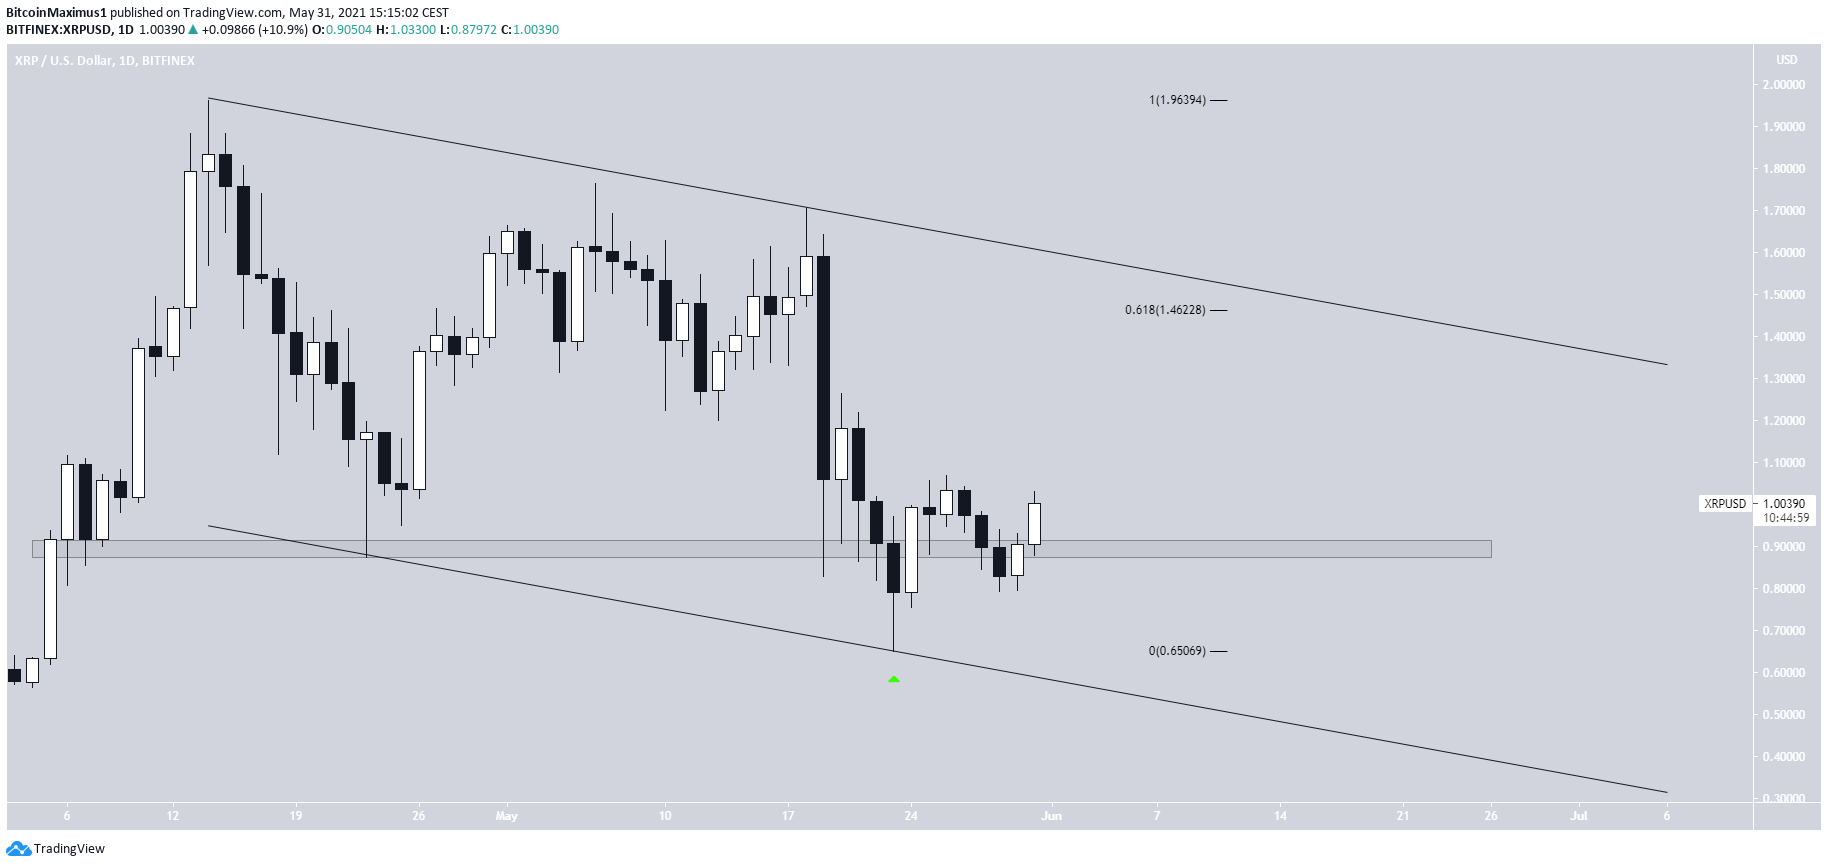
Since its April 14 high, XRP has been trading inside a descending parallel channel. It has been moving upwards since bouncing at the support line of the channel on May 23 (green icon).
Currently, it is in the process of reclaiming the $0.90 horizontal area. If successful, it could increase all the way to $1.46. This is the 0.618 Fib retracement level and the resistance line of the channel. Both are likely to provide resistance.
Highlights
- There is long and short-term support at $0.66 and $0.90, respectively.
- XRP is trading inside a descending parallel channel.
EOS
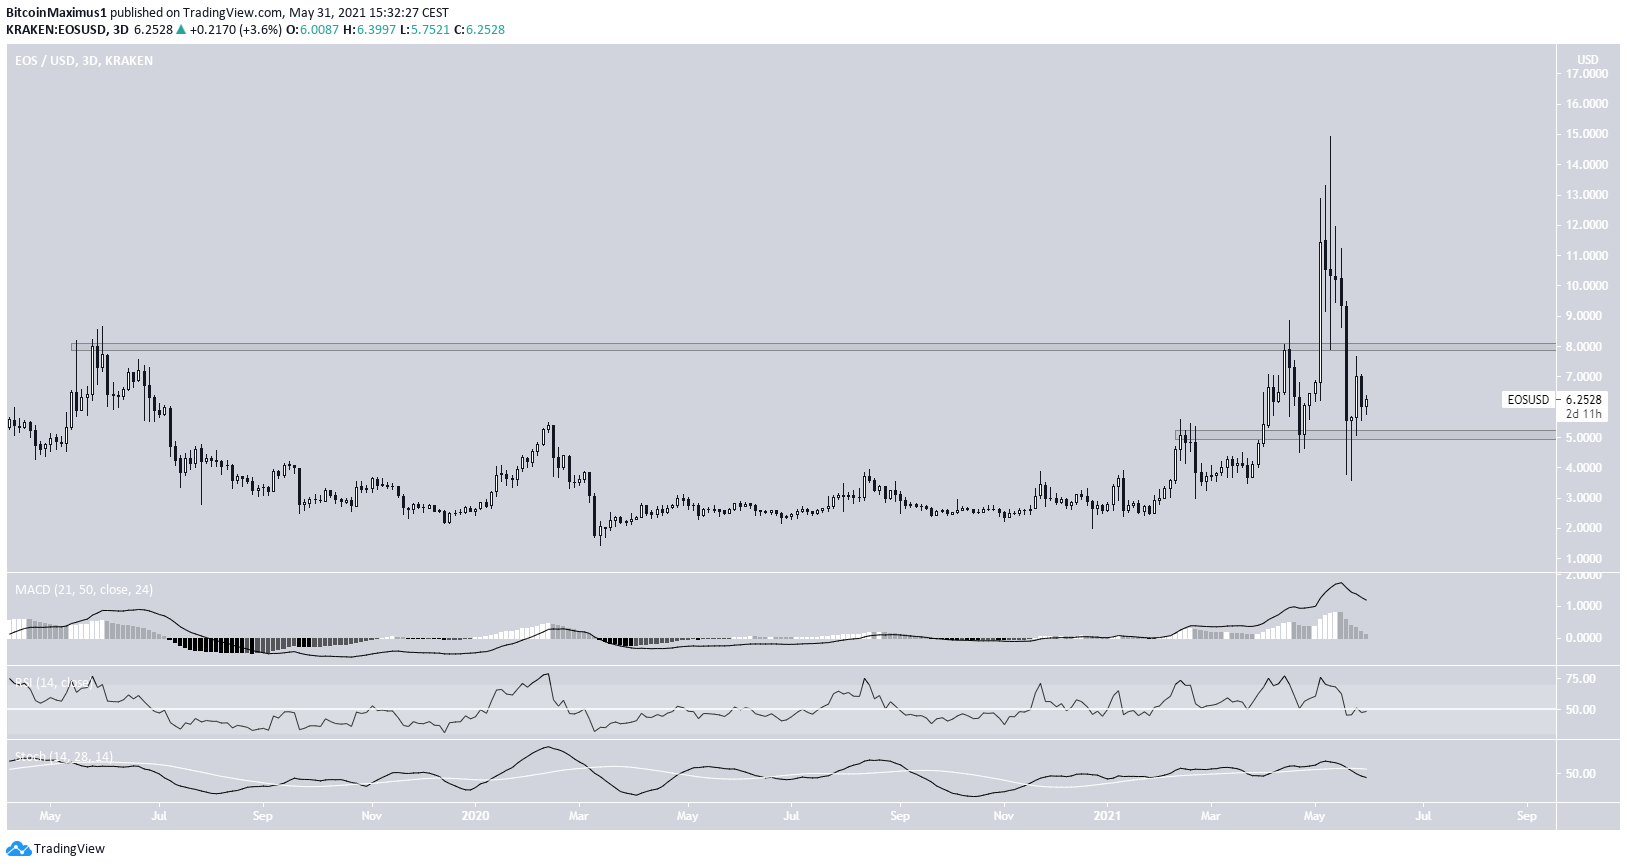
Similarly to XRP, EOS has decreased considerably in May. On May 23, it reached a low of $3.57 before bouncing.
While the bounce caused a reclaim of the $5.10 support area, EOS is still trading below the long-term $8 resistance area. Until it breaks out, we cannot consider the trend bullish.
Furthermore, technical indicators are neutral, failing to confirm the direction of the trend. Therefore, EOS could continue consolidating between these two levels, before a decisive movement transpires.
Highlights
- There is support and resistance at $5.10 and $8, respectively.
- Technical indicators are neutral.
TRX
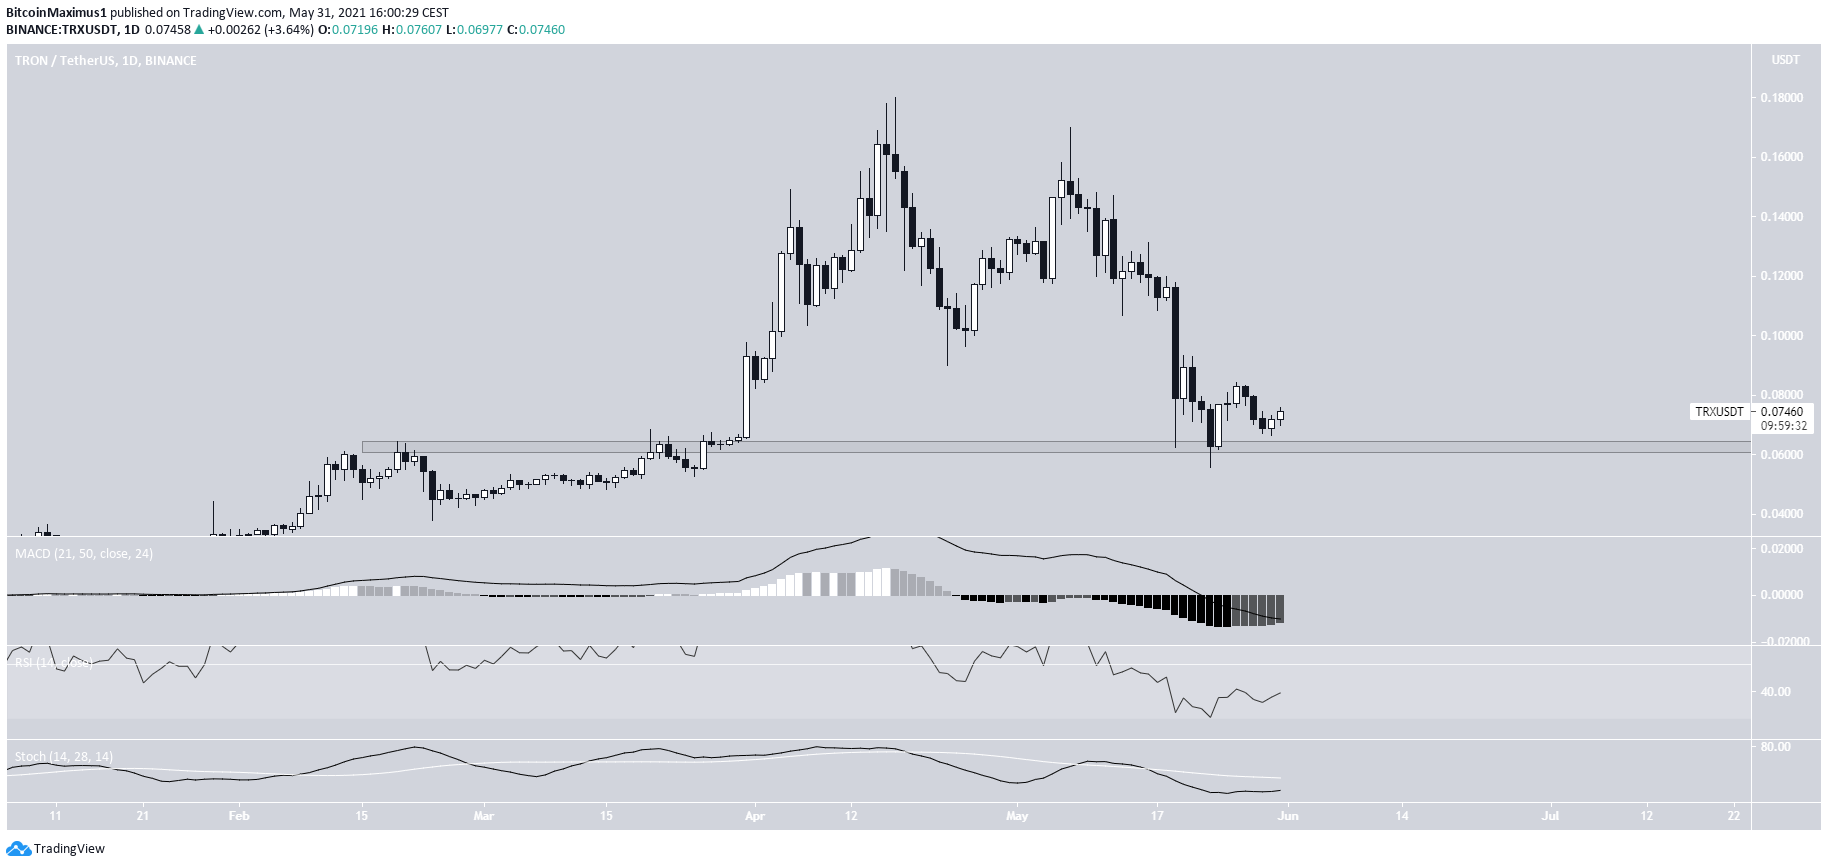
Unlike EOS and XRP, TRX has been decreasing since April. It created a low high on May 11, before falling once more, this time at an accelerated rate.
The decrease culminated with a low of $0.055, which was reached on May 23.
TRX created a bullish engulfing candlestick the next day and bounced. It is currently in the process of creating a higher low. Technical indicators are showing some bullish signs, but have yet to confirm the bullish trend.
The shorter-term six-hour chart shows a breakout from a descending resistance line. This indicates that an upward movement is likely, at least in the short-term.
There is resistance at $0.112. In order for the longer-term trend to be considered bullish, TRX has to reclaim this level. If it did, it would also likely generate a bullish reversal in daily time-frame indicators.
Highlights
- There is support at $0.0625.
- TRX has broken out from a short-term descending resistance line.
For BeInCrypto’s latest BTC (BTC) analysis, click here.
The post XRP Reclaims Support, EOS and TRX Look to Do the Same appeared first on BeInCrypto.


