BTC analysis – the next days will decide on the next trend
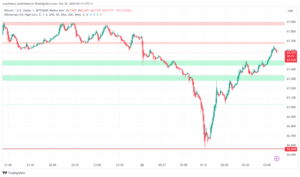
1 min readBTC in the short term the sideway continues and creates rising lows and falling highs. In addition, still failed to overcome resistance from the maximum of the last correction and so on trend reversal not confirmed. Meanwhile, the dominance of the main cryptocurrency reaches 41.47% and continues in a long-term declining trend.
If the price really confirms the bottom, then first target which I follow, is on the surface approx $ 42,000. This price level represents the point of control of the whole bear flag which is valid for almost the whole year 2022. At the same time, this movement would overcome the price resistance from the maximum correction leg.
 BTC continues sideway over support. Source: TradingView
BTC holds $ 40,000
If we take into account that the bear flag should be closed with a corrective leg, then we must also take into account bearish scenario. Support zones need to be monitored at the following price levels: $ 39,000, $ 36,000 and $ 30,000. The $ 30,000 level is the band where it pays to buy into a long-term holding company.
I’m currently watching too the most bearish scenario on MA200 on the weekly chart. The indicator is currently at around $ 21,200 and growing over time. Until the price reaches it, it could happen that the absolute bottom could be around the level of $ 25,000. So far, this is just speculation and the price does not have to fall to this band. But if it falls, we know it will an opportunity that has not arisen for a long time.


