BTC (BTC) Continues Consolidating Inside Monthly Range
2 min readBTC (BTC) decreased considerably during the week of July 12-19, reaching a low of $31,020.
While long-term indicators are still bearish, the short-term outlook indicates that a rebound in price is expected.
Long-term support
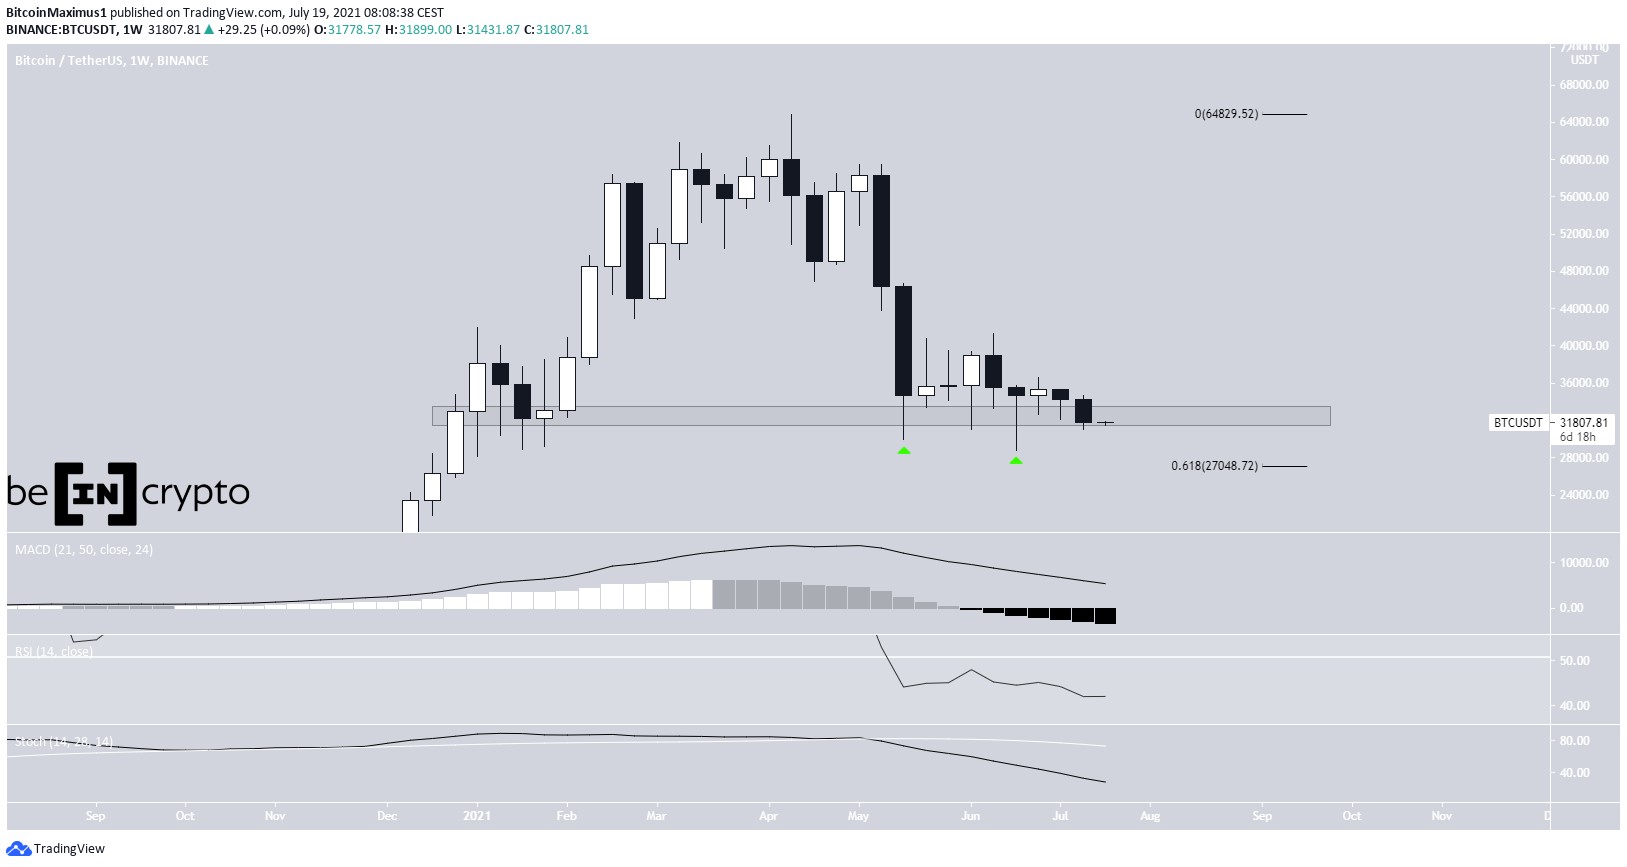
BTC decreased during the week of July 12-19, creating a bearish candlestick and falling to a low of $31,020.
Despite the drop, it’s still trading inside the $32,400 long-term horizontal support area, which has been in place since the beginning of January, creating several long lower wicks. The next closest support area is at $27,000.
Technical indicators in the weekly time-frame are bearish. The MACD is decreasing and is nearly negative, the RSI is below 50, and the Stochastic oscillator has made a bearish cross.
Therefore, it’s likely that the long-term trend is bearish.

Trading range
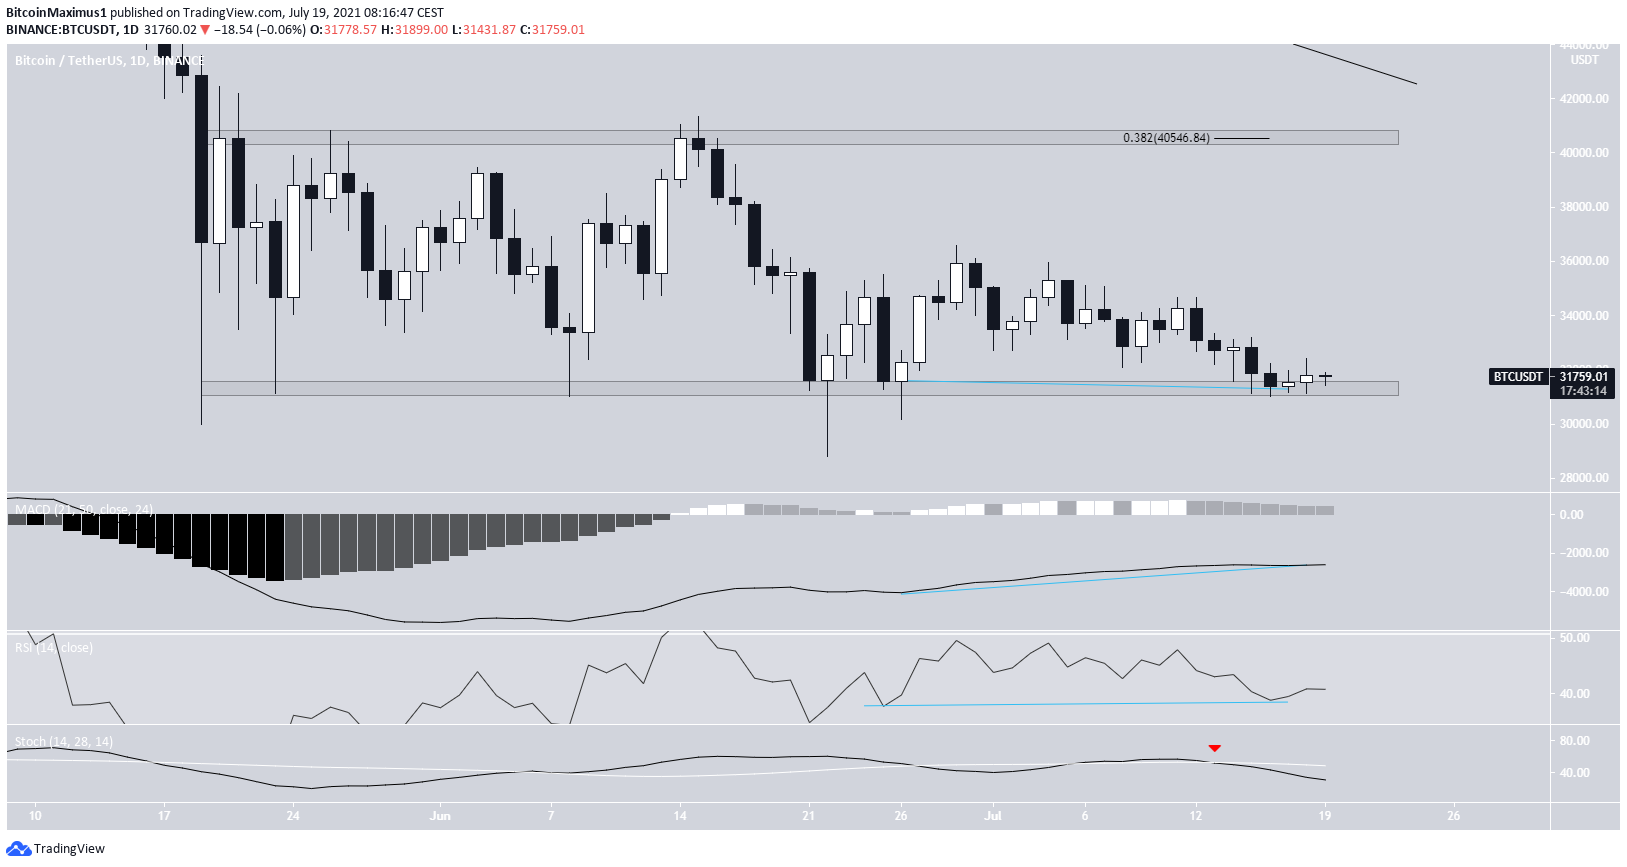
The daily chart shows that BTC is still trading inside the same range of $30,300 and $40,550, which has been in place since May 19.
Currently, it’s trading near the support area.
Technical indicators provide a mixed outlook. The MACD signal line and RSI have both generate bullish divergences. However, the former is below 0 while the latter is below 50. In addition to this, the Stochastic oscillator has made a bearish cross (red icon).
Therefore, while technical indicators are still bearish, there are signs in place for a potential bounce.

Short-term BTC movement
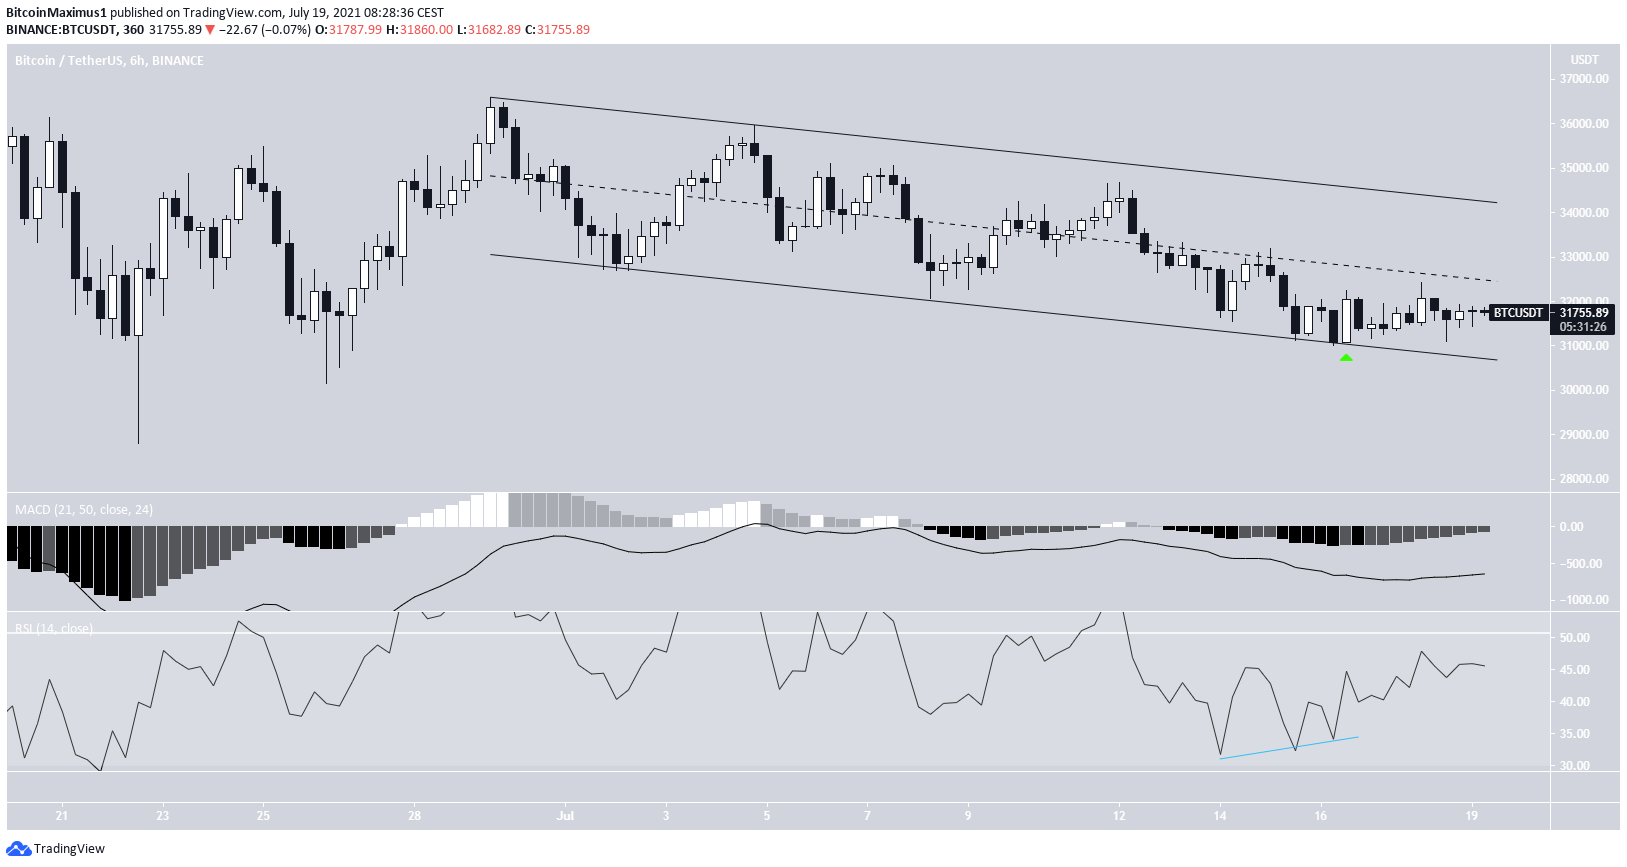
The six-hour chart shows that BTC has been trading inside a descending parallel channel since June 29. Such channels often contain corrective movements.
BTC has been increasing since bouncing on the support line (green icon) on July 16. The upward movement was preceded by a bullish divergence in the RSI. While the MACD is moving upwards, the price is still in the lower portion of the channel.
It has to reclaim the midline of the channel in order for a breakout to become likely. If one occurs, BTC would likely revisit the range highs near $40,550.

For BeInCrypto’s previous BTC (BTC) analysis, click here.
The post BTC (BTC) Continues Consolidating Inside Monthly Range appeared first on BeInCrypto.


