BTC (BTC) Drops to Crucial Support Level Confluence
2 min readBTC (BTC) decreased considerably on July 13, resuming the descent that began the previous day and hit a low of $32,202.
So far, BTC has continued moving downwards in the early hours of July 14. However, it’s rapidly approaching a confluence of support levels.
BTC trading range
BTC is still trading inside the range of $31,300 and $40,550 that’s been in place since May 19. Currently, it’s trading slightly above the $31,300 horizontal support area.
The price has been moving downwards since July 12 after it reached a local high of $34,678. The ongoing descent has caused daily time-frame indicators to turn bearish.
The MACD has given a bearish reversal signal and the Stochastic oscillator has made a bearish cross (red icon). The RSI is also below 50.
Therefore, daily signals are bearish.

Short-term channel
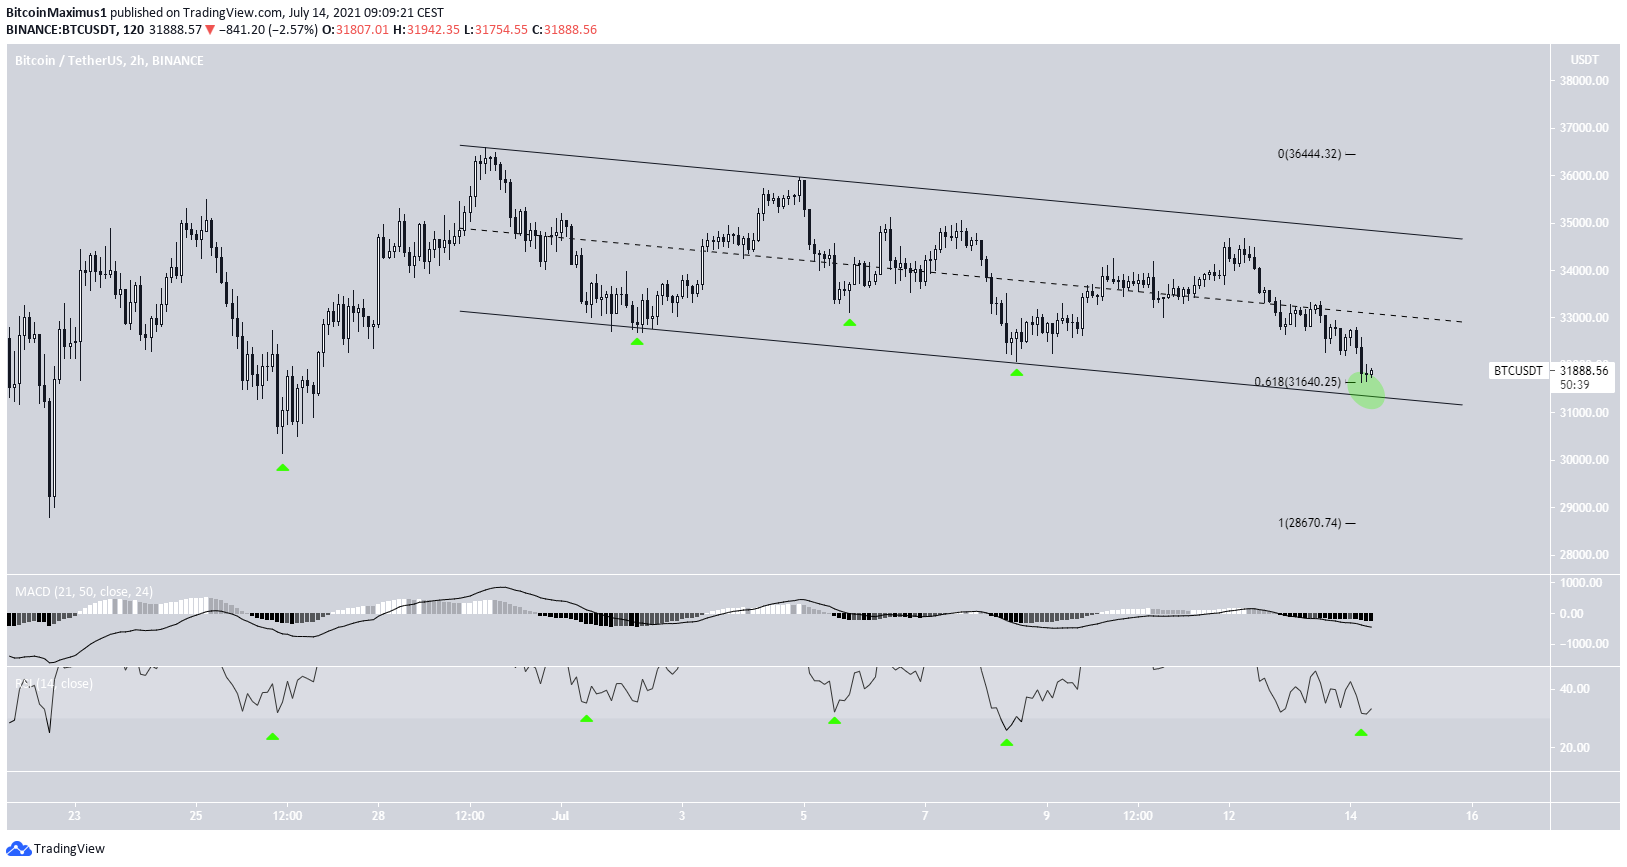
The two-hour chart shows that BTC has been trading inside a descending parallel channel since June 29. Such patterns often contain corrective structures. In addition to this, the movement inside the channel looks extremely gradual and choppy, making it unlikely that it’s part of a bearish impulse.
Technical indicators do not yet show any signs of a bullish reversal. However, the two-hour RSI is approaching oversold levels, which have initiated strong bounces over the past month (green icon).
In addition to this, BTC is trading at a confluence of support levels at $31,640. This is the 0.618 Fib retracement support level and the support line of a descending parallel channel.

Wave count
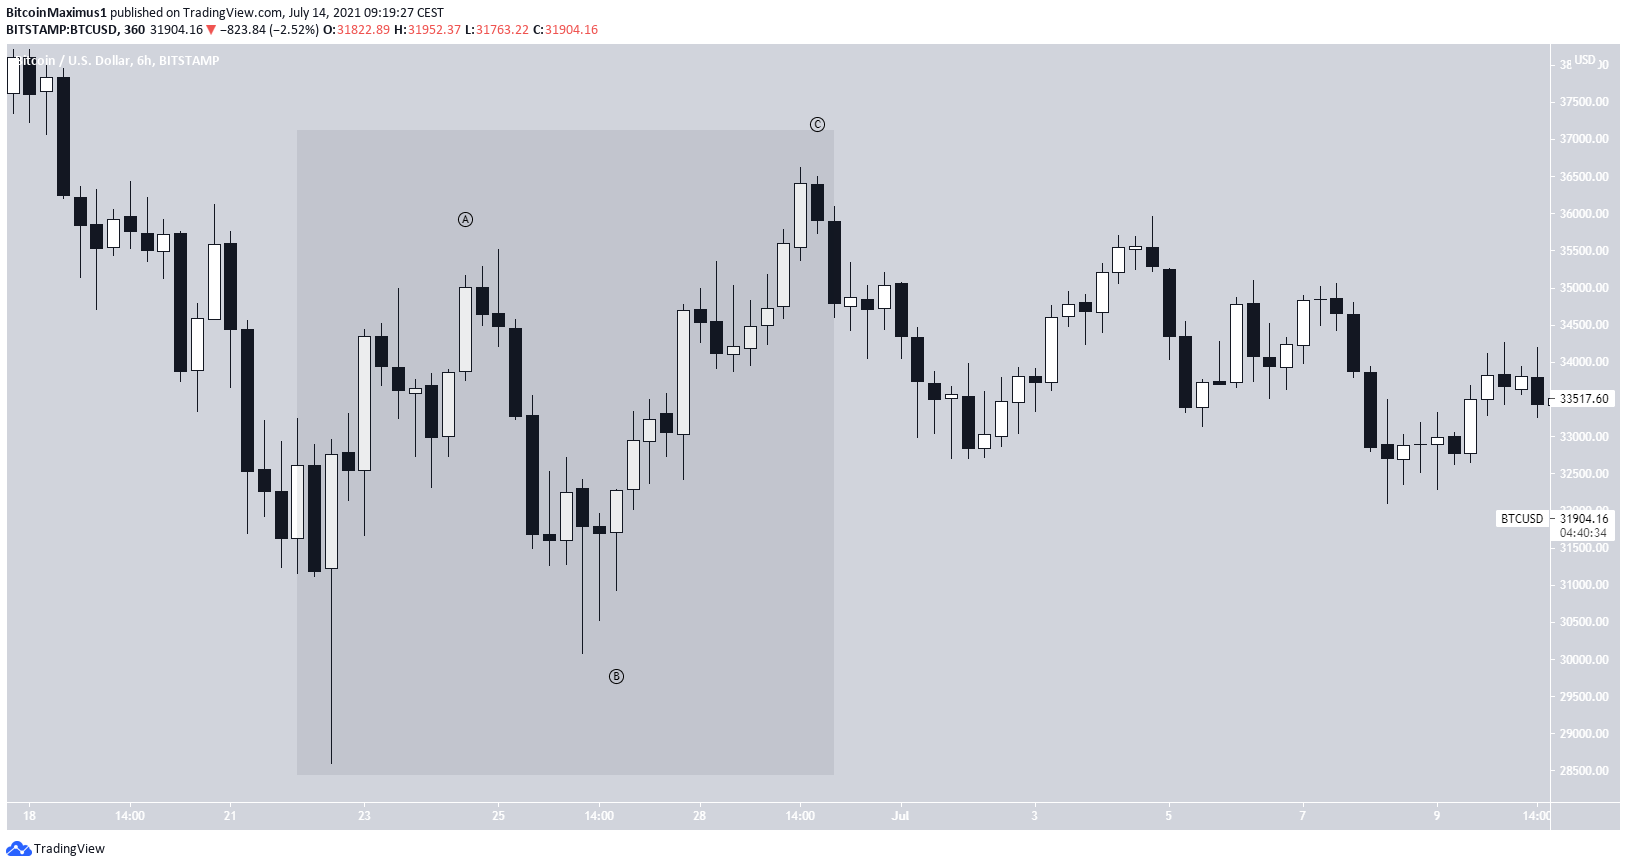
The exact wave count is not entirely clear. BTC has been increasing since the June 22 low of $28,600.
However, the upward movement is clearly a three wave structure. Therefore, it’s unlikely to be the beginning of a new bullish impulse and is either a completed or partial corrective structure.

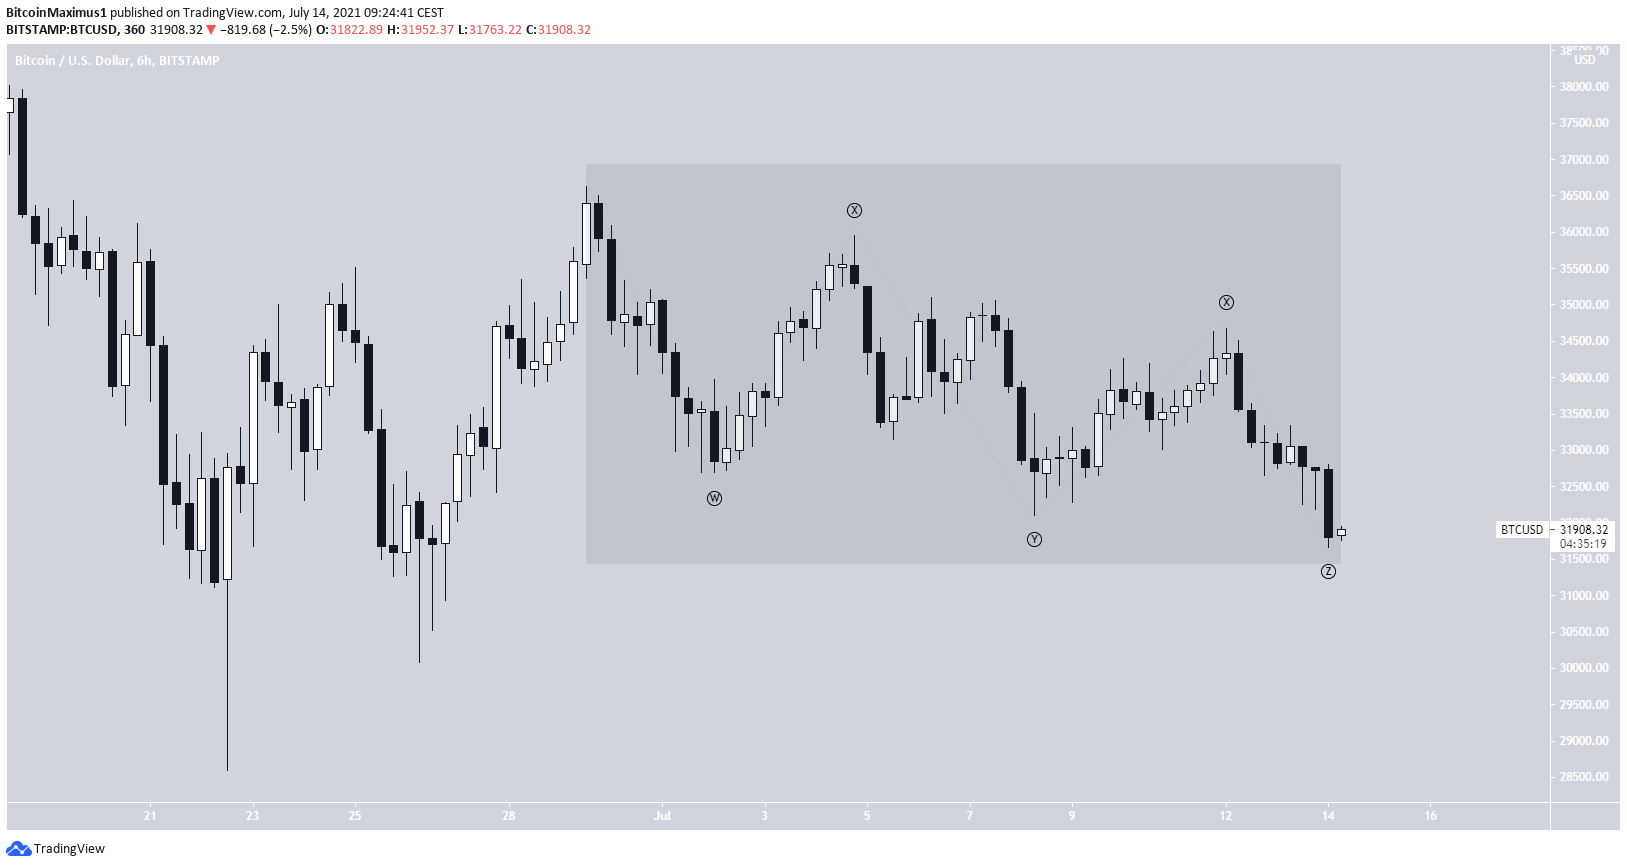
However, the downward move does not look like the beginning of a bearish impulse but is likely part of a complex corrective structure. Therefore, it seems that another upward move is likely, fitting with the previously outlined parallel channel.

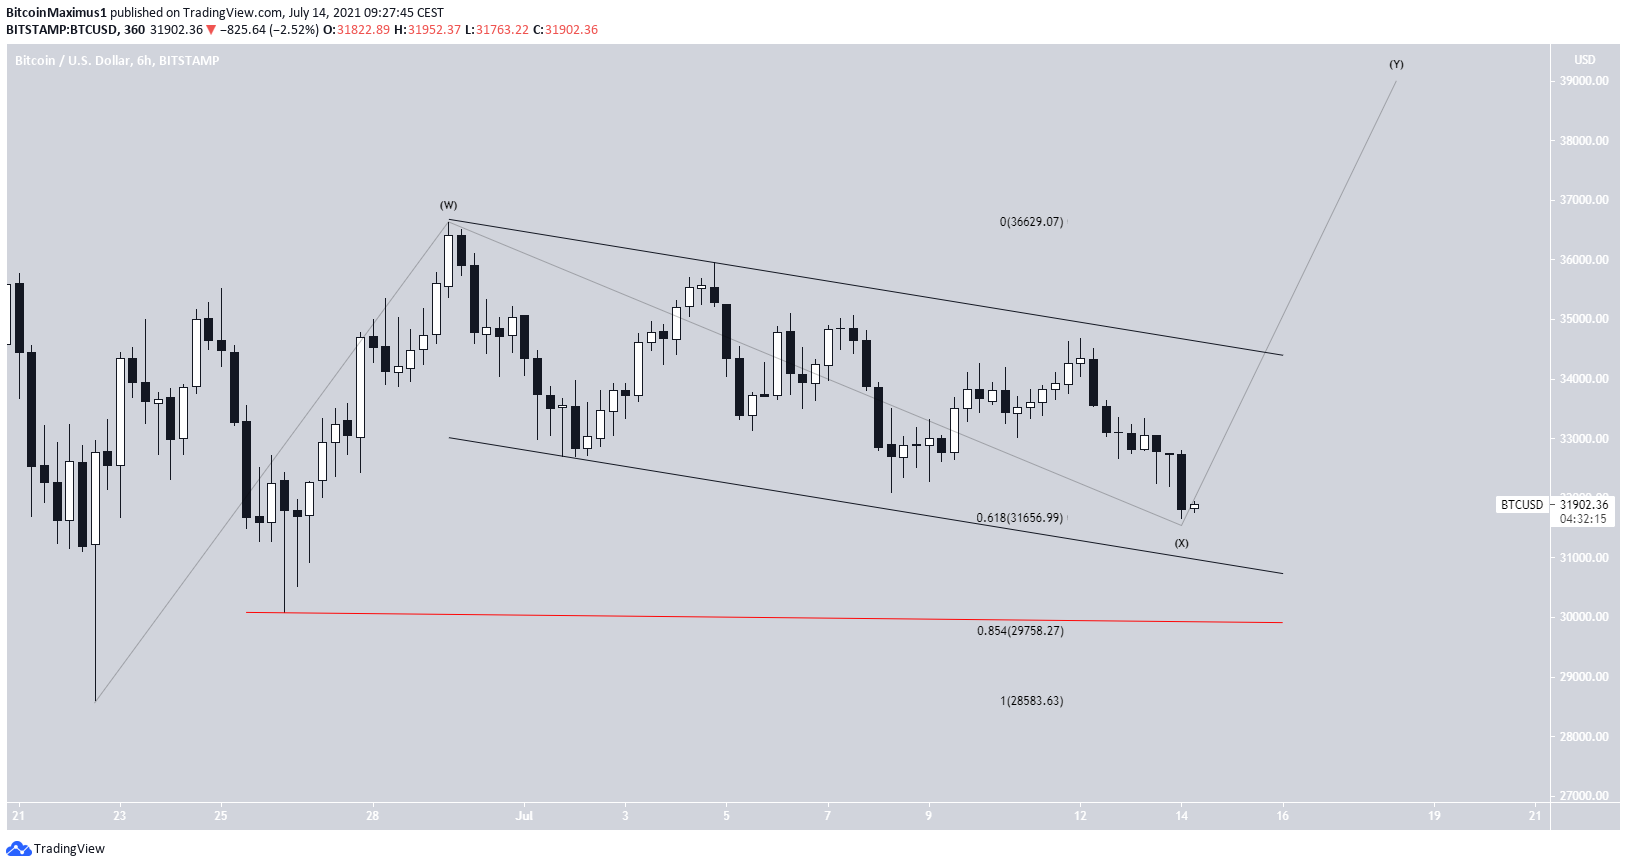
The most likely count indicates that the entire movement since the June 22 low is corrective. In this possibility, the price is currently in the second portion of the correction, after which an upward move toward the range highs will transpire.
The current price level is suitable for the initiation of a bounce, since it’s the 0.618 Fib retracement level.
A sweep of the June 26 lows at $30,082 is also possible before moving upwards seems like the most likely scenario at this point. This would cause a touch of the 0.786 Fib retracement support level.

For BeInCrypto’s latest BTC (BTC) analysis, click here.
The post BTC (BTC) Drops to Crucial Support Level Confluence appeared first on BeInCrypto.


