BTC (BTC) Makes Another Attempt at Clearing $40,000
2 min readBTC (BTC) is trading inside the $40,550 resistance area, making this its third breakout attempt so far.
While BTC has created seven successive bullish candlesticks, short-term indicators are showing weakness.
BTC struggles with range high
BTC has been moving upwards since July 20, after it had reached a local low of $29,278. So far, it has reached a high of $40,900 on July 28.
The high was made inside the $40,500 resistance area, which is the range high that has been in place since May 19. In addition it is the 0.382 Fib retracement resistance level.
The ongoing upward movement has caused technical indicators to turn bullish. The Stochastic oscillator has made a bullish cross and the RSI is above 70. The MACD is also increasing and is nearly positive.
Since the low on July 20, BTC has created seven bullish candlestick in a row. This is a relatively rare event, so a few bearish candlesticks would be expected.

Short-term weakness
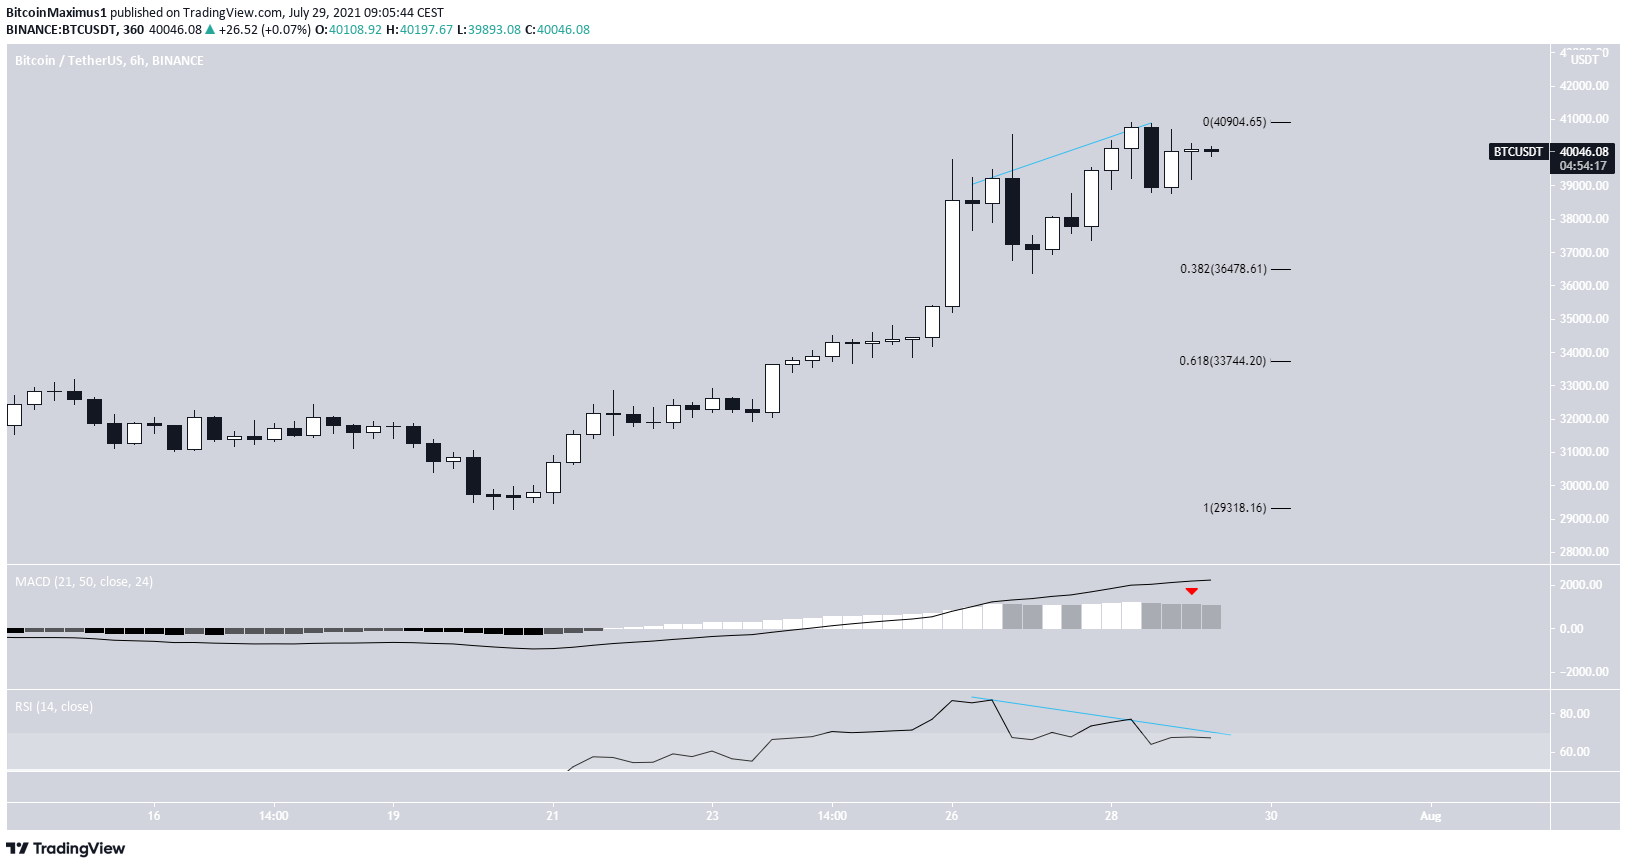
The six-hour chart is also showing some weakness. The MACD has given a bearish reversal signal and the RSI has generated a bearish divergence.
In addition to this, BTC has already created a bearish engulfing candlestick.
If a drop occurs, the closest support levels are found at $36,500 and $33,750. These are the the 0.382 and 0.618 Fib retracement support levels.

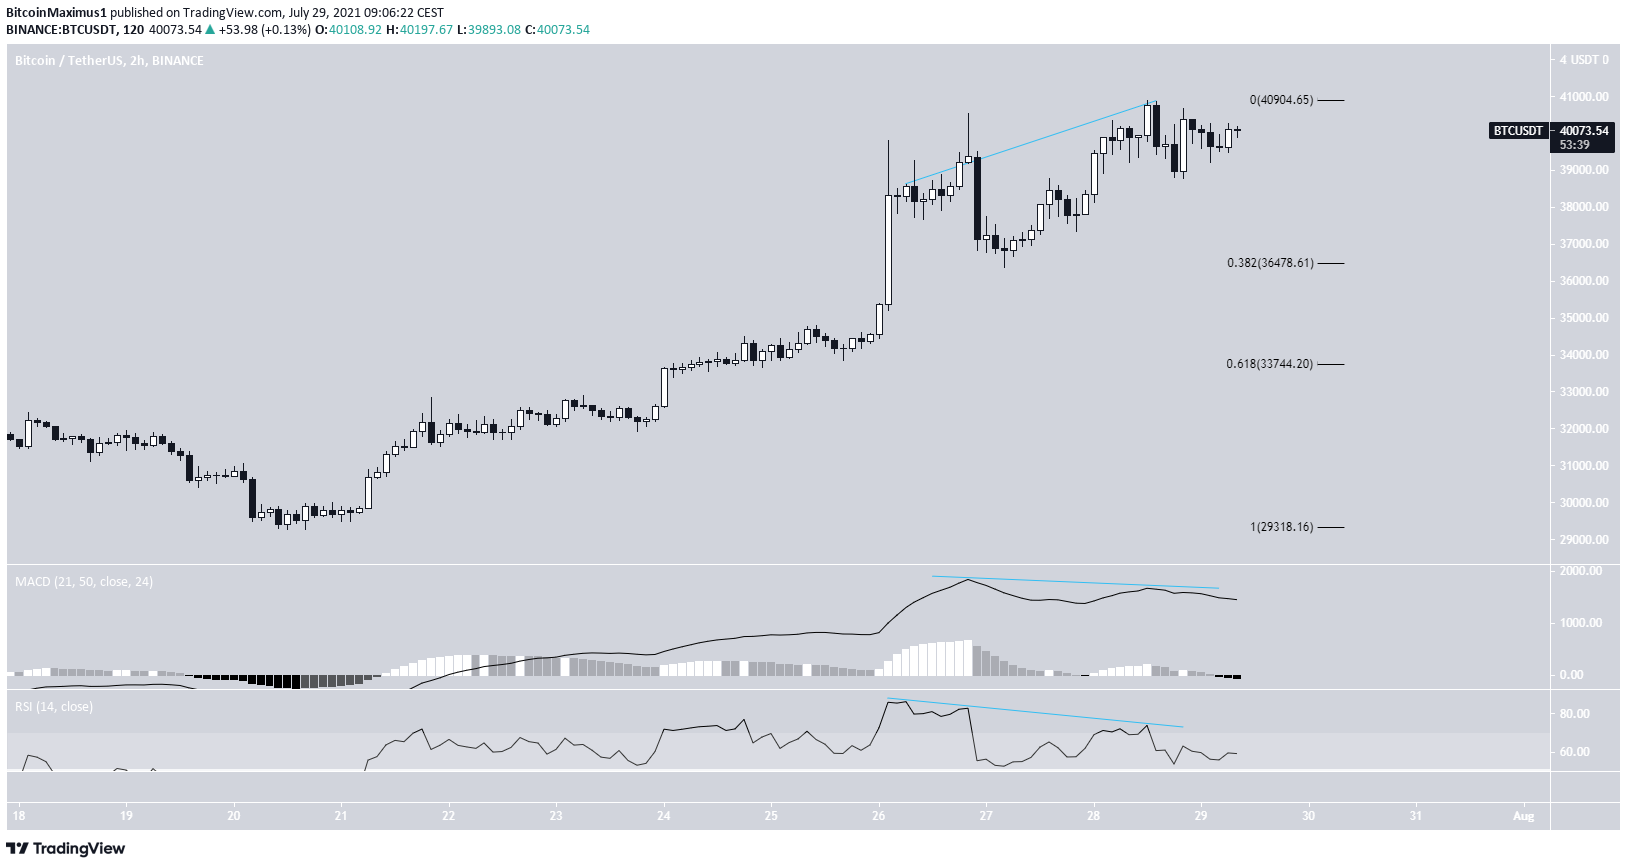
The two-hour chart shows even more pronounced weaknesses. Besides the RSI, the MACD has also generated a bearish divergence and its histogram has crossed into negative territory.
Therefore, this indicates that a downward move toward the previously outlined support levels is likely.

Wave count
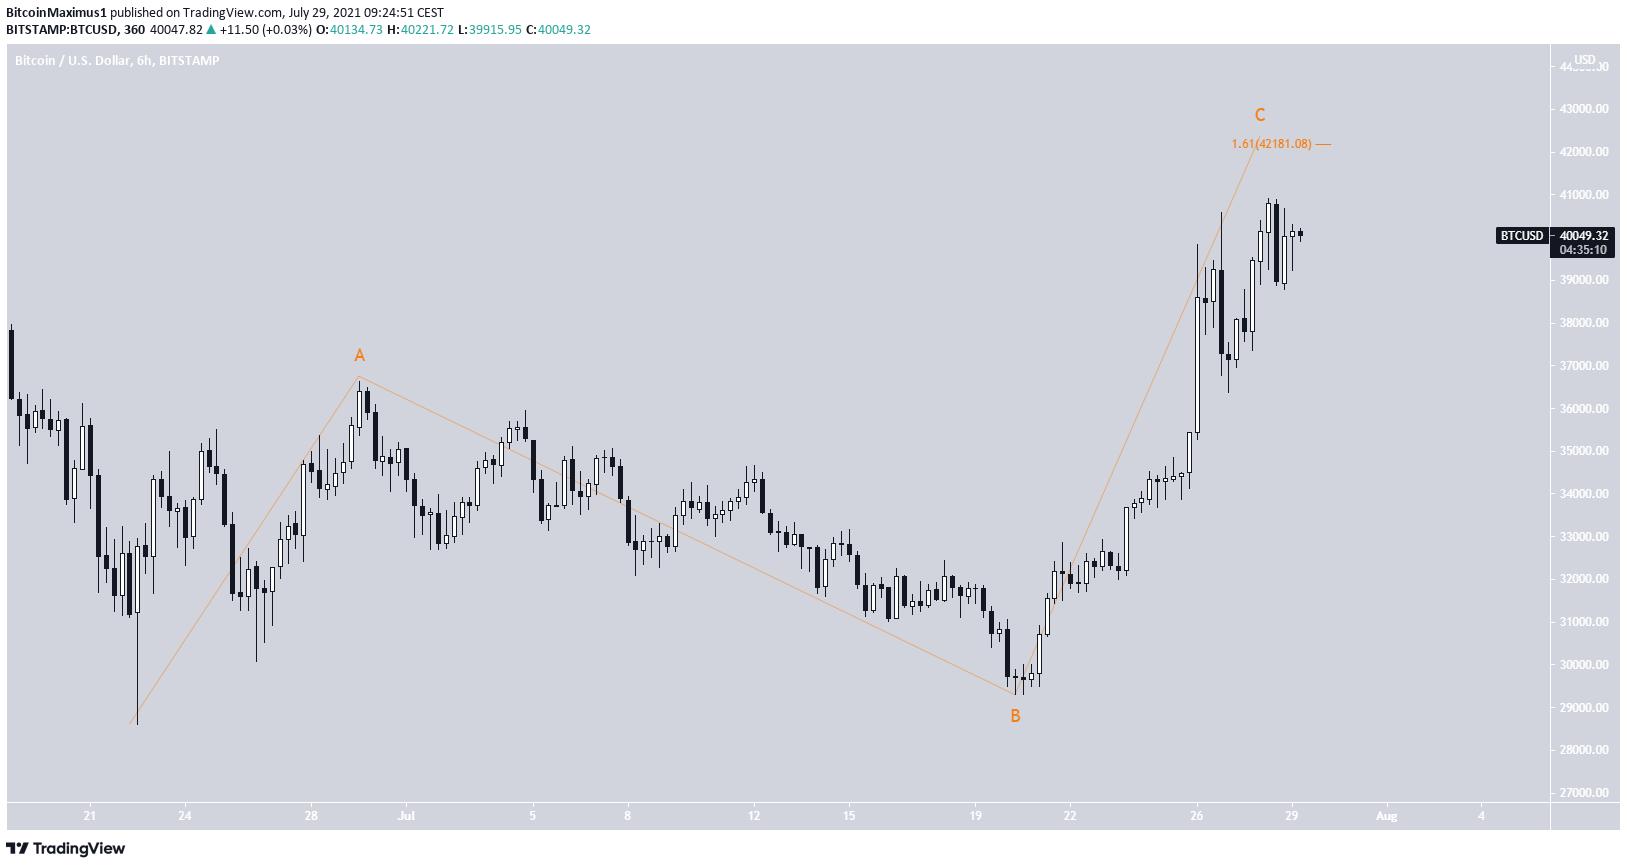
The wave count suggests that BTC is in wave C of an A-B-C corrective structure.
The most likely target for the top of the move is found at $42,181. This would give waves A:C a 1:1.61 ratio.

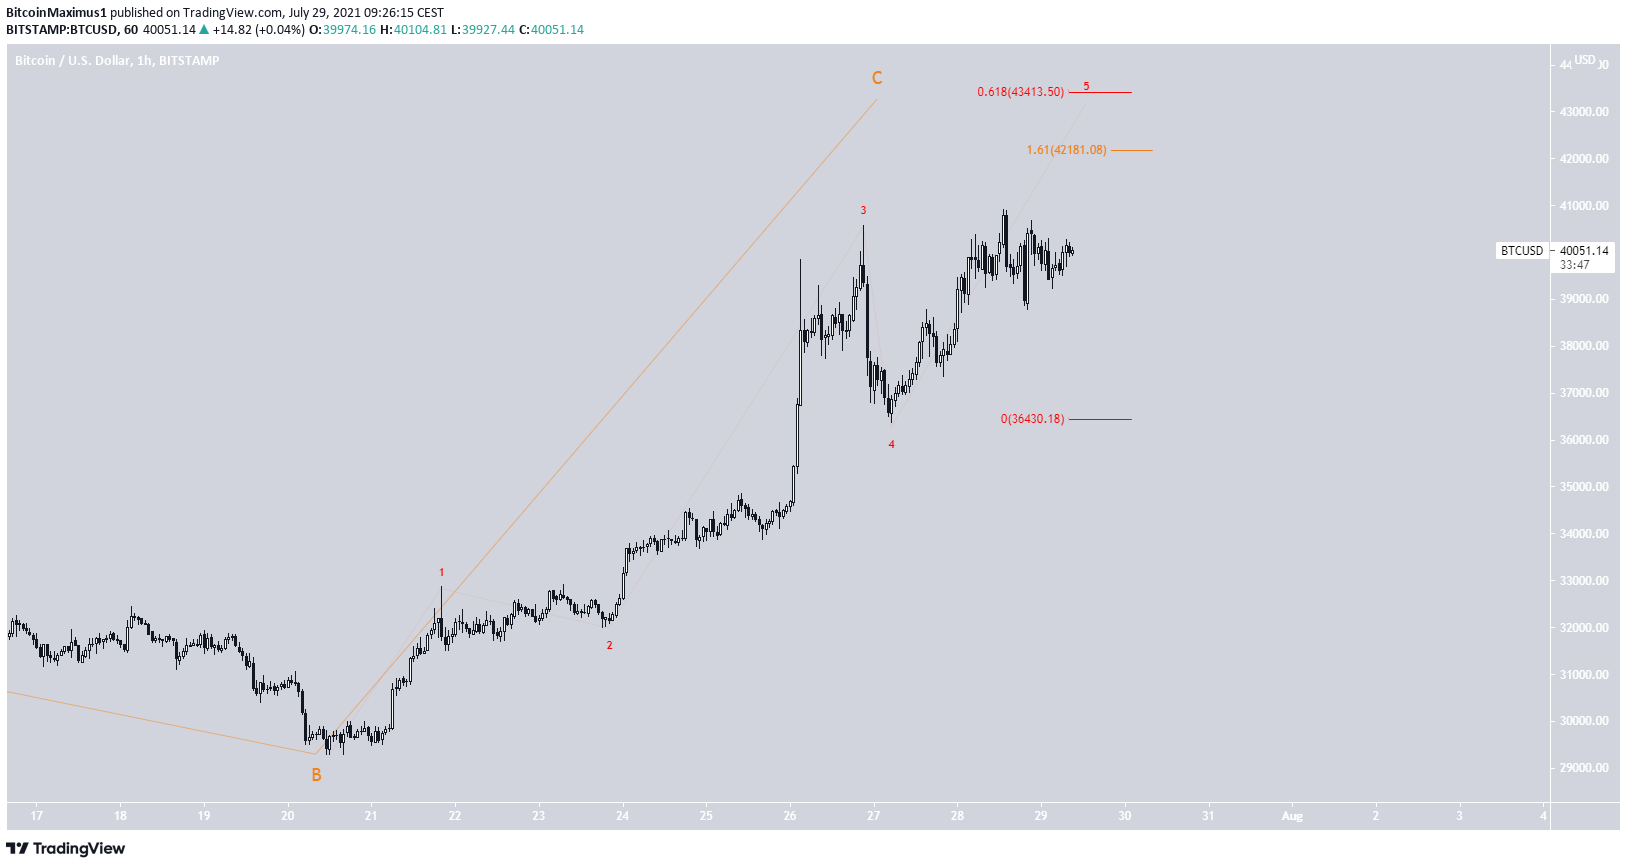
The sub-wave count is shown in red, suggesting that BTC is in sub-wave five.
Using a fib extension on waves 1-3, we get a slightly higher target of $43,413 for the top.

For BeInCrypto’s previous BTC (BTC) analysis, click here.
The post BTC (BTC) Makes Another Attempt at Clearing $40,000 appeared first on BeInCrypto.


