BTC, ETH, XRP, XVG, REP, BTG, HNT—Technical Analysis June 9
4 min readTable of Contents
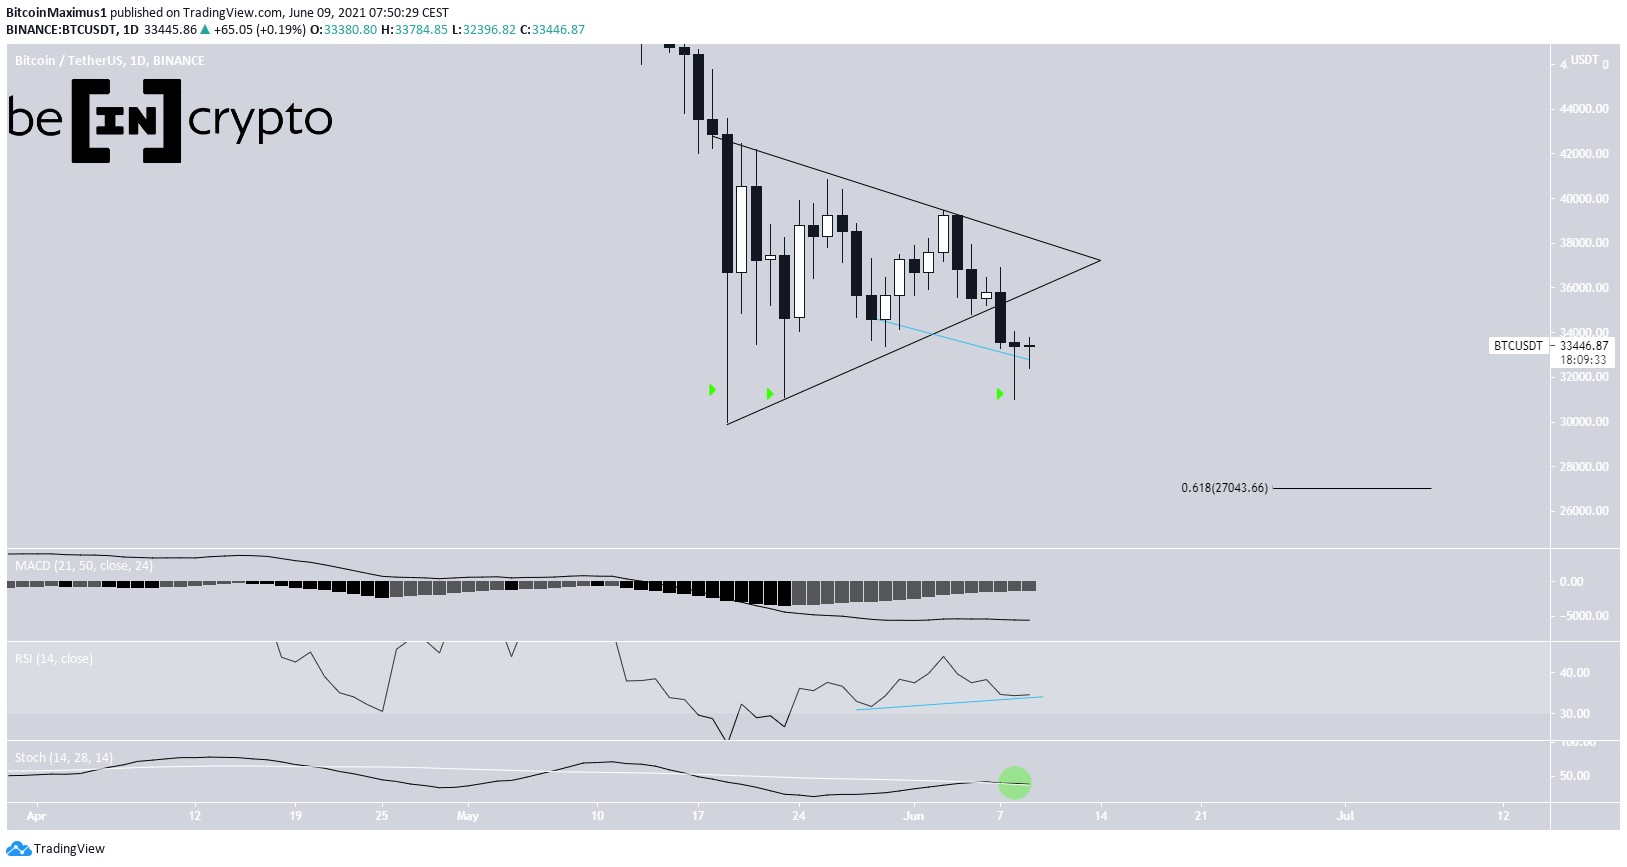
BTC (BTC) has broken down from a symmetrical triangle.
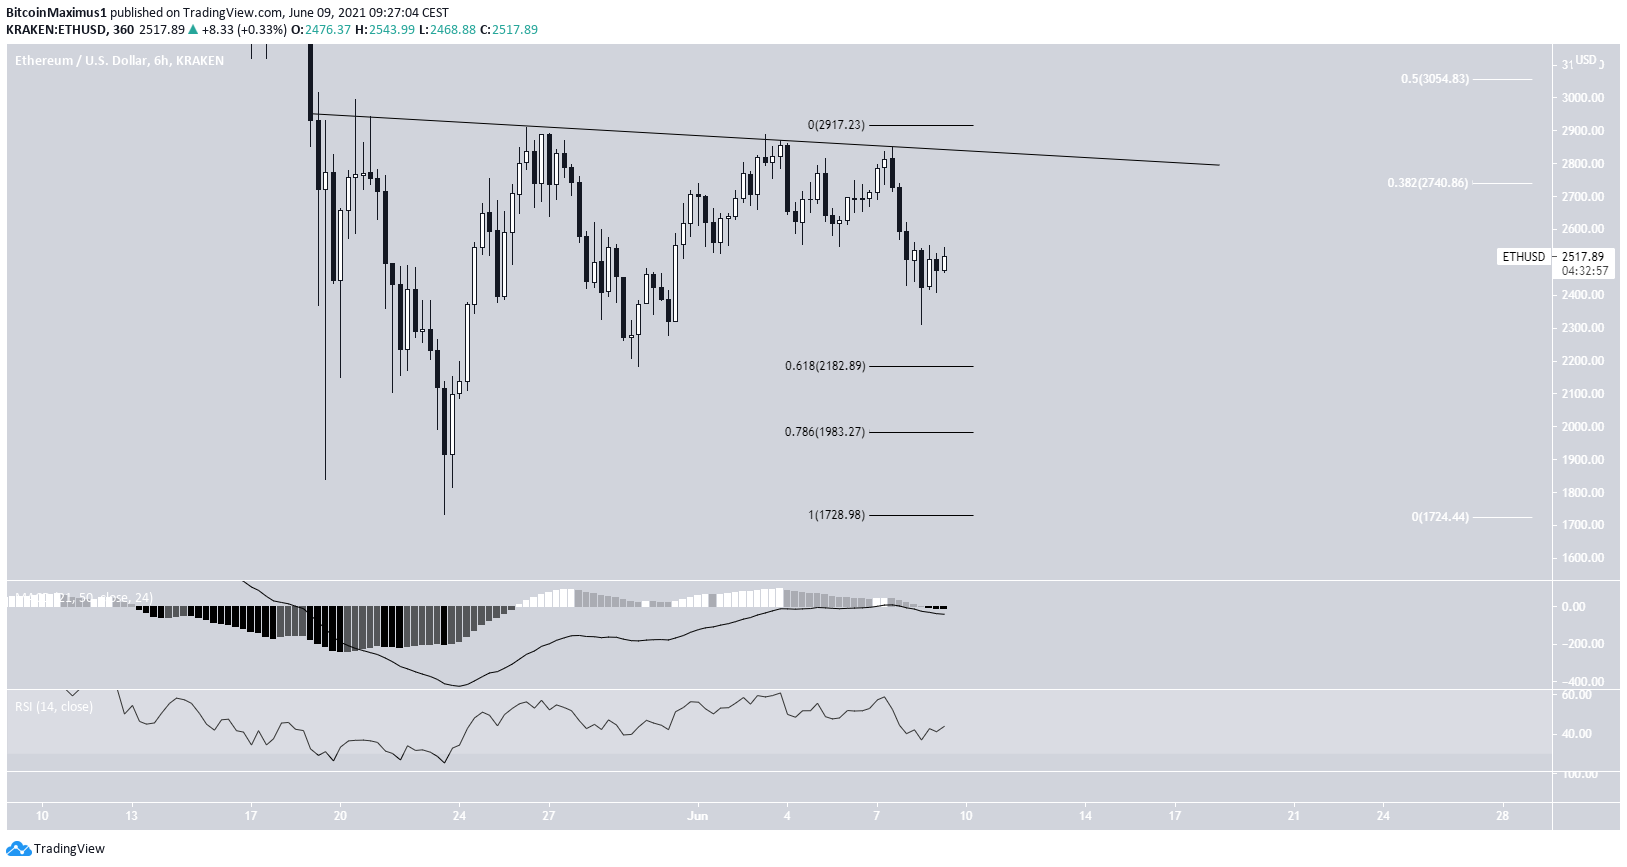
ETH (ETH) is following a descending resistance line.
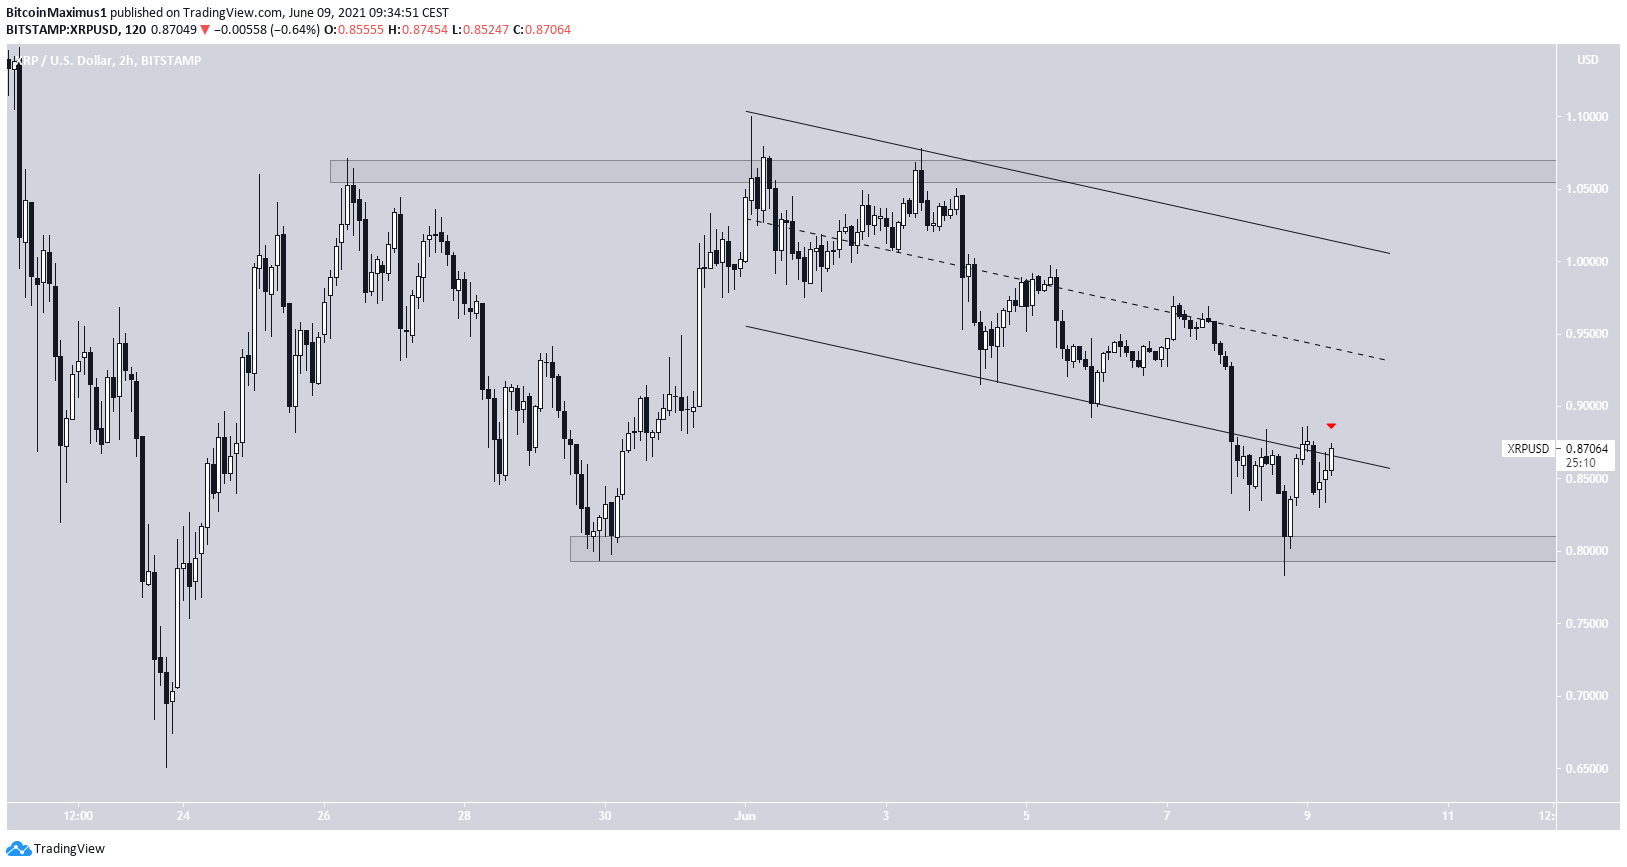
XRP (XRP) has broken down from a descending parallel channel.
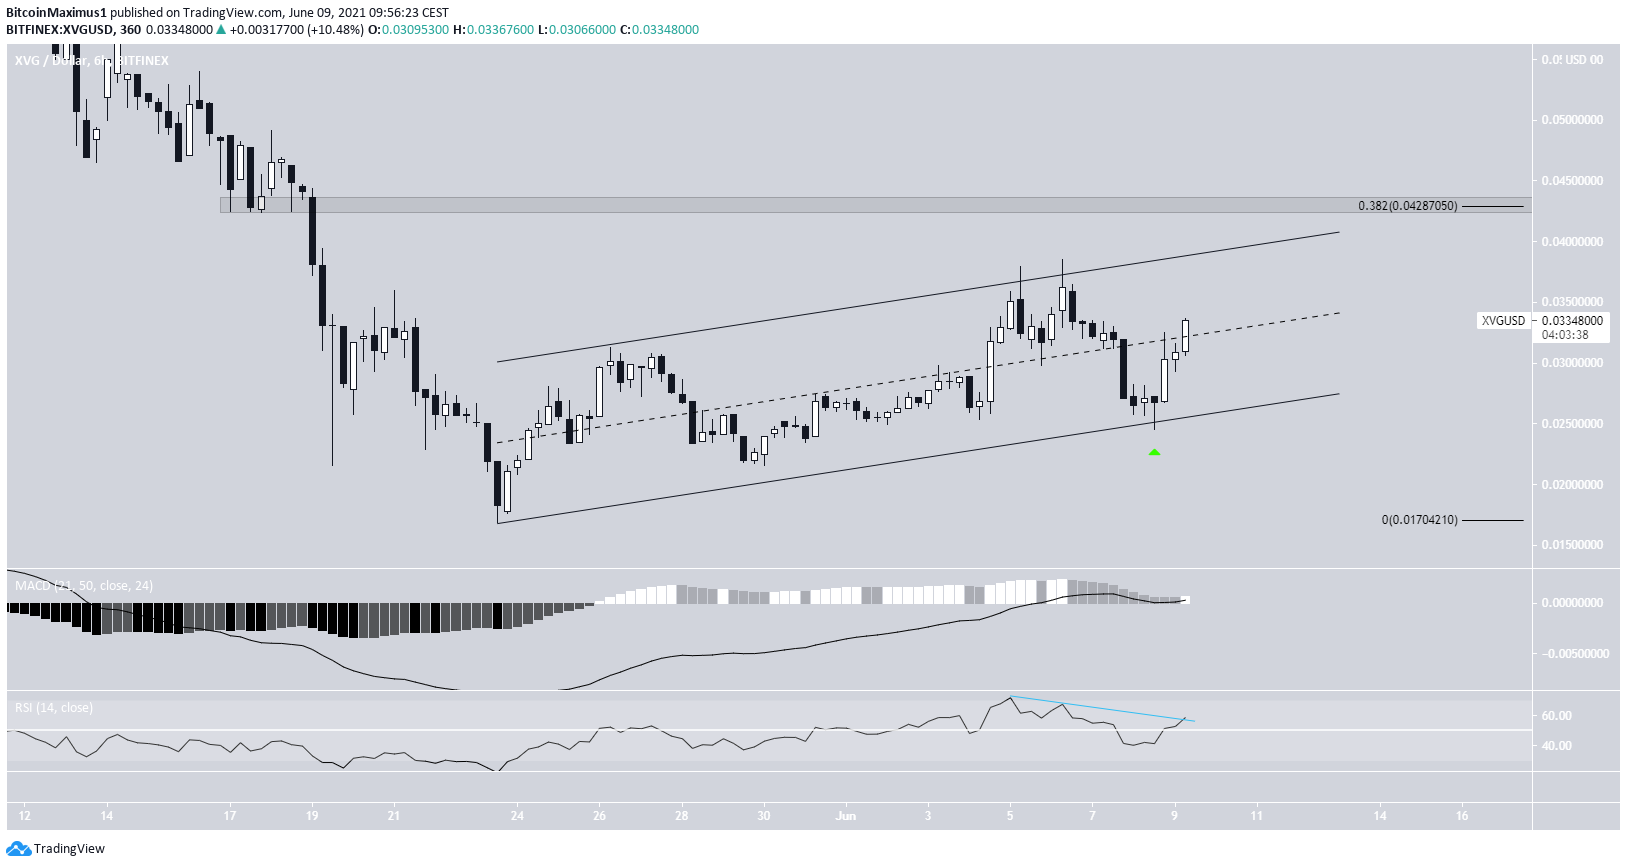
Verge (XVG) is trading inside a short-term ascending parallel channel.
Augur (REP) is following an ascending support line.
BTC Gold (BTG) has been rejected by the $72 resistance area.
Helium (HNT) has bounced at the $11.60 support area.
BTC
On June 7, BTC broke down from a symmetrical triangle and proceeded to reach its lowest close since Jan. 27. The next day, it reached a low of $31,000 before bouncing, creating a long lower wick (green icons) in the process.
There are some bullish reversal signs in place, such as a bullish divergence in the RSI. However, the Stochastic oscillator is close to making a bearish cross once again.
The closest support area is at $27,000, created by the 0.618 Fib retracement level.
In addition, the wave count provides a target between $24,200 and $22,100.
ETH
On May 23, ETH bounced at the $2,050 support area and proceeded to reach a high of $2,910. The high was made inside the 0.382-0.5 Fib retracement resistance level.
Currently, it’s following a descending resistance line. So far this resistance has been validated four times, most recently on June 7 (red icon).
ETH is currently decreasing, attempting to find support in order to create a higher low relative to that of May 23. However, both the MACD and RSI are bearish.
The closest support levels are found at $2,182 and $1,983. These are the respective 0.618 and 0.786 Fib retracement support levels.
XRP
XRP has been moving upwards since bouncing on May 23. It continued to increase until May 26, reaching a high of $1.07.
Since then, it has made two more attempts at breaking out above $1.05, both of which have been unsuccessful.
After the third-and-final rejection on June 3, XRP began to decrease inside a descending parallel channel. It broke down from this channel on June 7 and is in the process of validating it as resistance (red icons).
The main support area is at $0.80. A breakdown below this level could trigger a sharp drop towards the May 23 lows of $0.65.
XVG
XVG has been moving upwards since May 23. The upward movement has taken the shape of an ascending parallel channel, which is normally considered a corrective movement.
XVG bounced at the support line of the channel on June 8 and has been increasing since. Currently, it’s in the middle of the channel.
There is a strong resistance level at $0.0428. This target is the 0.382 Fib retracement resistance level.
Technical indicators are neutral/bearish. The MACD is positive but has lost strength and the RSI is above 50 but has generated a bearish divergence.
REP
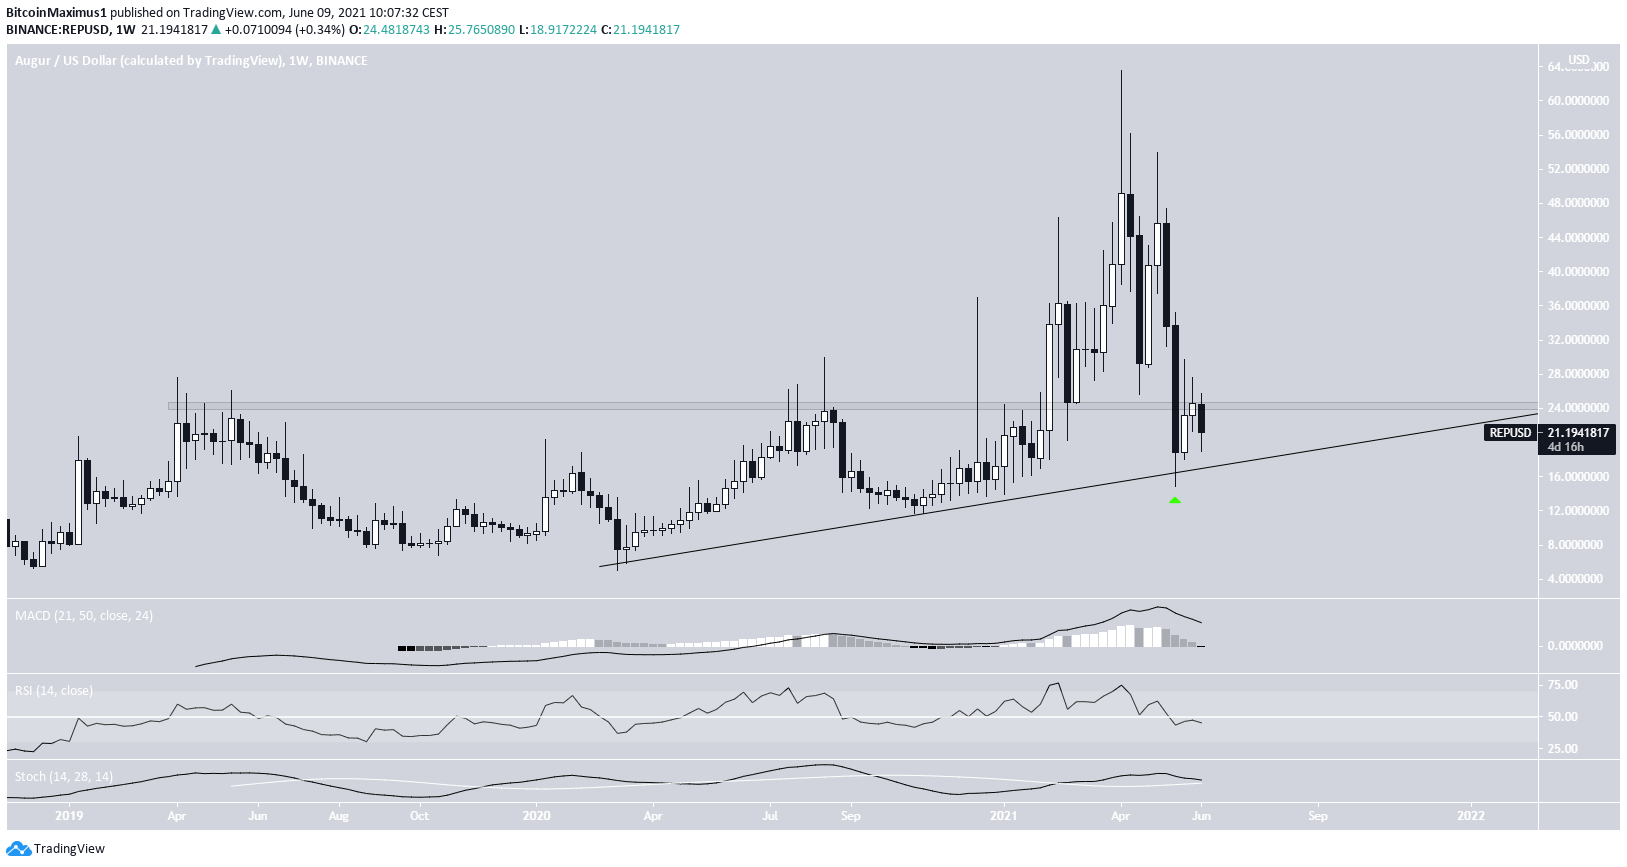
REP has been following an ascending support line since March 9. It touched this support in October 2020 before beginning a significant upward move that took it to a high of $63.53.
However, REP has been decreasing since April. On May 18, it fell below the $24.50 area, which was supposed to act as support. The same area is now acting as resistance.
However, the drop served to validate the long-term support line once more (green icon).
Technical indicators are at crucial levels. The MACD is close to turning negative and the Stochastic oscillator is close to making a bearish cross. Furthermore, the RSI has just fallen below 50.
Whether REP bounces at this support line and reclaims the $24.50 level or breaks down below it will likely determine the direction of the future trend.
BTG
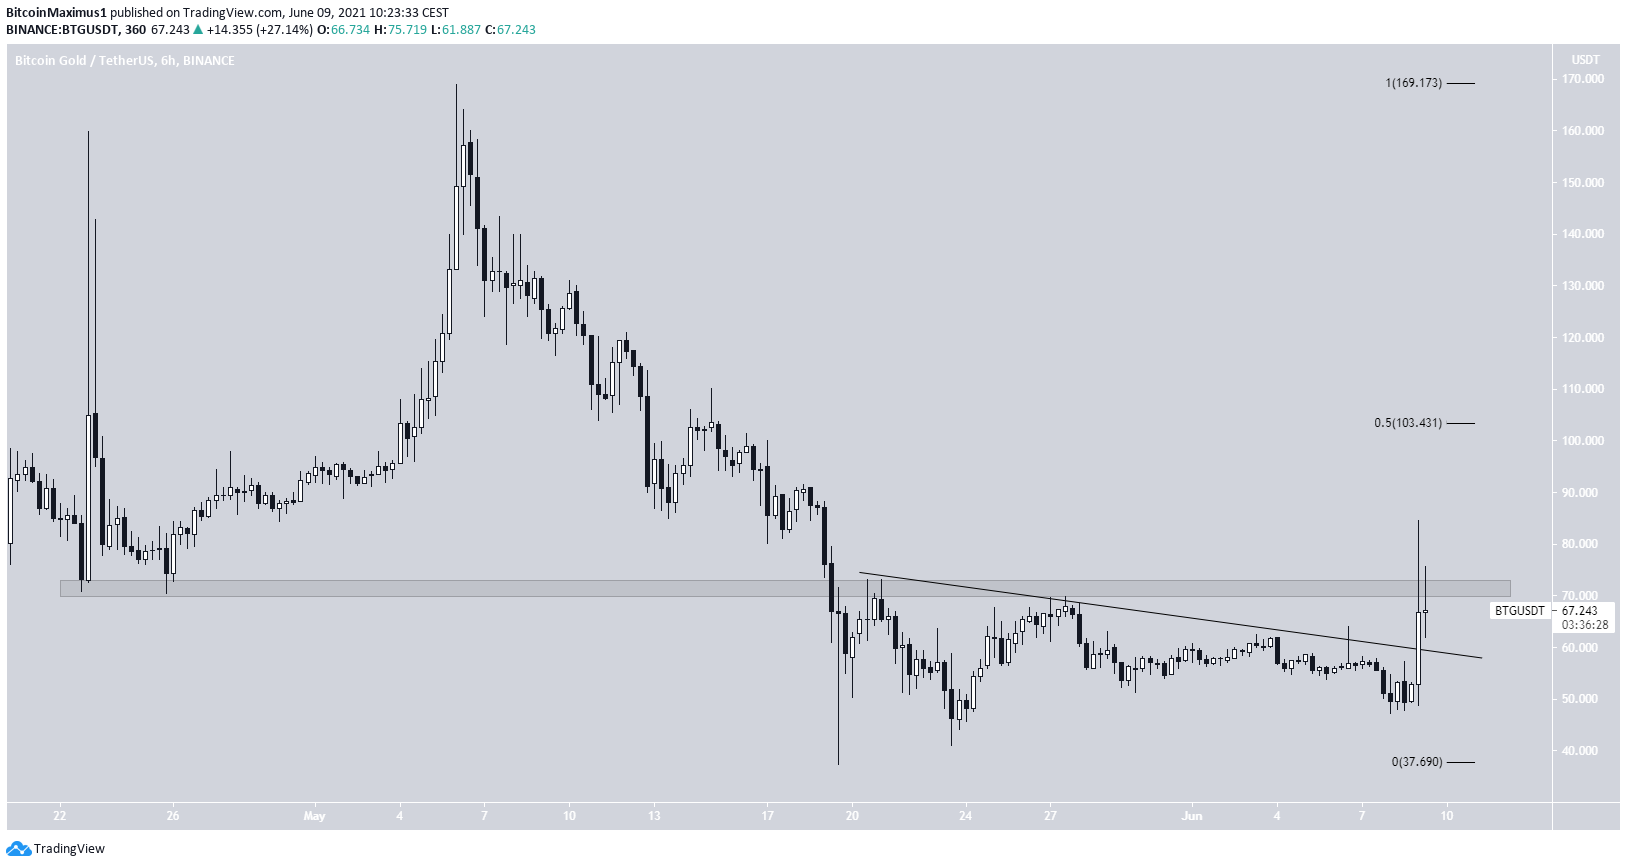
BTG has been following a descending resistance line since it was rejected by the $72 resistance area on May 20.
It was rejected multiple times by this line until it finally broke out on June 8.
Despite the breakout, BTG was rejected by the $72 area once again. Until it manages to break out above this level, we cannot consider the trend bullish.
If it’s successful in breaking out, the next resistance would be found at $103. This target is the 0.5 Fib retracement level.
HNT
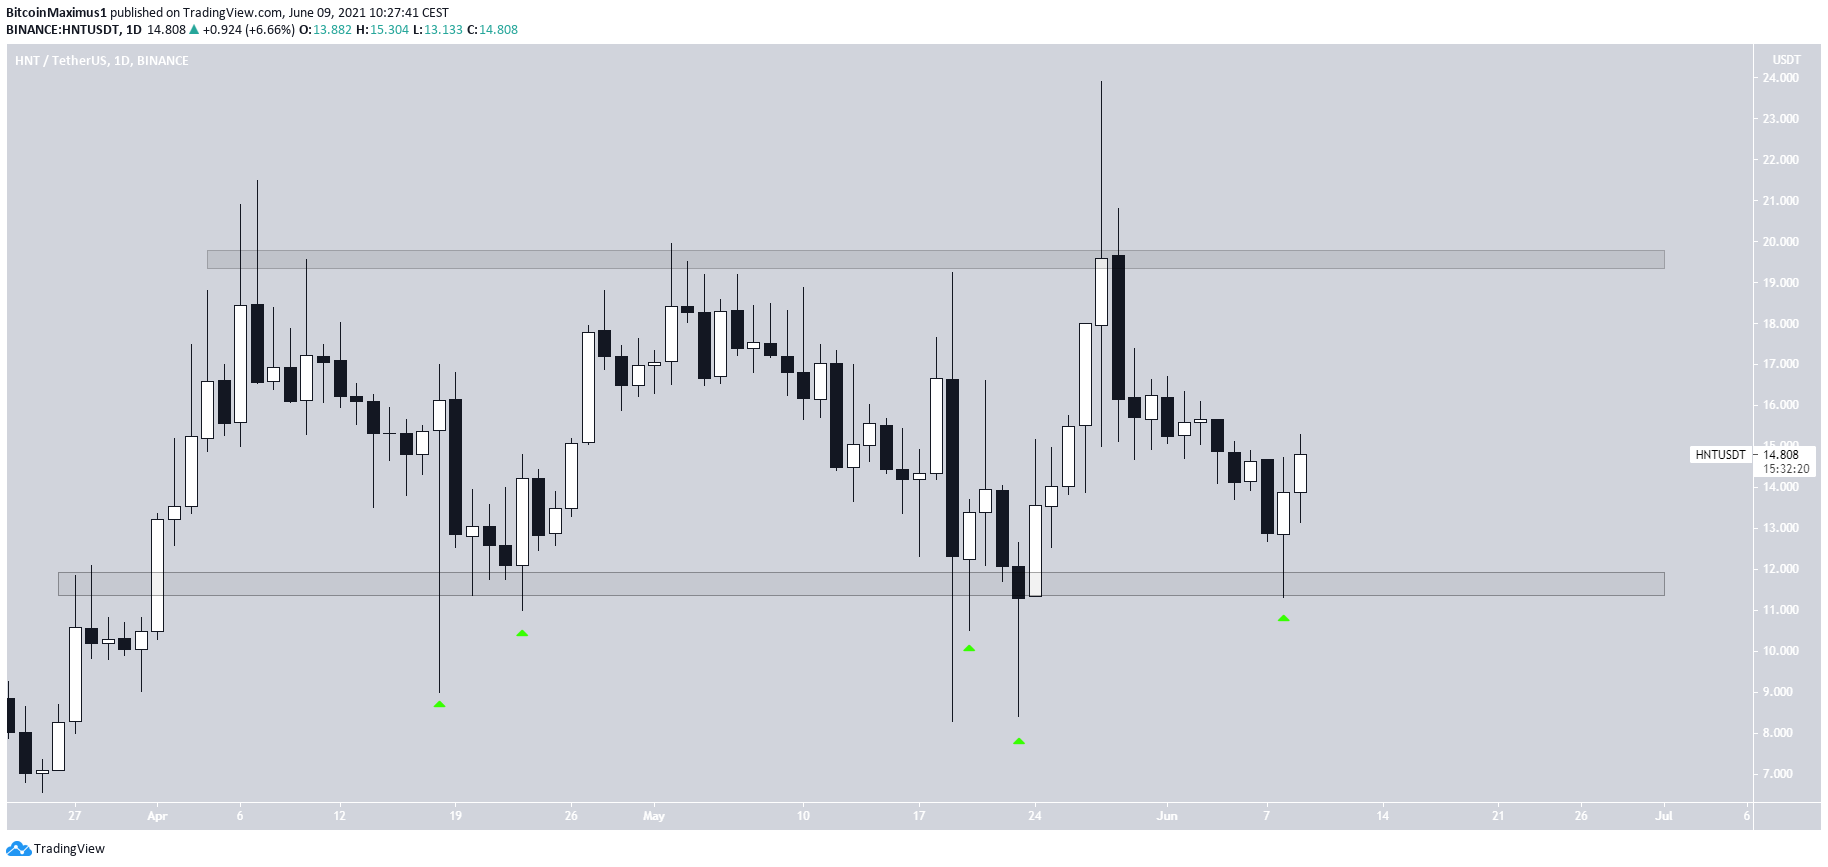
HNT has been decreasing since reaching an all-time high price of $23.90 on May 28.
The decrease took it back to the $11.60 support area, validating it for the fifth time, and created a long lower wick in the process. The same area previously acted as resistance prior to the all-time high.
The closest resistance level is found at $19.60.
For BeInCrypto’s latest BTC (BTC) analysis, click here.
The post BTC, ETH, XRP, XVG, REP, BTG, HNT—Technical Analysis June 9 appeared first on BeInCrypto.


