BTC On-Chain Analysis: ASOL and CDD Show No Change in Holder Behavior
2 min readBeInCrypto has taken a look at on-chain metrics for BTC (BTC), and ETH (ETH).
More specifically, Coin Days Destroyed (CDD) and Average Spent Output Lifespan (ASOL) are analyzed in order to determine the age of coins that are being moved.
ASOL
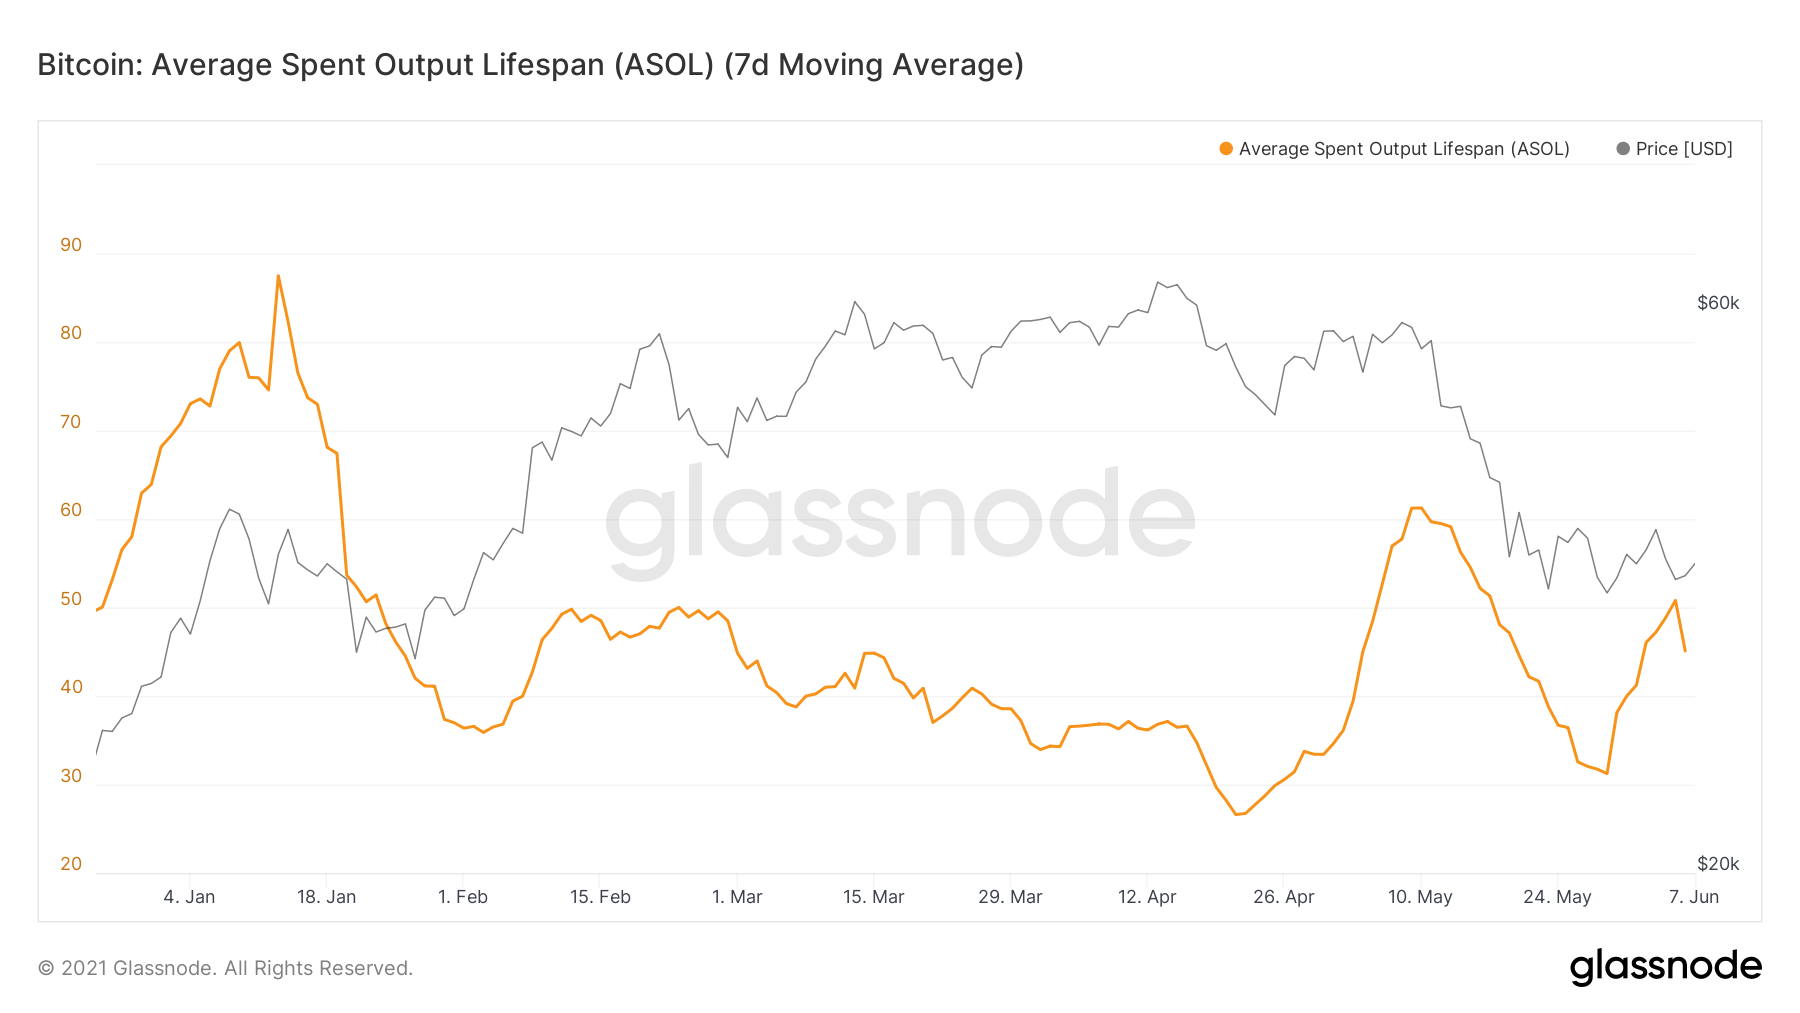
Average Spent Output Lifespan (ASOL) is an indicator used to measure the average age of each transaction. The value is shown as the average age (in days) of each transaction, disregarding those that have a lifespan below one hour.
A seven day moving average is used in order to smooth the values and reduce the effect of outliers.
The yearly high for ASOL was reached on Jan. 23, with a value of 87.4. This means that the average age of each transaction was 87.4 days.
On May 9, prior to the drop, ASOL spiked to 61.25, creating a lower high relative to the Jan. 23 value. Afterwards, it created another lower high of 50.8 on June 5.
As a result of this, we can come to the conclusion that fewer old coins are being spent when comparing to the beginning of the year.

This is also visible when looking at the supply held by short-term (purple) and long-term holders (green).
Since the beginning of May, the former has been moving downwards while the latter has been moving upwards.

CDD
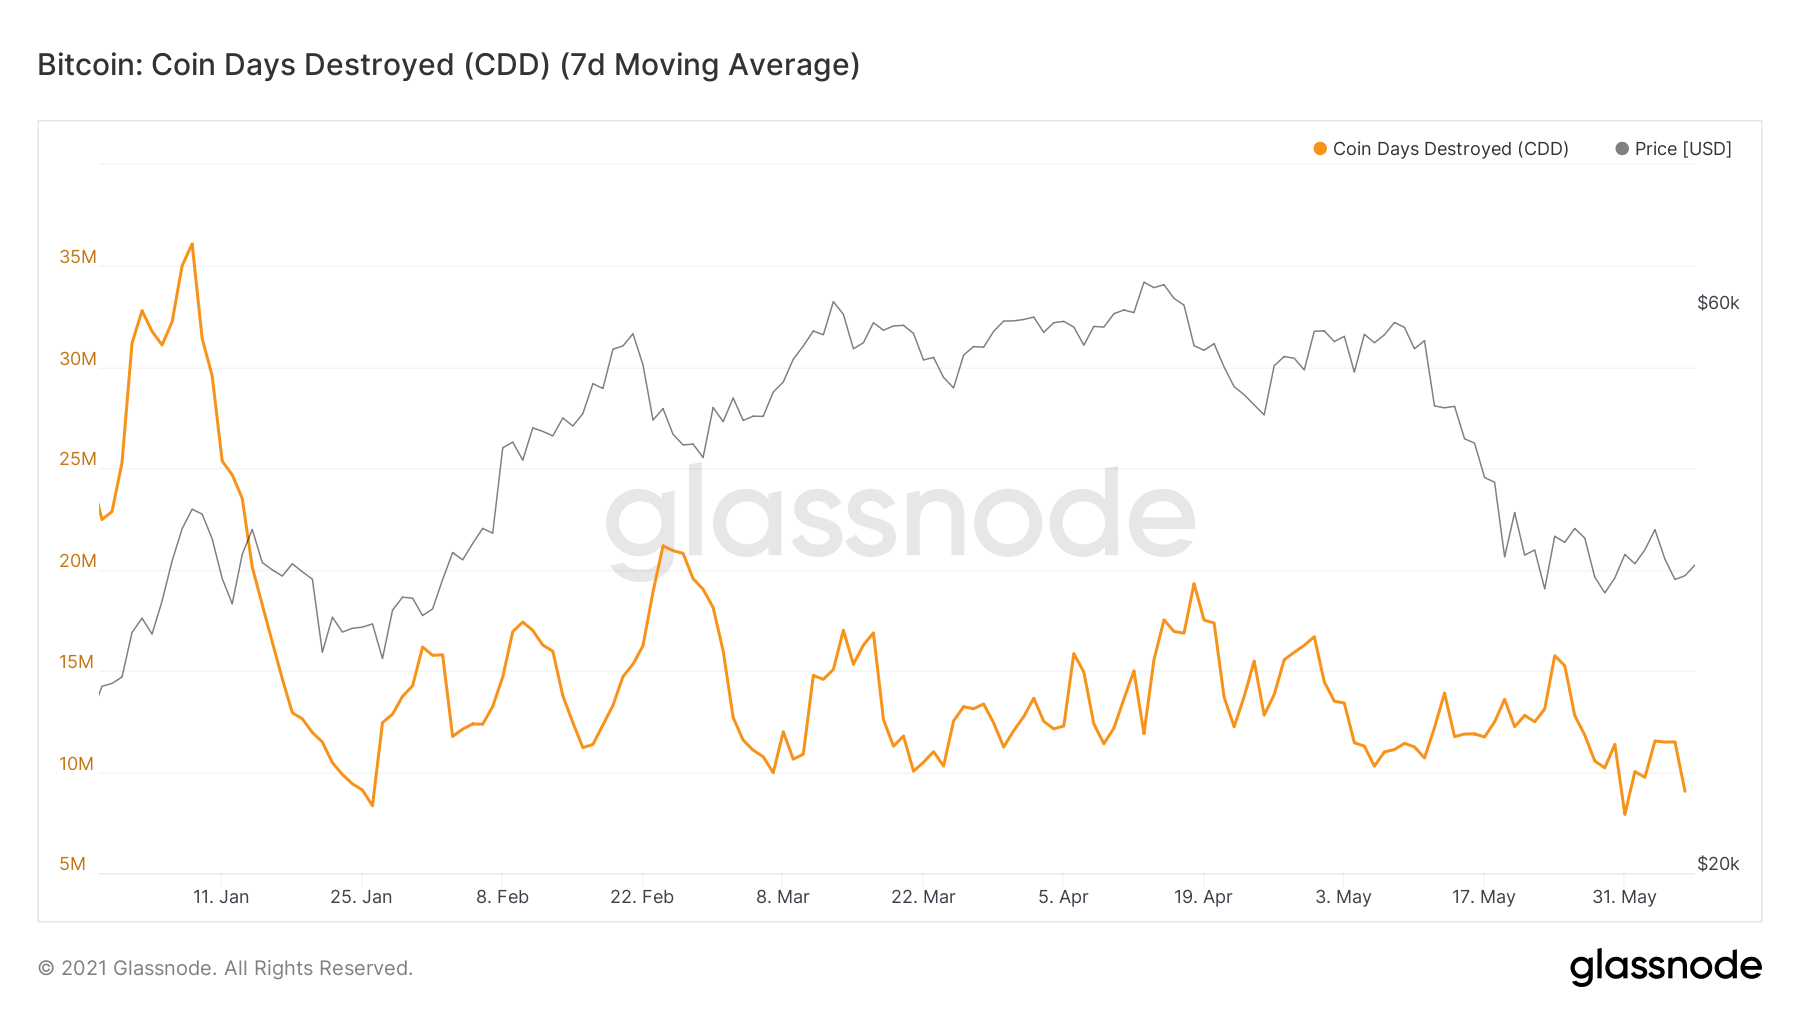
CDD measures the number of days a coin is unspent before a transaction occurs. So, for each day that a coin remains unspent, it accumulates one “coin day.” After a transaction occurs, the coin days are destroyed.
Therefore, the indicator value measures the total amount of coin days that are destroyed on a certain day.
Similarly to ASOL, CDD peaked on Jan. 8, with a value of 36,100,616. Since April, it has reached three lower highs, on April 18, May 24 and June 5. Between them it has also reached a yearly low of 7,896,594, doing so on May 31.
Therefore, similarly to ASOL, it shows that the amount of old coins being spent is constantly decreasing.

ETH ASOL
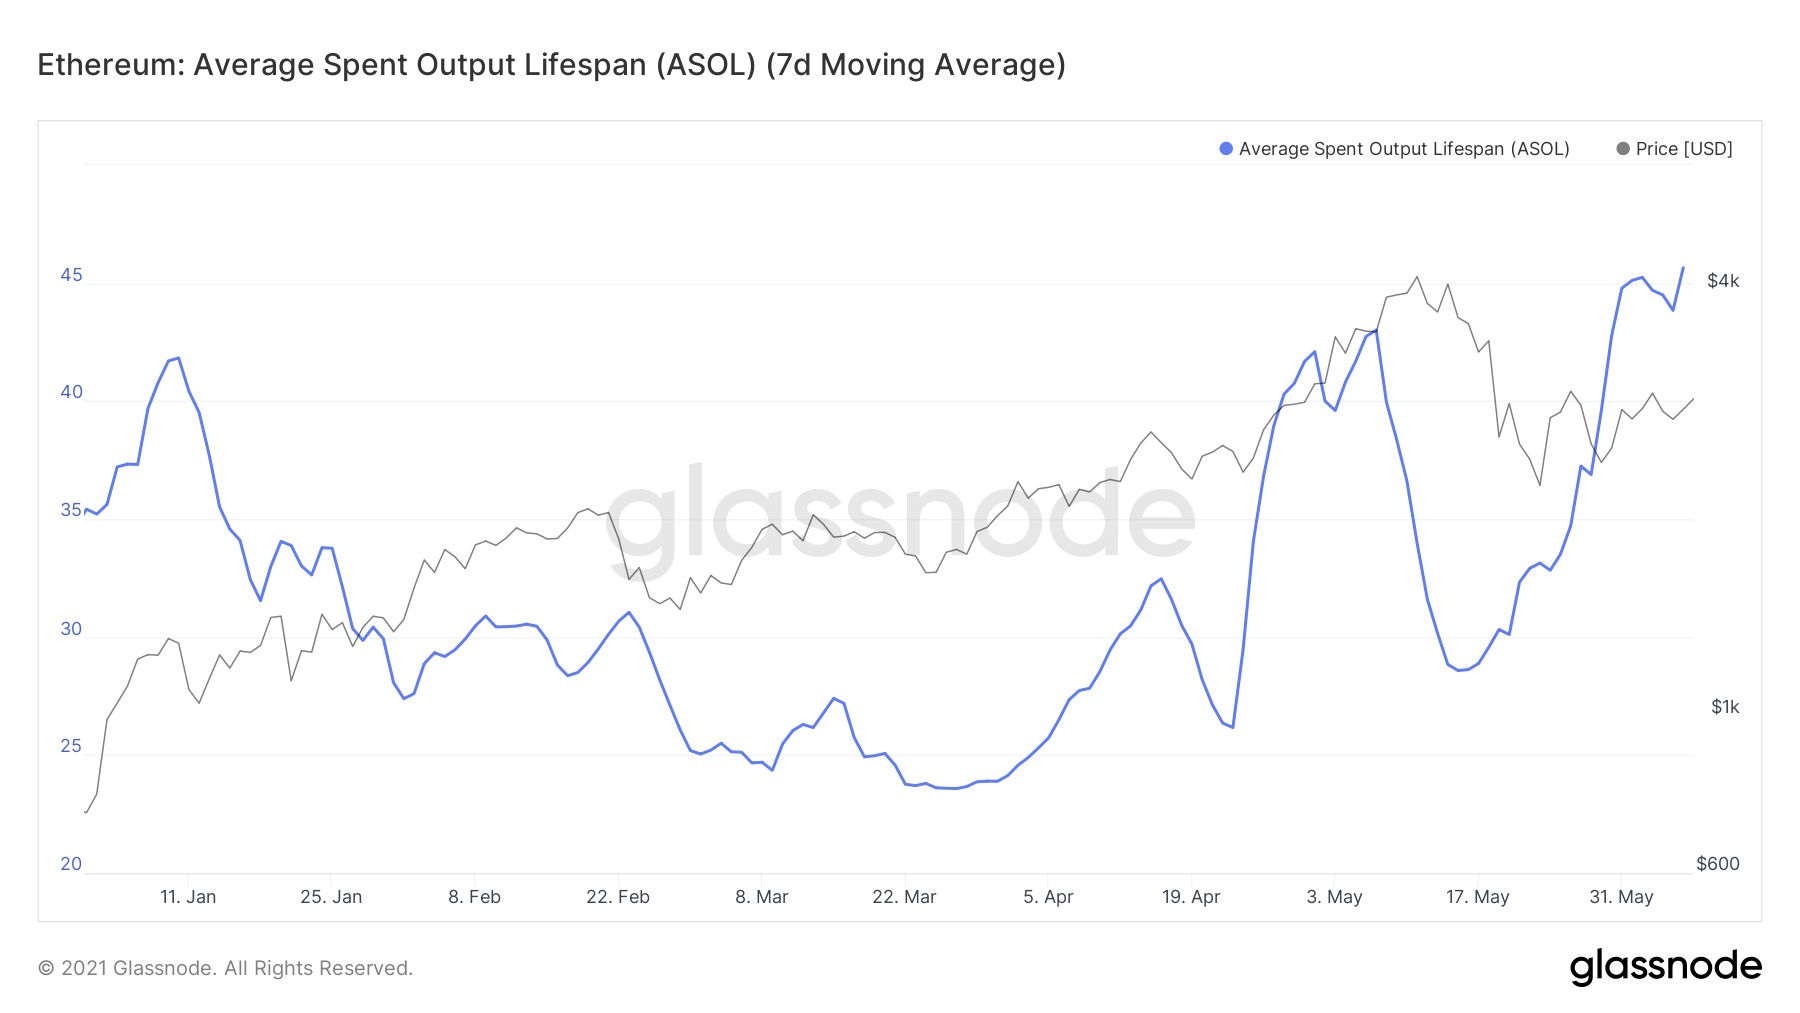
The ASOL data for ETH is very dissimilar to that of BTC. On June 6, it reached a new yearly high of 46.64.
Interestingly, this is considerably higher than the May 7 spike, which occurred just prior to the all-time high price.
Therefore, unlike BTC, the average age of transaction is at a yearly high for ETH.

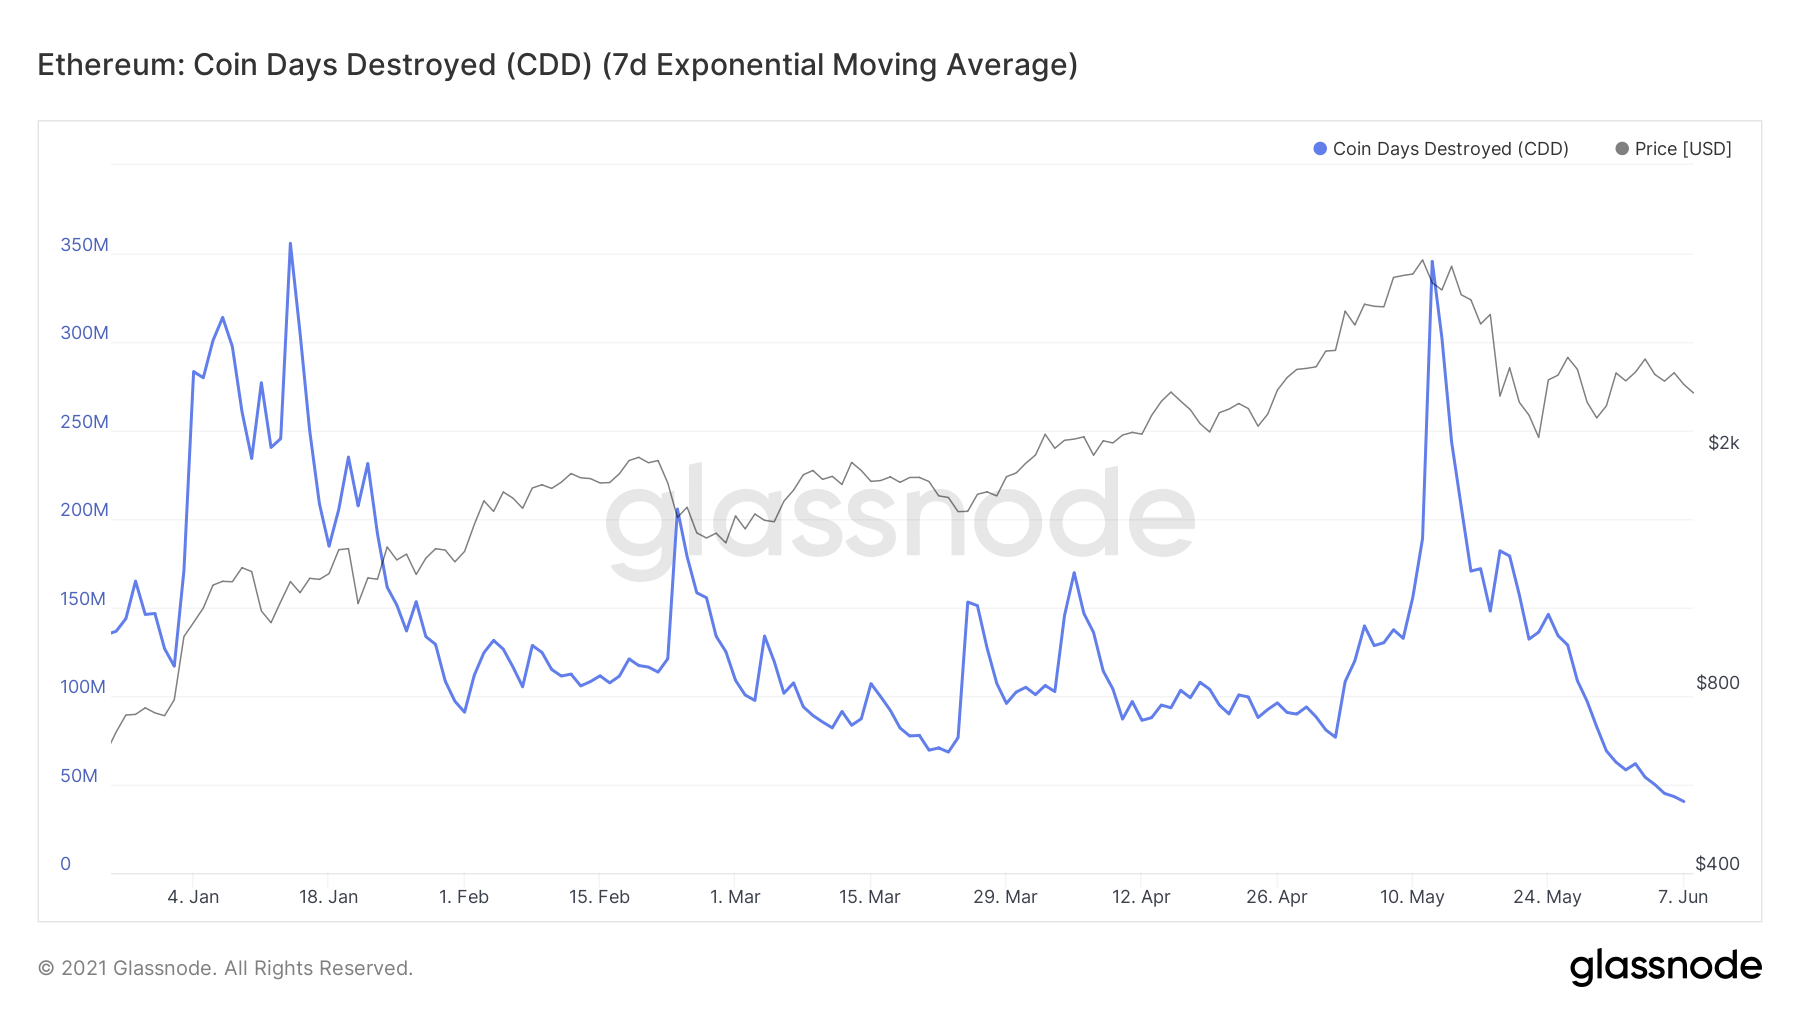
On the other hand, while CDD is near a yearly low, it spiked considerably on May 10.
The stark difference between ASOL and CDD shows that while the average age of transactions is high, the total number of transactions is not very significant.

For BeInCrypto’s latest BTC (BTC) analysis, click here.
The post BTC On-Chain Analysis: ASOL and CDD Show No Change in Holder Behavior appeared first on BeInCrypto.


