FIL, HOT, OCEAN — Storage Tokens Aim to Create Bullish Structures
3 min readFilecoin (FIL) has been following a descending resistance line since reaching an all-time high price on April 1.
Holo (HOT) has broken out from a descending resistance line. Afterwards, it managed to reclaim the $0.007 support area.
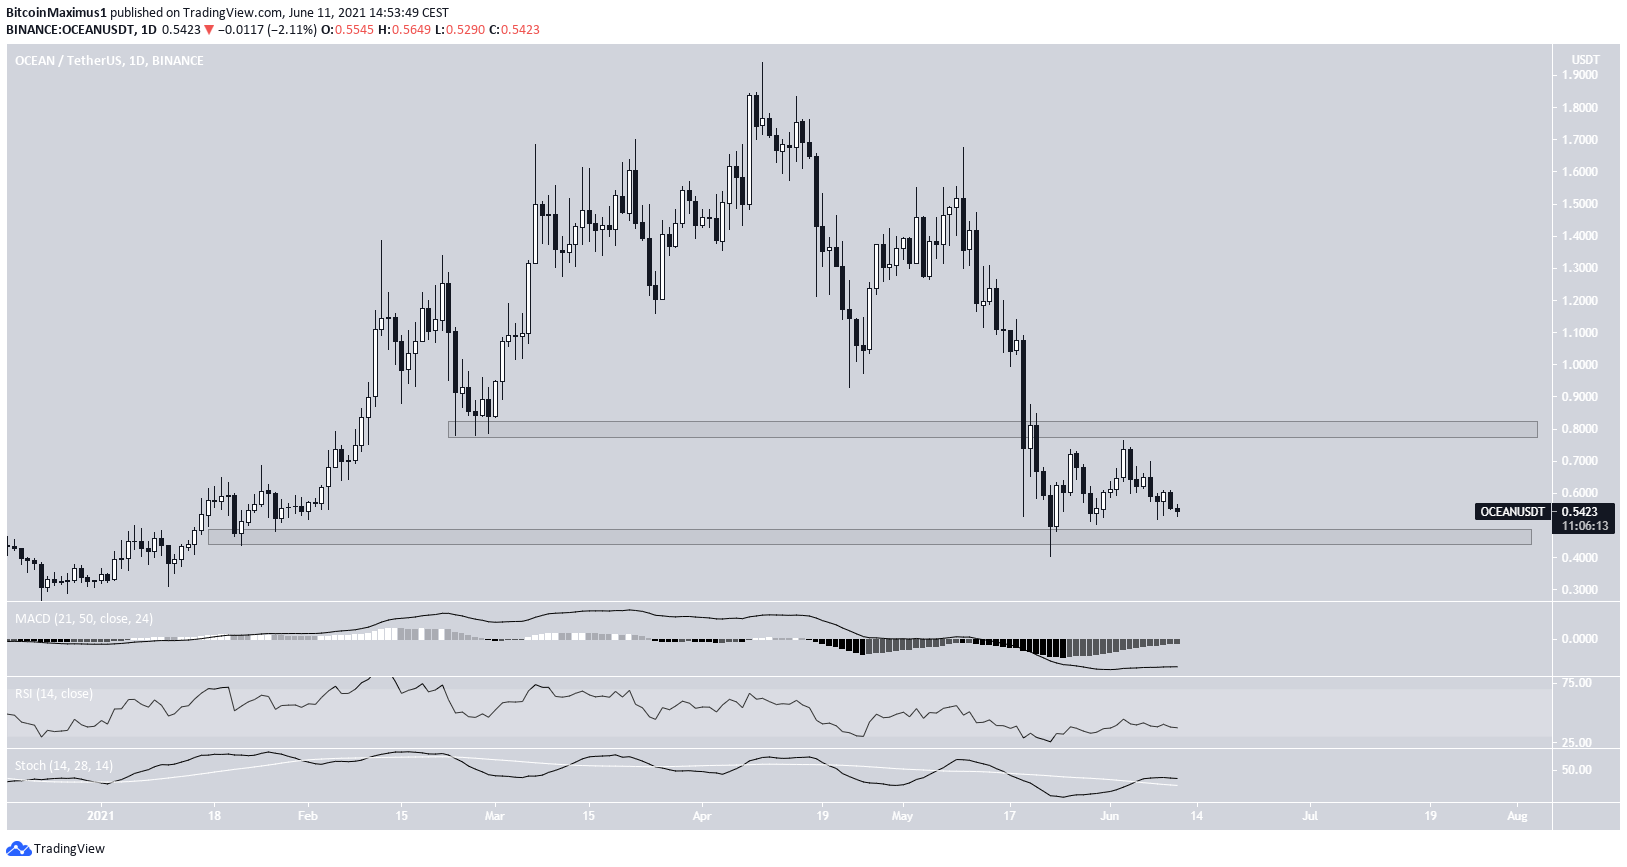
Ocean Protocol (OCEAN) is trading inside a range between $0.45 and $0.80.
FIL
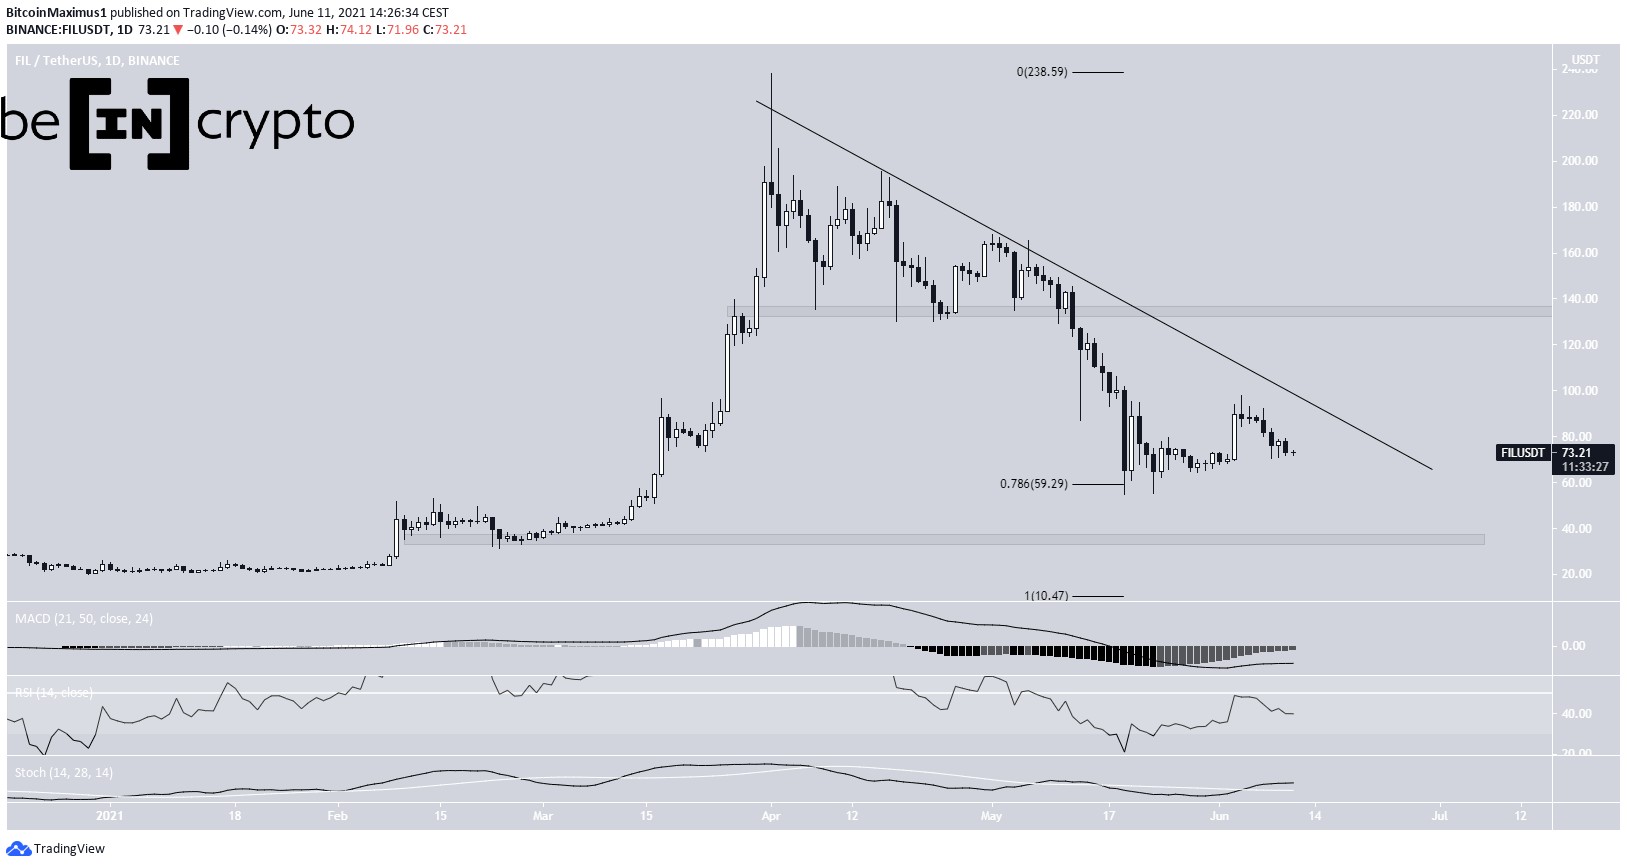
FIL has been following a descending resistance line since reaching an all-time high price of $238.2, on April 1. So far, it has reached a low of $55, doing so on May 19. The low was made right at the 0.786 Fib retracement support level of $59.
While FIL has been increasing since, the bounce has been weak and has failed to even reach the previously mentioned descending resistance line. Until it manages to break out, the trend cannot be considered bullish.
Technical indicators are providing bullish signs, but not enough to confirm the bullish reversal. The RSI is still below 50 and the MACD is not yet positive.
A breakdown would take FIL towards the next support area of $34. Conversely, a breakout would take to the next resistance area of $135.
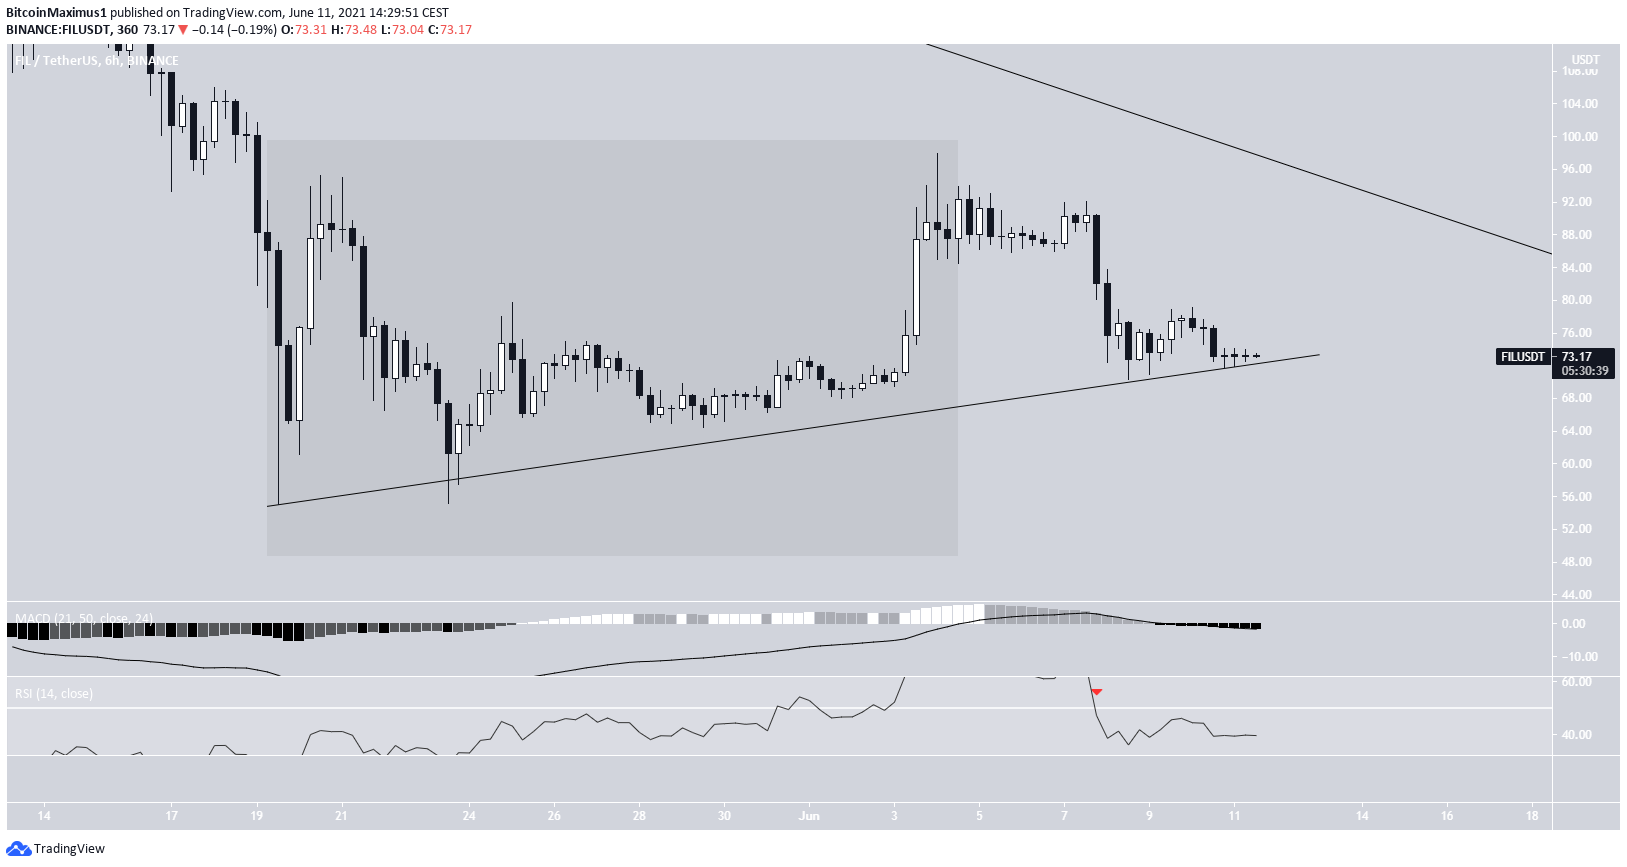
The shorter-term six-hour chart shows an ascending support line in place since the aforementioned May 19 low. However, the bounce following the low looks like a three wave structure, instead of a five wave one.
Therefore, it is possible that it is corrective, meaning that the low has not yet been reached. Therefore, a breakdown from the line would take FIL towards the previously outlined support area at $34.
Technical indicators in the six-hour time-frame support this possibility, since the RSI has fallen below 50 (red icon) and the MACD is negative.
Highlights
- FIL is following a descending resistance line.
- There is support and resistance at $59 and $135, respectively.
HOT
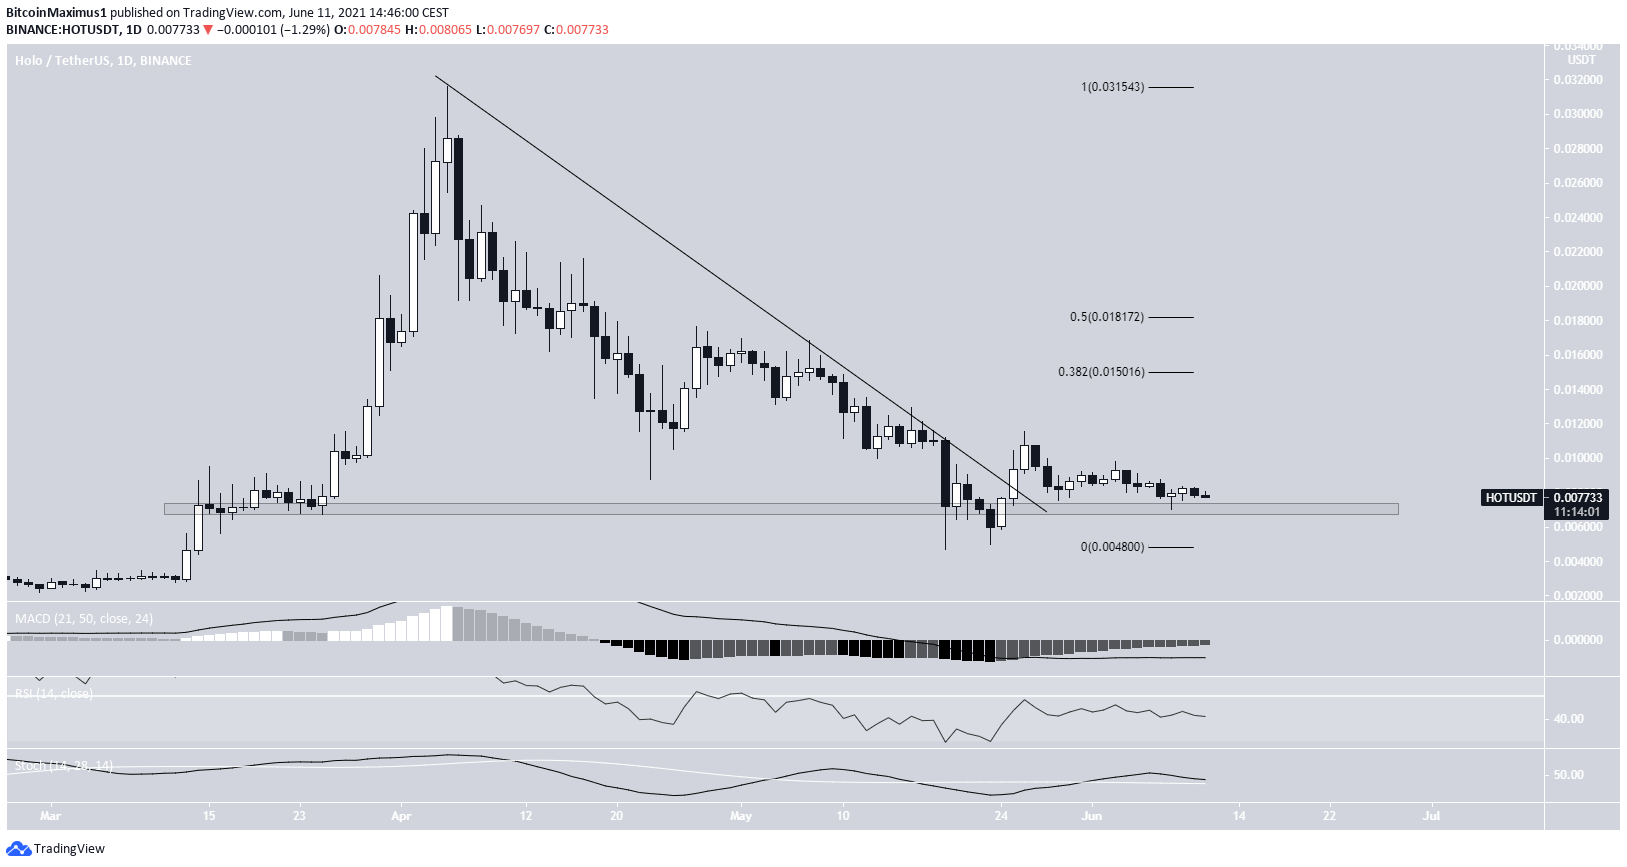
Since April 5, HOT had been following a descending resistance line. After three unsuccessful breakout attempts, it managed to move above it on May 25.
However, it has been decreasing since. Despite the decrease, it is still trading above the $0.007 support area, attempting to create a higher low. Doing so would be the first step increasing a bullish structure and moving towards the next closest resistance area at $0.015, the 0.382 Fib retracement resistance level.
However, technical indicators provide a very neutral picture. The MACD is increasing but is not positive. The RSI is below 50, and the Stochastic oscillator has a neutral slope.
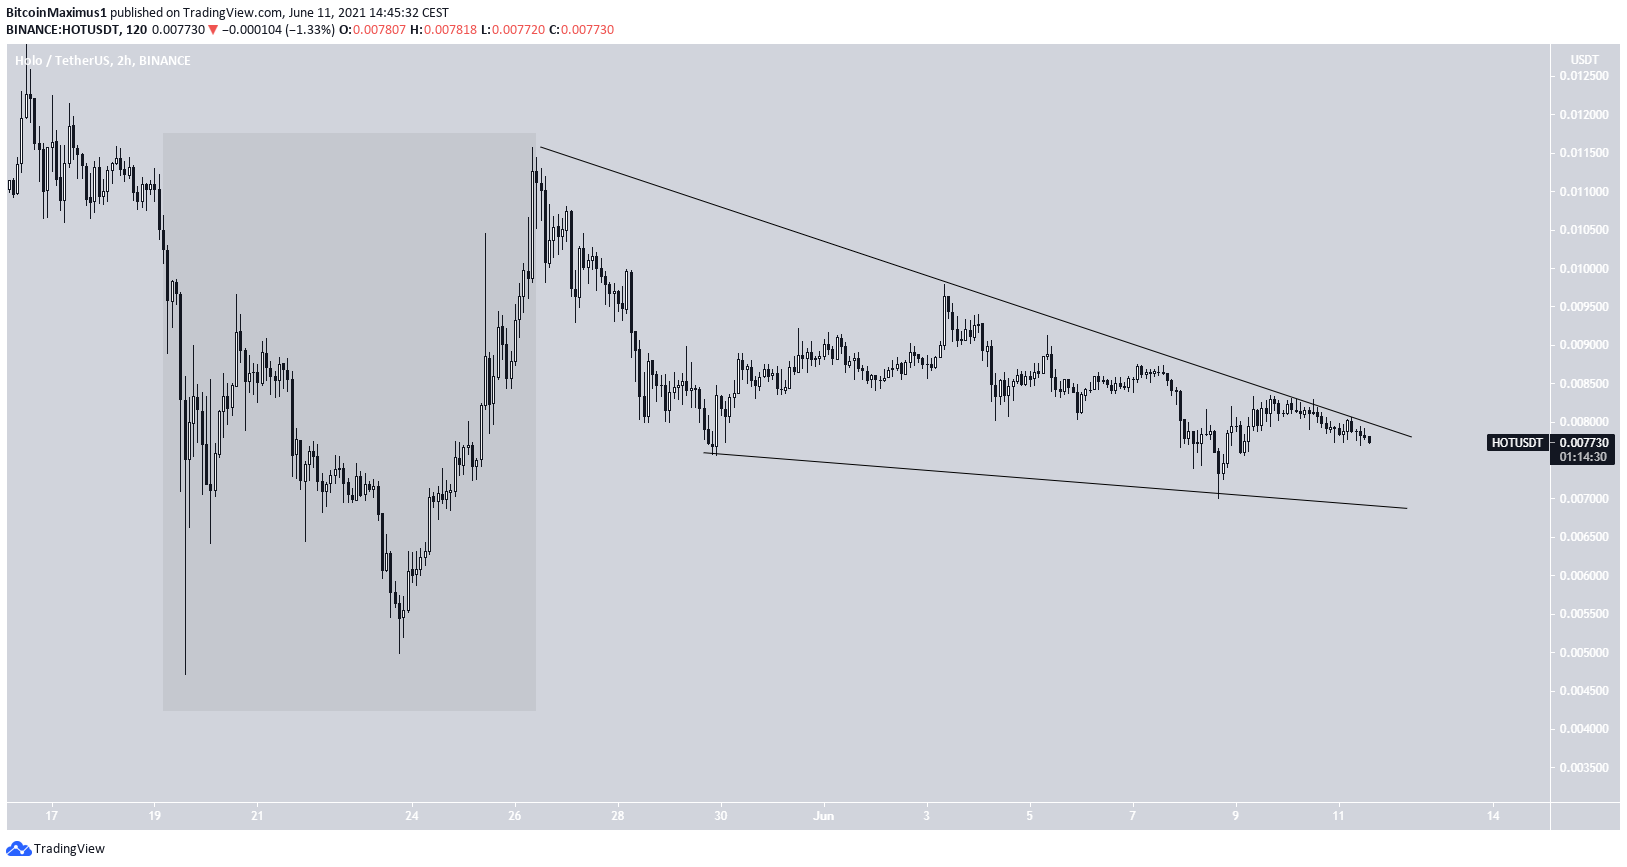
The shorter-term chart shows a descending wedge, which is considered a bullish reversal pattern. Therefore, a breakout from it would be expected.
Nevertheless, the preceding upward movement is a three wave structure, instead of a five wave one. As a result, it is unlikely that HOT has already reached its bottom. So, while a breakout towards $0.015 is expected, the long-term trend could still be bearish.
Highlights
- HOT has broken out from a descending resistance line.
- It has reclaimed the $0.007 support area.
OCEAN
OCEAN has been gradually moving downwards since reaching an all-time high price on April 10, and doing so at an accelerated rate since creating a lower high on May 10.
On May 23, it reached a low of $0.40 and bounced, validating the $0.45 area as support. However, it failed to move above the $0.80 area.
Therefore, it is trading inside a range between $0.45 and $0.80.
Technical indicators are neutral. The MACD is increasing, but is still negative. The RSI is below 50. The Stochastic oscillator is the only one that has a clear bullish reading, having made a bullish cross (green icon) and moving upwards in the process.
Nevertheless, due to the lack of structure and indecision from indicators, the direction of the trend cannot be determined, until OCEAN moves outside of this range.
Highlights
- There is support and resistance at $0.45 and $0.80.
- Technical indicators are neutral.
For BeInCrypto’s latest BTC (BTC) analysis, click here.
The post FIL, HOT, OCEAN — Storage Tokens Aim to Create Bullish Structures appeared first on BeInCrypto.


