HBAR Consolidates After Breakout
2 min readHedera Hashgraph (HBAR) managed to break out from a long-term descending parallel channel on Aug. 14. However, it has failed to initiate a significant upward movement since the breakout.
Despite the long-term trend being bullish, there is weakness developing in the lower time-frame, a sign that the token could initially drop before moving upwards.
HBAR breaks out
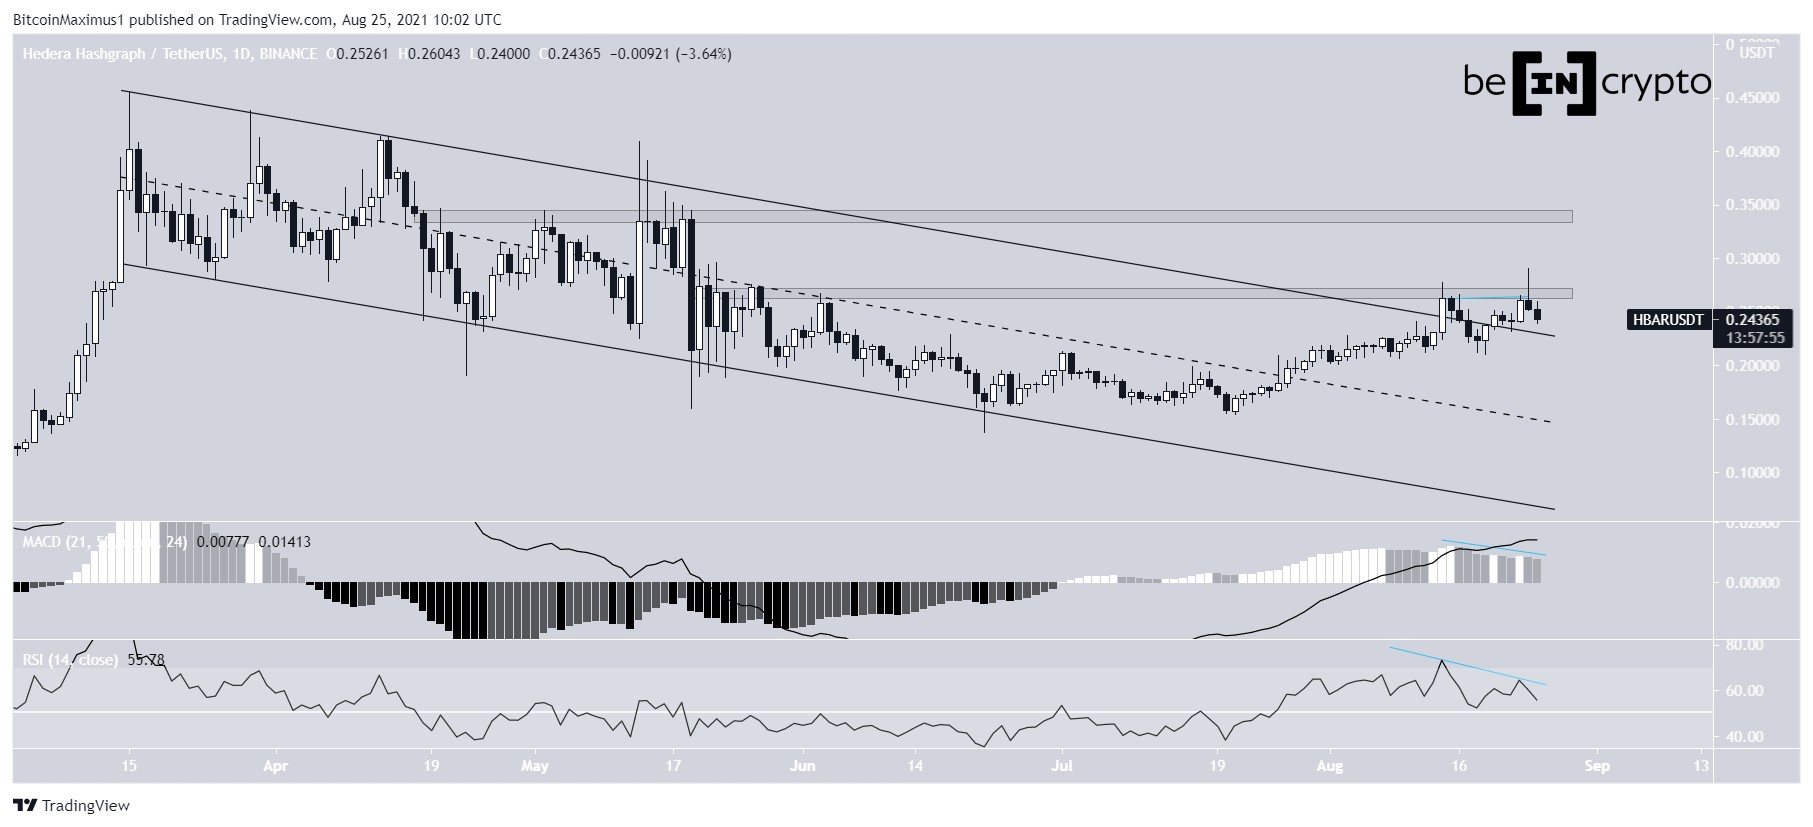
HBAR had been decreasing alongside a descending parallel channel since March 25. The decrease continued until a low of $0.138 was reached on June 22. The token has been moving upwards since.
On Aug. 14, it purportedly broke out from the channel. However, it failed to sustain the upward movement and was rejected by the $0.27 resistance area instead. It made another breakout attempt on Aug. 24, which was also unsuccessful and created a long upper wick.
Furthermore, both the MACD and RSI have generated bearish divergences. Therefore, it is likely that the token will decrease initially before potentially making another breakout attempt.

Future movement
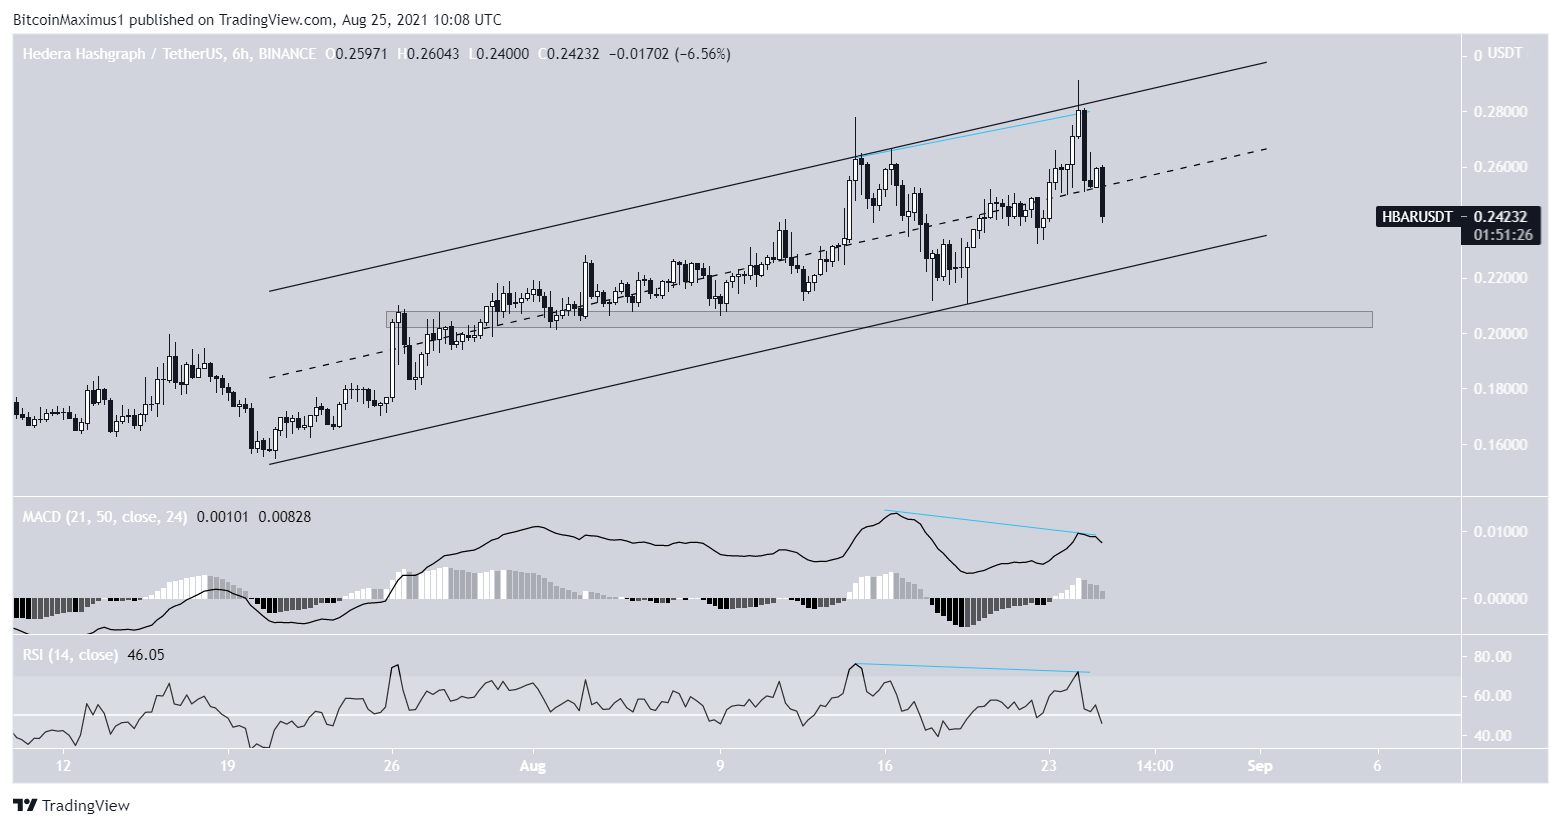
The shorter-term six-hour chart shows that HBAR has been trading inside an ascending parallel channel since July 20. Such structures usually contain corrective movements.
Furthermore, there is bearish divergence in place in both the RSI and MACD, similar to the daily time-frame.
If a breakdown occurs, the main resistance area would be at $0.205.

Wave count
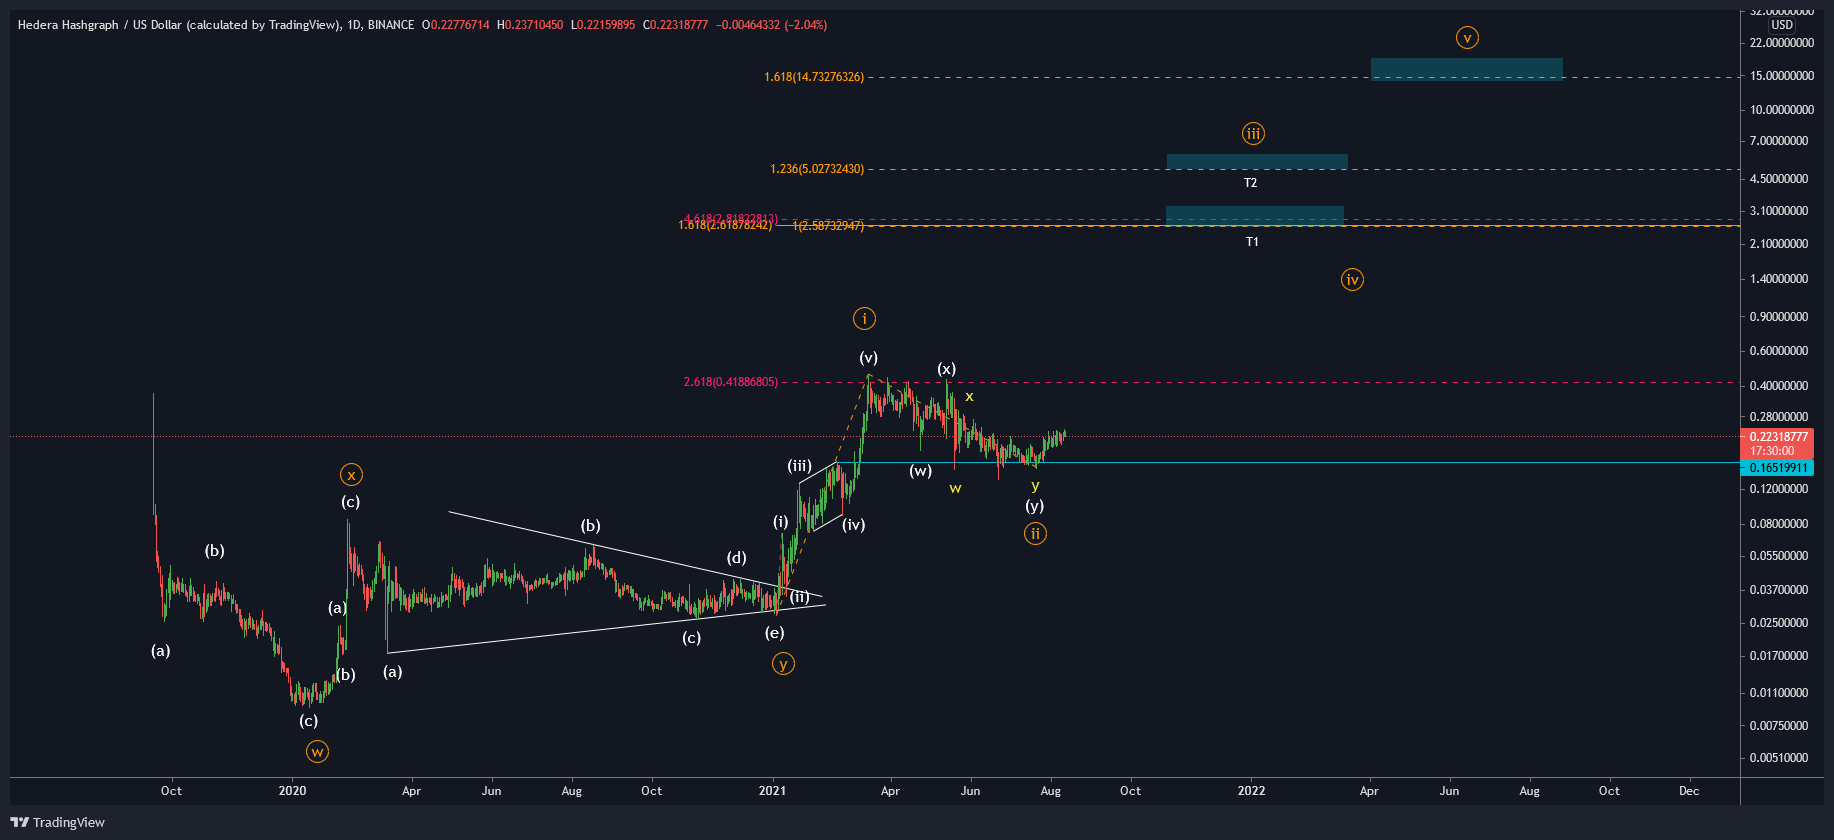
Cryptocurrency trader @24KCrypto outlined an HBAR chart, stating that the price is in a long-term bullish structure that could eventually take it to a new all-time high near $3.

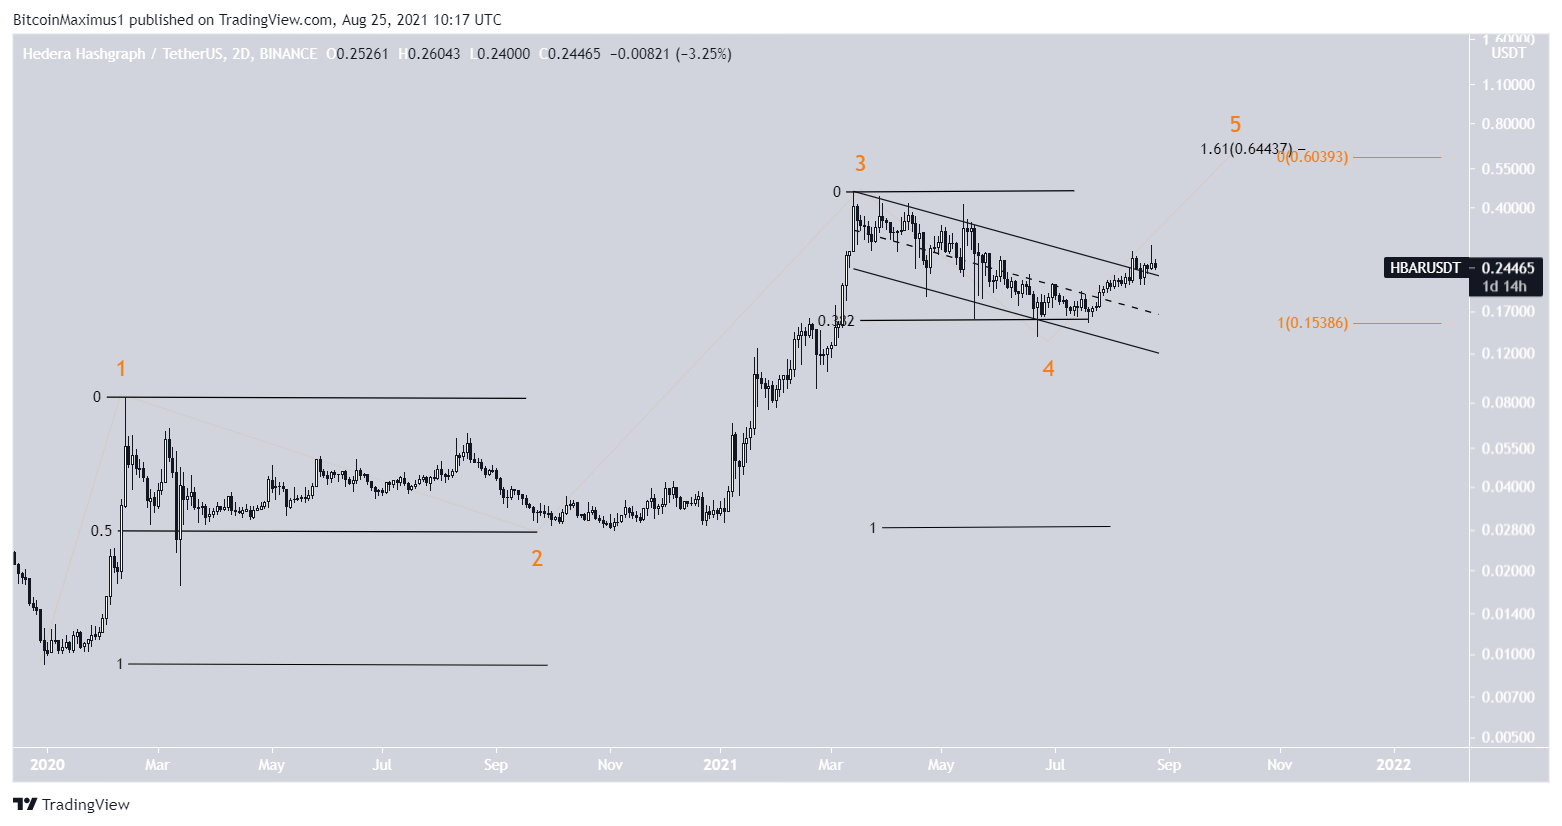
It does look likely that HBAR is in wave four of a bullish impulse, that began on Jan. 2020. There is sufficient alternation in both time and length between waves two and four.
If the count proves to be correct, the initial targets for the top of the movement would be between $0.604-$0.644. This is the 1.61 external Fib retracement (black) and the length of waves 1-3 (orange), projected to the bottom of wave four.

For BeInCrypto’s latest BTC (BTC) analysis, click here.
The post HBAR Consolidates After Breakout appeared first on BeInCrypto.


