Is Bitcoin’s Monthly Close Bearish or Bullish for Q4 Outlooks?
2 min readBitcoin (BTC) reached a relatively positive close for the month of August. Even though the price has broken out from a neutral pattern, short-term decreases could occur before BTC resumes its upward trend.
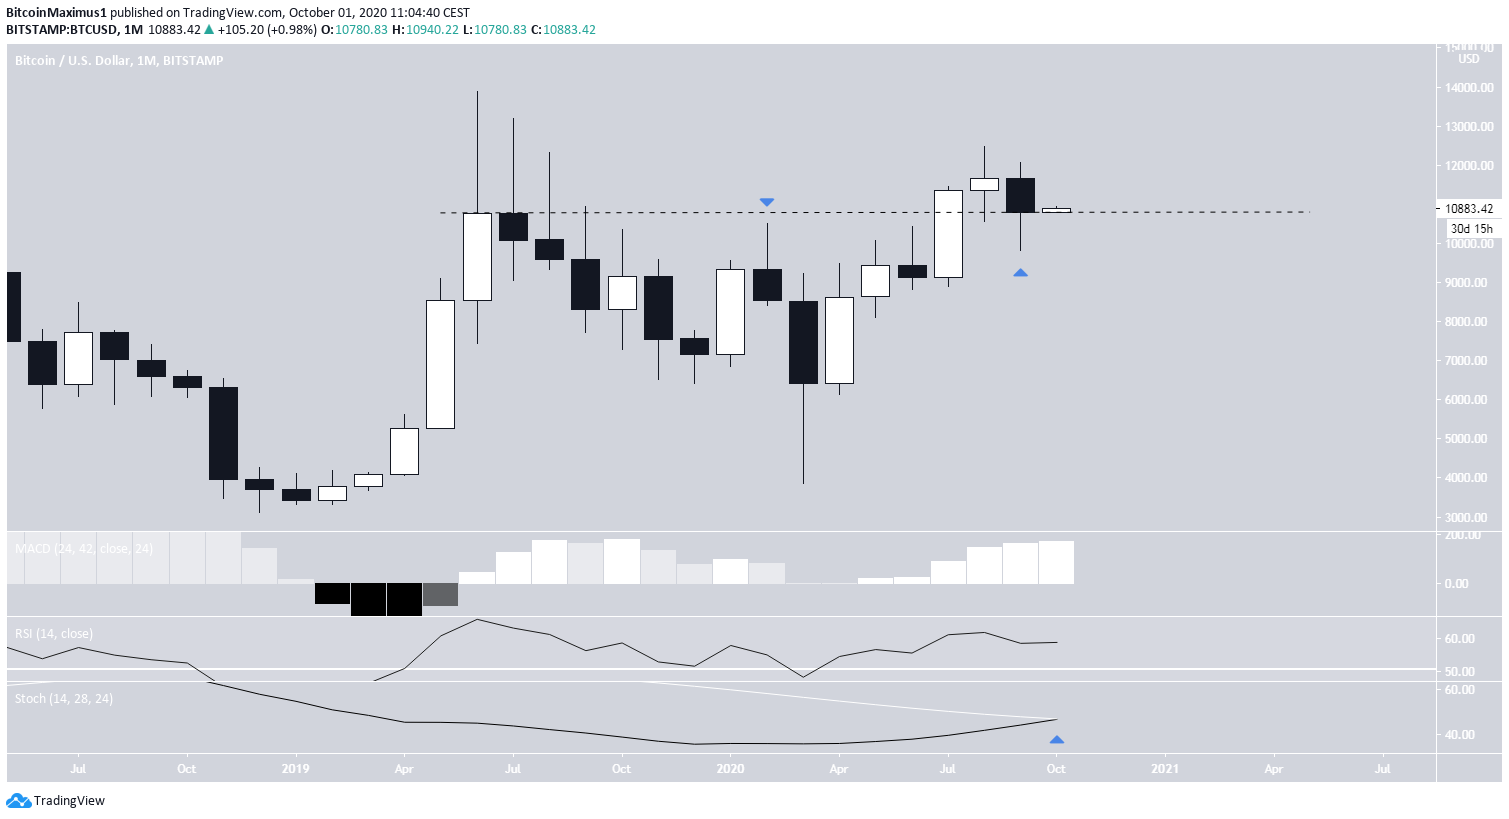
Even though BTC created a bearish September candlestick, the close was above a previous resistance area, making the current movement likely to be a re-test of supports.
Bitcoin’s Monthly Close
Bitcoin has left a long lower-wick in place, a normal sign of buying pressure.
Technical indicators are bullish. The RSI and MACD are increasing, while the latter has turned positive. The stochastic oscillator is in the process of making a bullish cross, a sign that the long-term trend is likely bullish.
Nearing Resistance
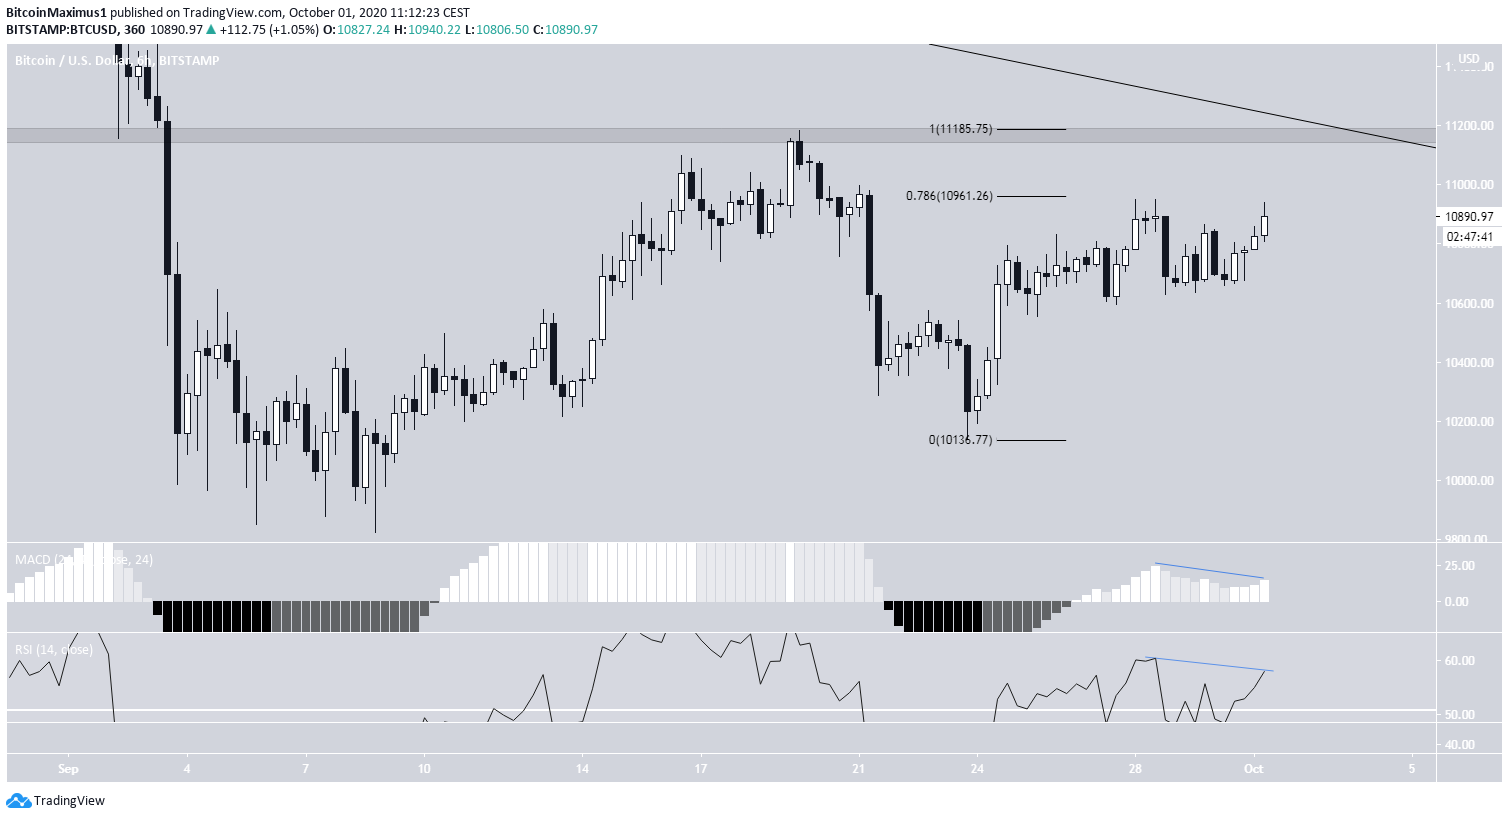
Bitcoin has been moving upwards since reaching a local low of $10,138 on Sept 23.
The increase that followed was steady until it was rejected at $10,959, the 0.786 Fib level of the previous decrease. The rejection was weak, however, and the price is currently in the process of making another breakout attempt.
Technical indicators have begun to show weakness since both the RSI and MACD are in the process of generating unconfirmed bearish divergences.
If the price were to break out, the next resistance area would be found at $11,200, a level that also coincides with a long-term descending resistance line.
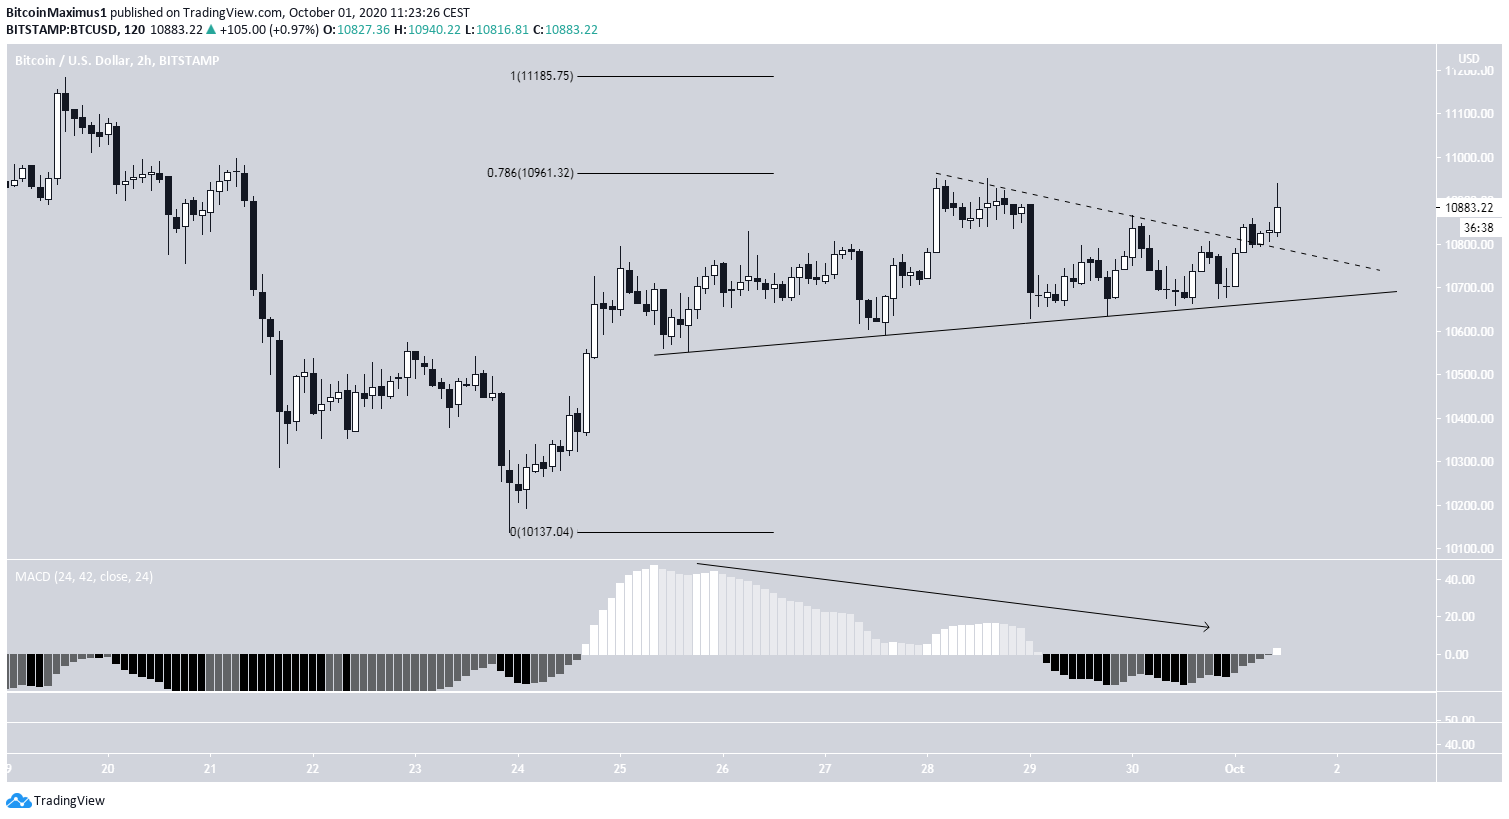
The shorter-term 2-hour chart shows that the price is following an ascending support line and has possibly broken out from a symmetrical triangle (dashed). The breakout makes it likely that the price will re-test the $11,200 area once more.
The MACD has turned positive, even though there is still an unconfirmed bearish divergence.
Wave Count
It is likely that BTC began a bullish impulse on Sept 23 (in blue below) and completed wave 1 on Sept 26. The sub-wave count for waves 1-2 is shown in red.
If the count is correct, the BTC price is in the process of completing sub-wave B (red), after which sub-wave C will complete wave 2.
A likely target for the bottom would be $10,542, the 0.5 Fib level of the entire upward move.
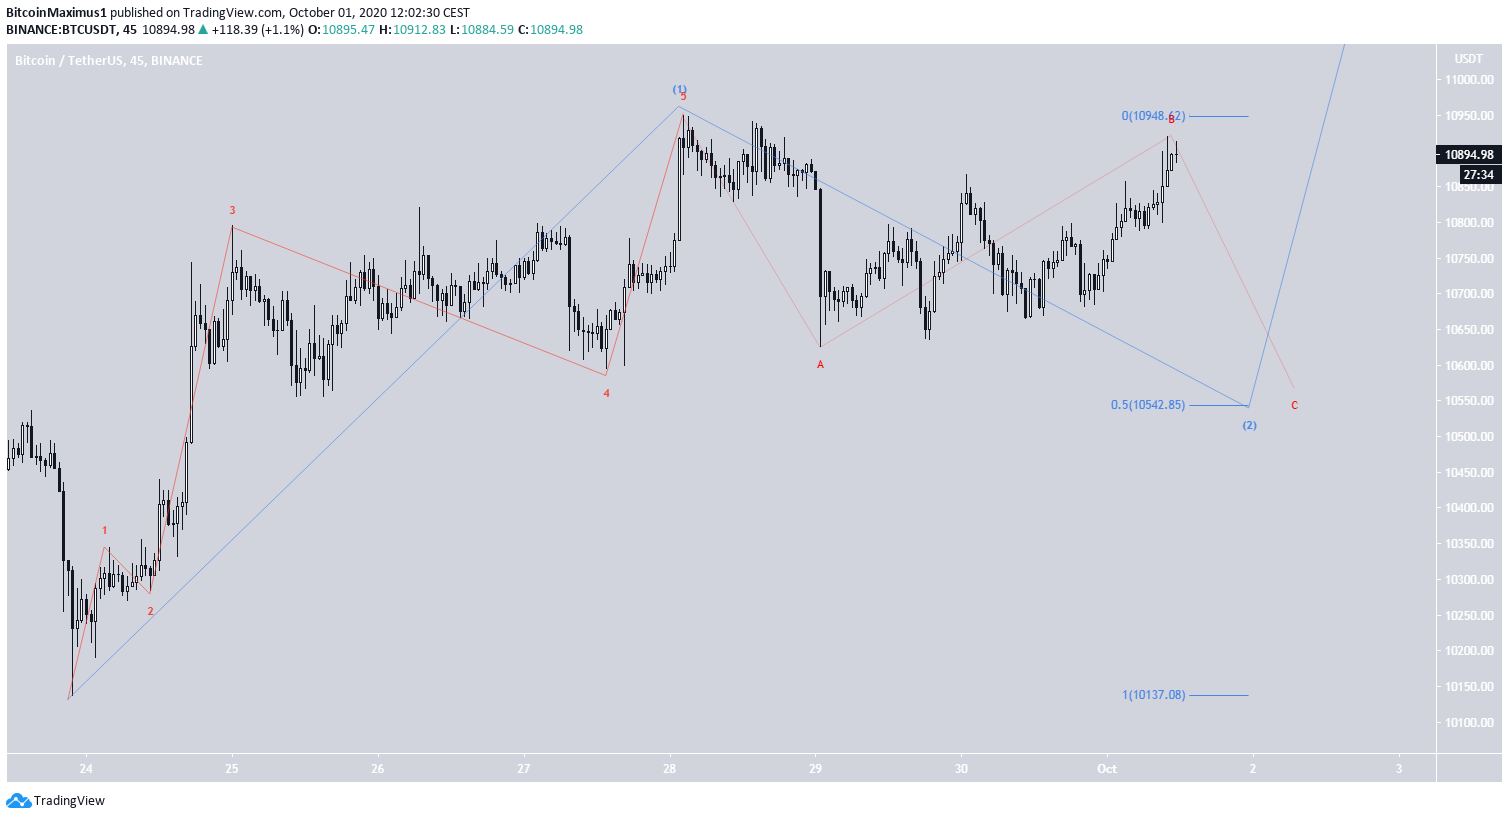
While there is a possibility that BTC completed the correction yesterday with a low of $10,658, the upward movement since (highlighted) looks corrective rather than impulsive, making it more likely that the price is still in the B sub-wave.
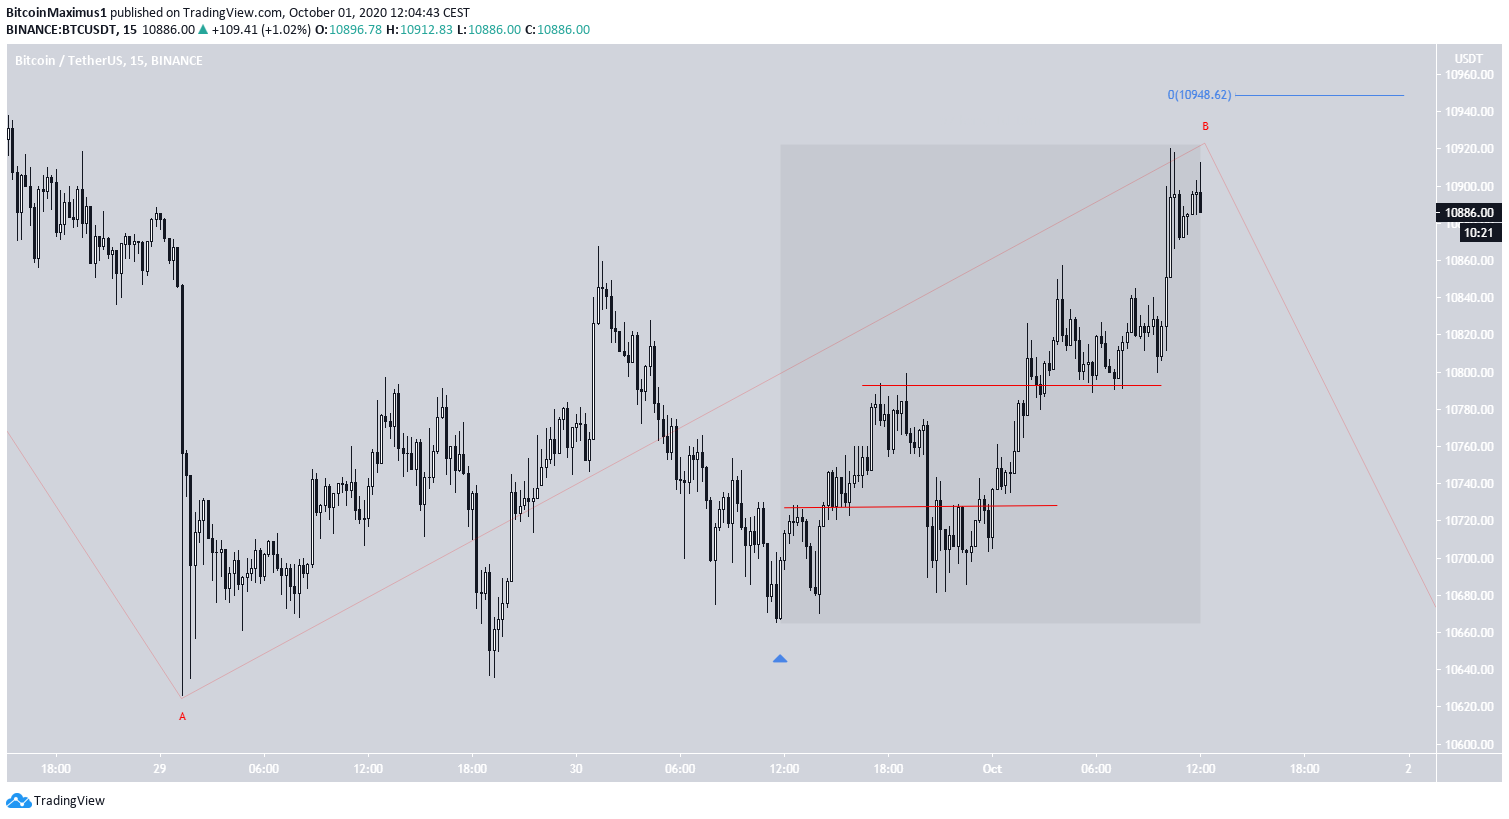
To conclude, BTC could see a short-term correction to $10,550 before resuming its upward movement.
For BeInCrypto’s previous Bitcoin analysis, click here!
The post Is Bitcoin’s Monthly Close Bearish or Bullish for Q4 Outlooks? appeared first on BeInCrypto.


