NEO Bounces Above Support, Could Make Another Breakout Attempt
2 min readTable of Contents
The NEO price has been decreasing since its rejection at the $23 resistance area on Sept. 18. It has found support on lower time-frames and could soon make another breakout attempt.
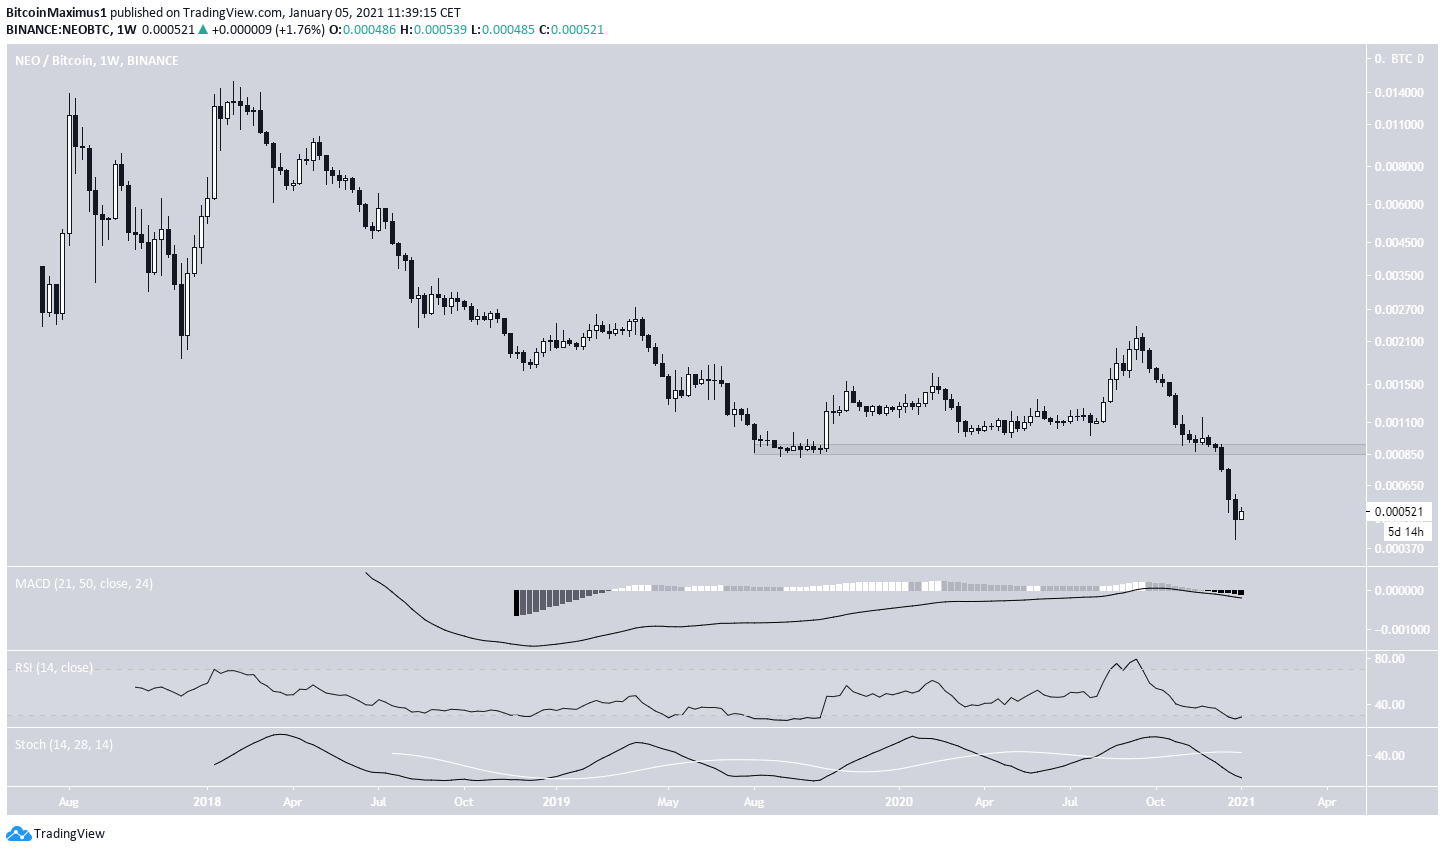
Despite this, the NEO/BTC chart remains in bearish price discovery, giving no bullish reversal signs.
Long-Term Resistance
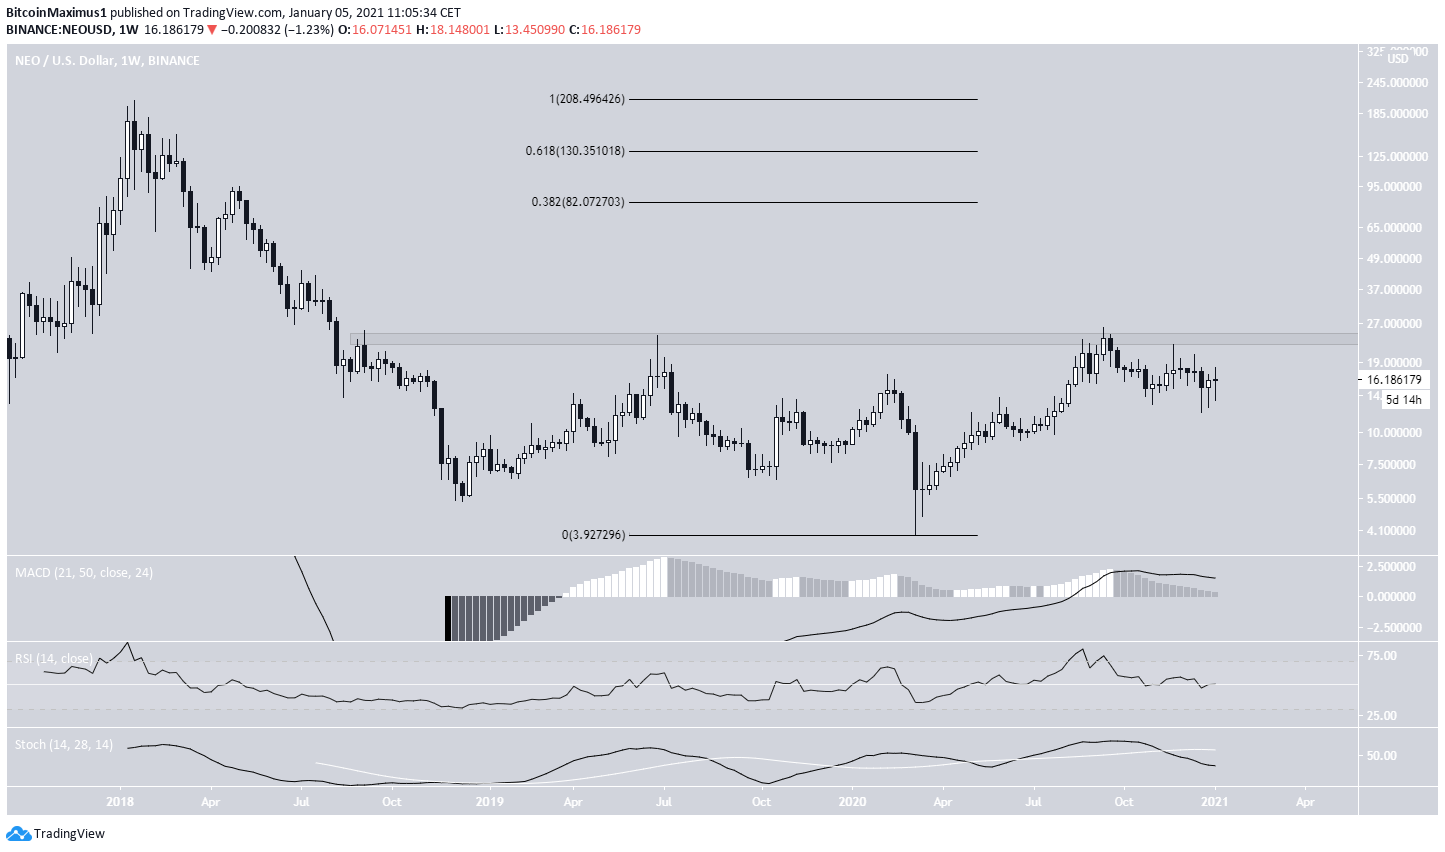
NEO has been trading below the $23 resistance area since it initially broke down in Oct 2018. Until now, it has made three unsuccessful breakout attempts, the most recent one being on Sept 18, 2020.
If it were to break out above this area, the next resistance levels would be at $82, 130, and $208, respectively. Therefore, the lack of overhead resistance could be the trigger for a very sharp rally.
However, technical indicators are neutral, leaning bearish. This casts some doubt on the possibility of a breakout.
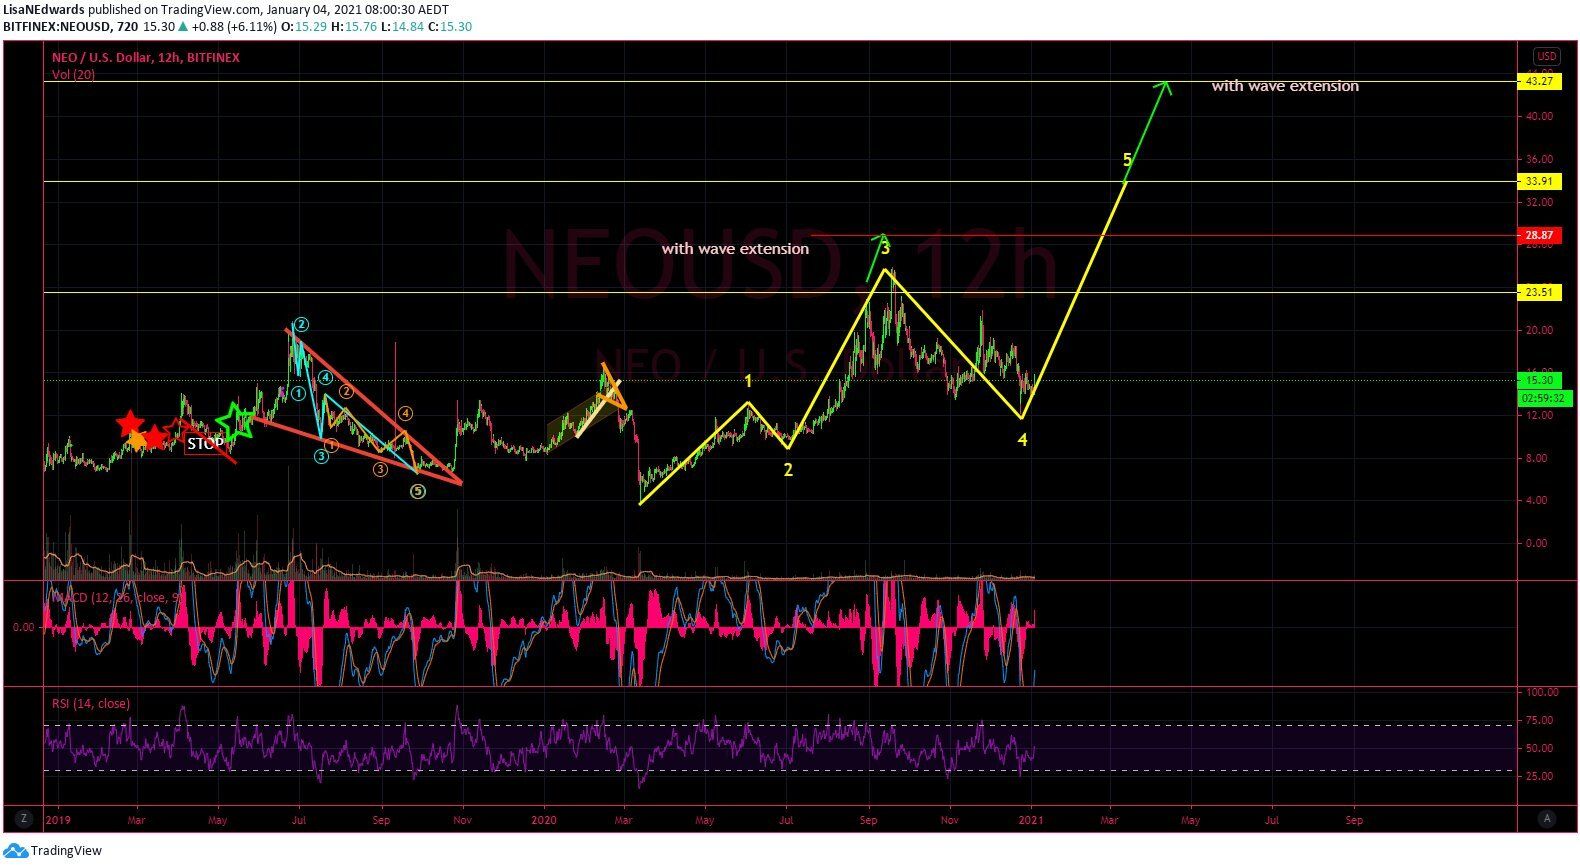
Cryptocurrency trader @LisaNEdwards outlined a chart that has the price going all the way to $45. Due to the lack of resistance above the $23 area, a breakout could very well take the price to $45 or even higher.
Descending Resistance Line
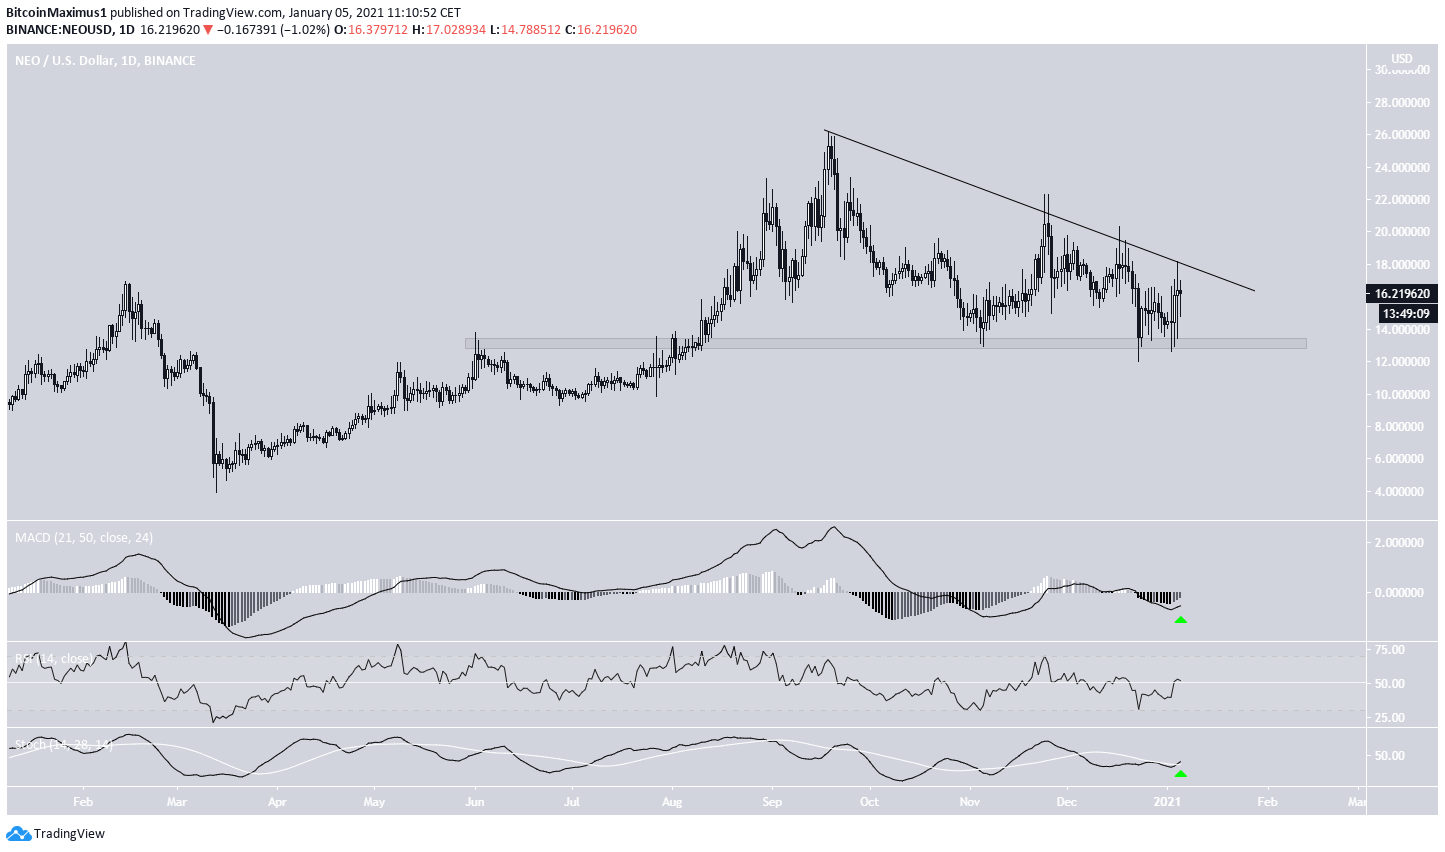
The daily chart shows that NEO has been following a descending resistance line since it reached a high of $24.87 on Sept. 17. It has validated the line four times so far.
Also, we can see a support level at $13.20, which has been validated twice.
Technical indicators are bullish, supporting the possibility that NEO will break out above this resistance line and make another attempt to break out above $23.
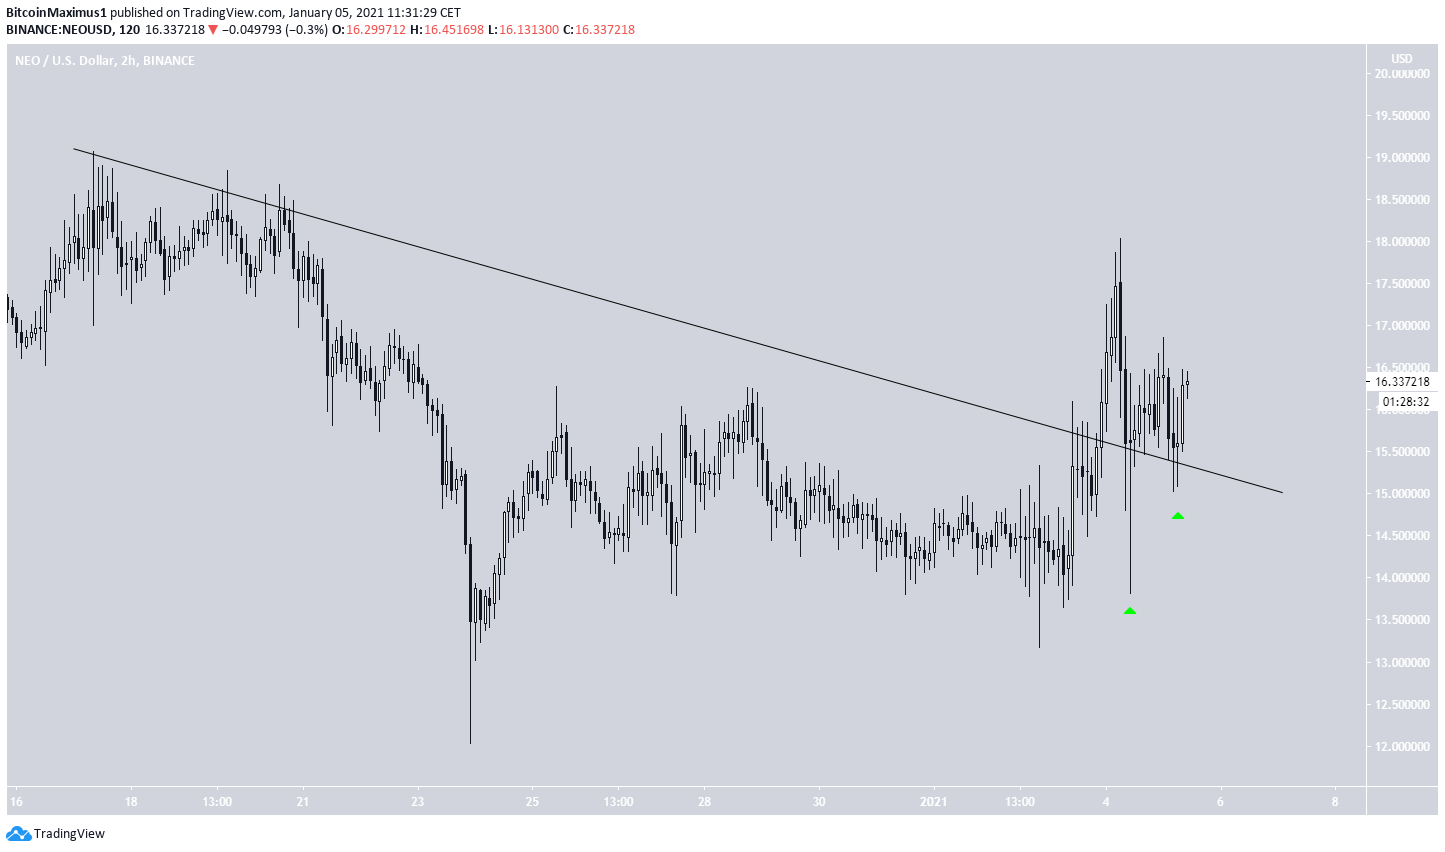
This possibility is supported by the two-hour chart, which shows a breakout from a short-term descending resistance line and its validation as support afterward.
Furthermore, the long lower wicks are a sign of buying pressure, another indication that it will likely head upwards.
NEO/BTC
Despite the relative bullishness from the NEO/USD pair, the NEO/BTC chart remains firmly bearish. NEO has been decreasing at an accelerated rate since it first broke down from the 9000 satoshi area at the beginning of Dec.
There are no bullish reversal signs whatsoever, and the trend remains bearish until it can successfully reclaim the 9000 satoshi area.
Conclusion
To conclude, NEO should gradually increase and break out above the $23 resistance area, potentially moving towards the next resistance levels.
Despite this, the NEO/BTC chart remains bearish without yet providing any bullish reversal signs.
For BeInCrypto’s latest Bitcoin (BTC) analysis, click here!
Disclaimer: Cryptocurrency trading carries a high level of risk and may not be suitable for all investors. The views expressed in this article do not reflect those of BeInCrypto.
The post NEO Bounces Above Support, Could Make Another Breakout Attempt appeared first on BeInCrypto.


