Privacy Coins Recover But Continue Range Trading
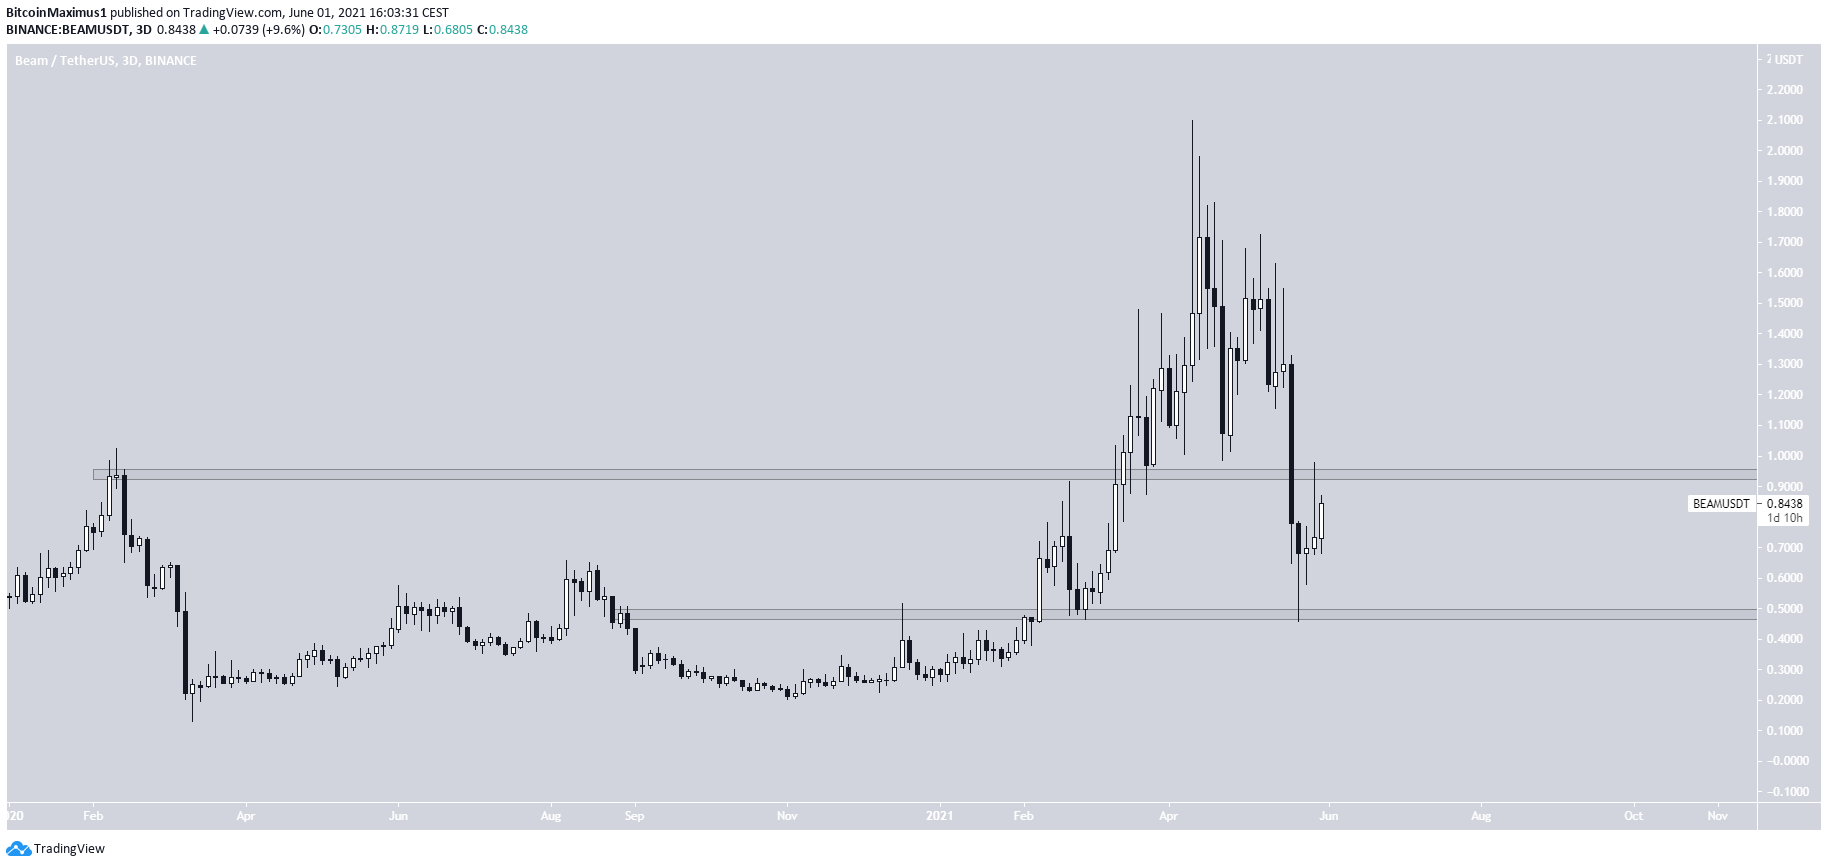
3 min readBeam Protocol (BEAM) is trading inside a range between $0.50 and $0.95, respectively.
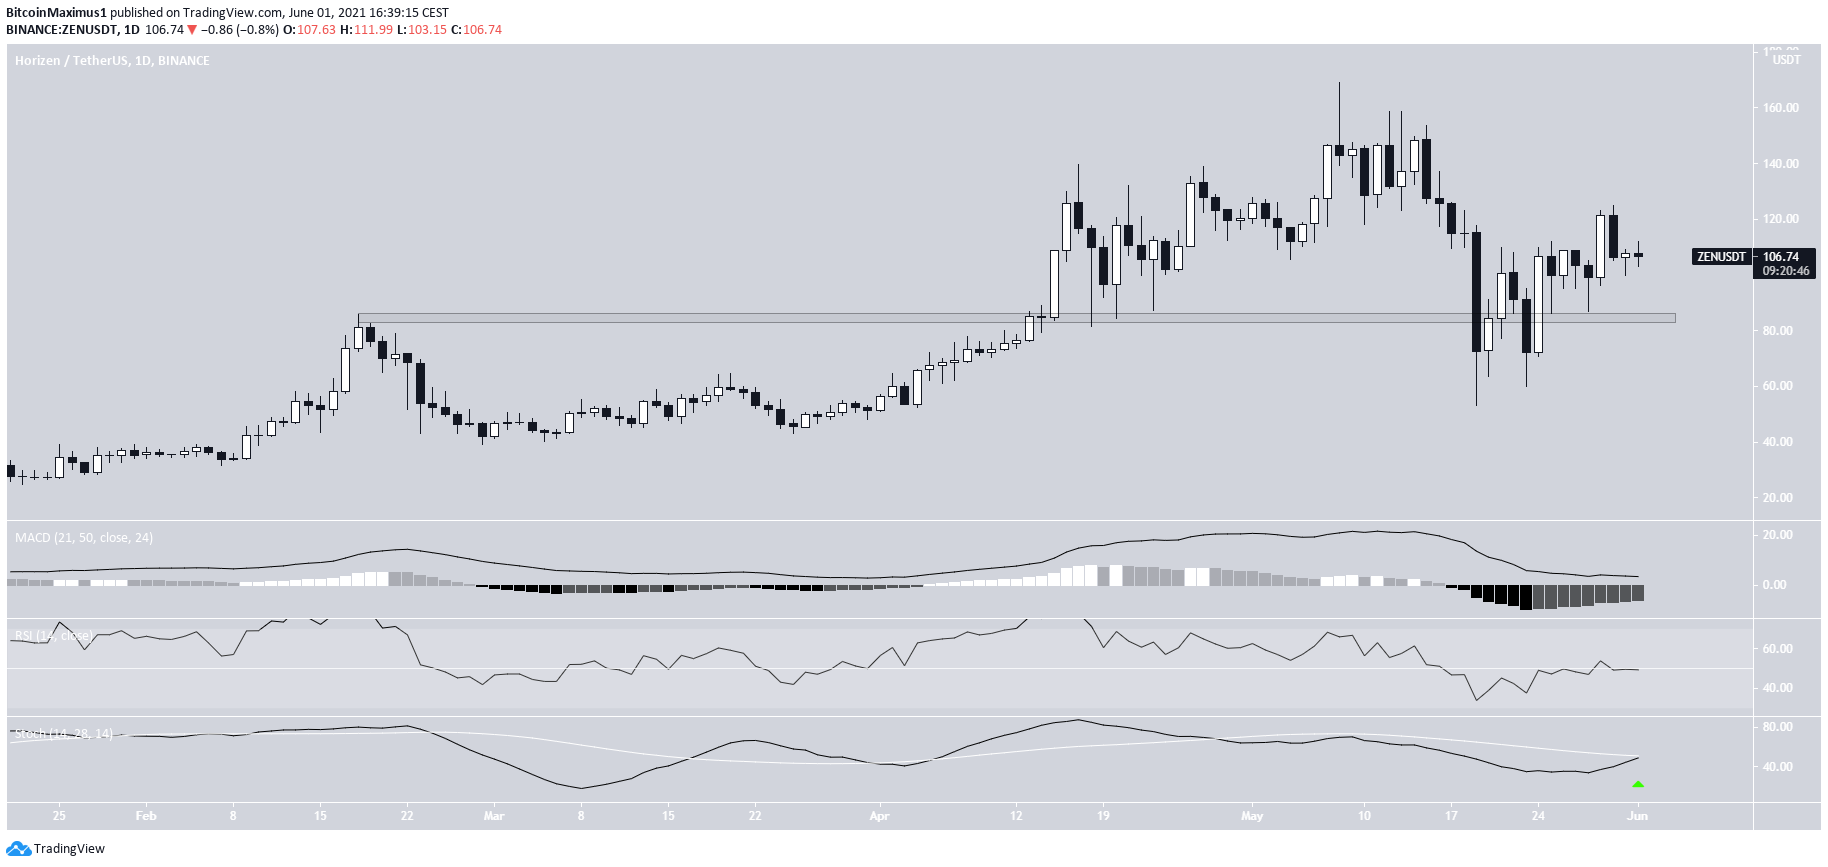
Horizen (ZEN) has reclaimed the $84 horizontal area and is moving upwards.
Monero (XMR) has fallen below the $410 area which is now likely to act as resistance.
BEAM
BEAM has been decreasing since reaching a high of $2.10 on April 11. The decrease has been sharp, leading to a low of $0.456 on May 23. This created a long lower wick and validated the $0.45 area as support.
The main resistance area is found at $0.90. Until BEAM manages to break out above it, we cannot consider the trend bullish.
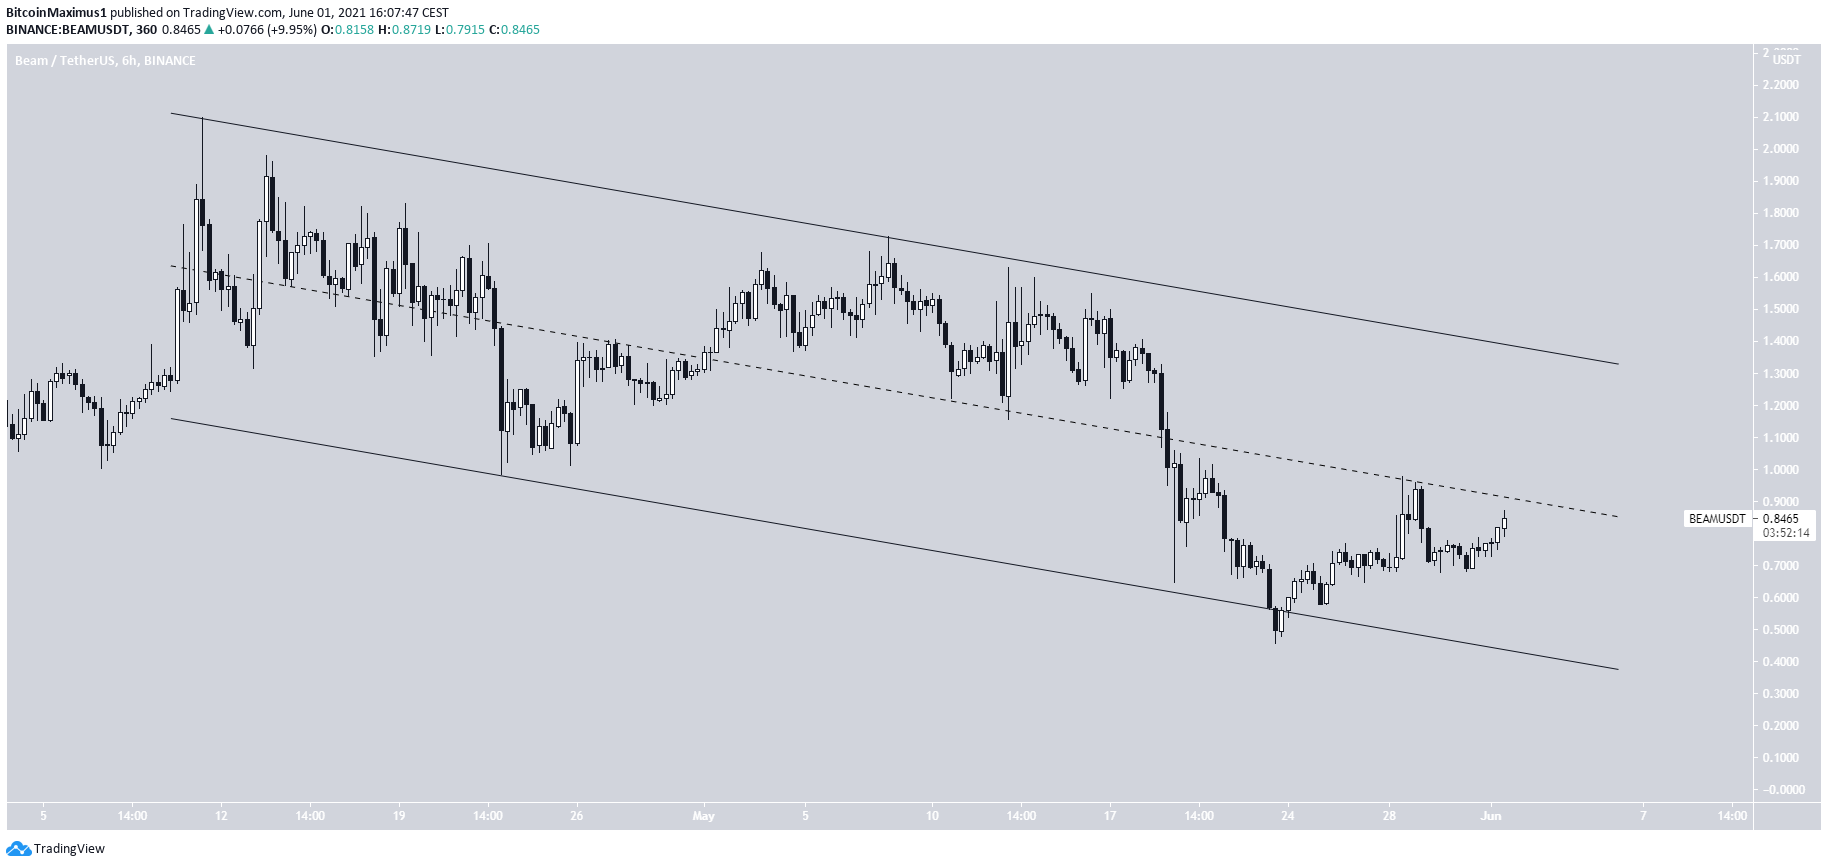
The shorter-term six-hour chart shows a descending parallel channel. This often contains corrective structures.
At the time of writing, BEAM was in the process of moving above the middle of the channel. This is a bullish development, that would go a long way in confirming that the decrease is corrective.
In addition, the middle of the channel is very close to the $0.90 resistance area. Therefore, a breakout above it would also mean a breakout above the horizontal resistance area.
If so, the next resistance level would be at $1.30, at the resistance line of the channel.
Highlights
- There is support and resistance at $0.50 and $0.95, respectively.
- BEAM is trading inside a descending parallel channel.
ZEN
ZEN has been decreasing since May 8, when it reached an all-time high price of $169.23 and created a shooting star candlestick.
The decrease culminated with a low of $53.33, reached on May 19.
However, the token bounced shortly afterwards and managed to reclaim the $85 area. It created a higher low and has been moving upwards.
Technical indicators in the daily time-frame are bullish. The MACD has given a bullish reversal signal and is above 0.
The RSI has crossed above 50 and the Stochastic oscillator has just made a bullish cross (green icon).
Therefore, it seems that the trend is still bullish.
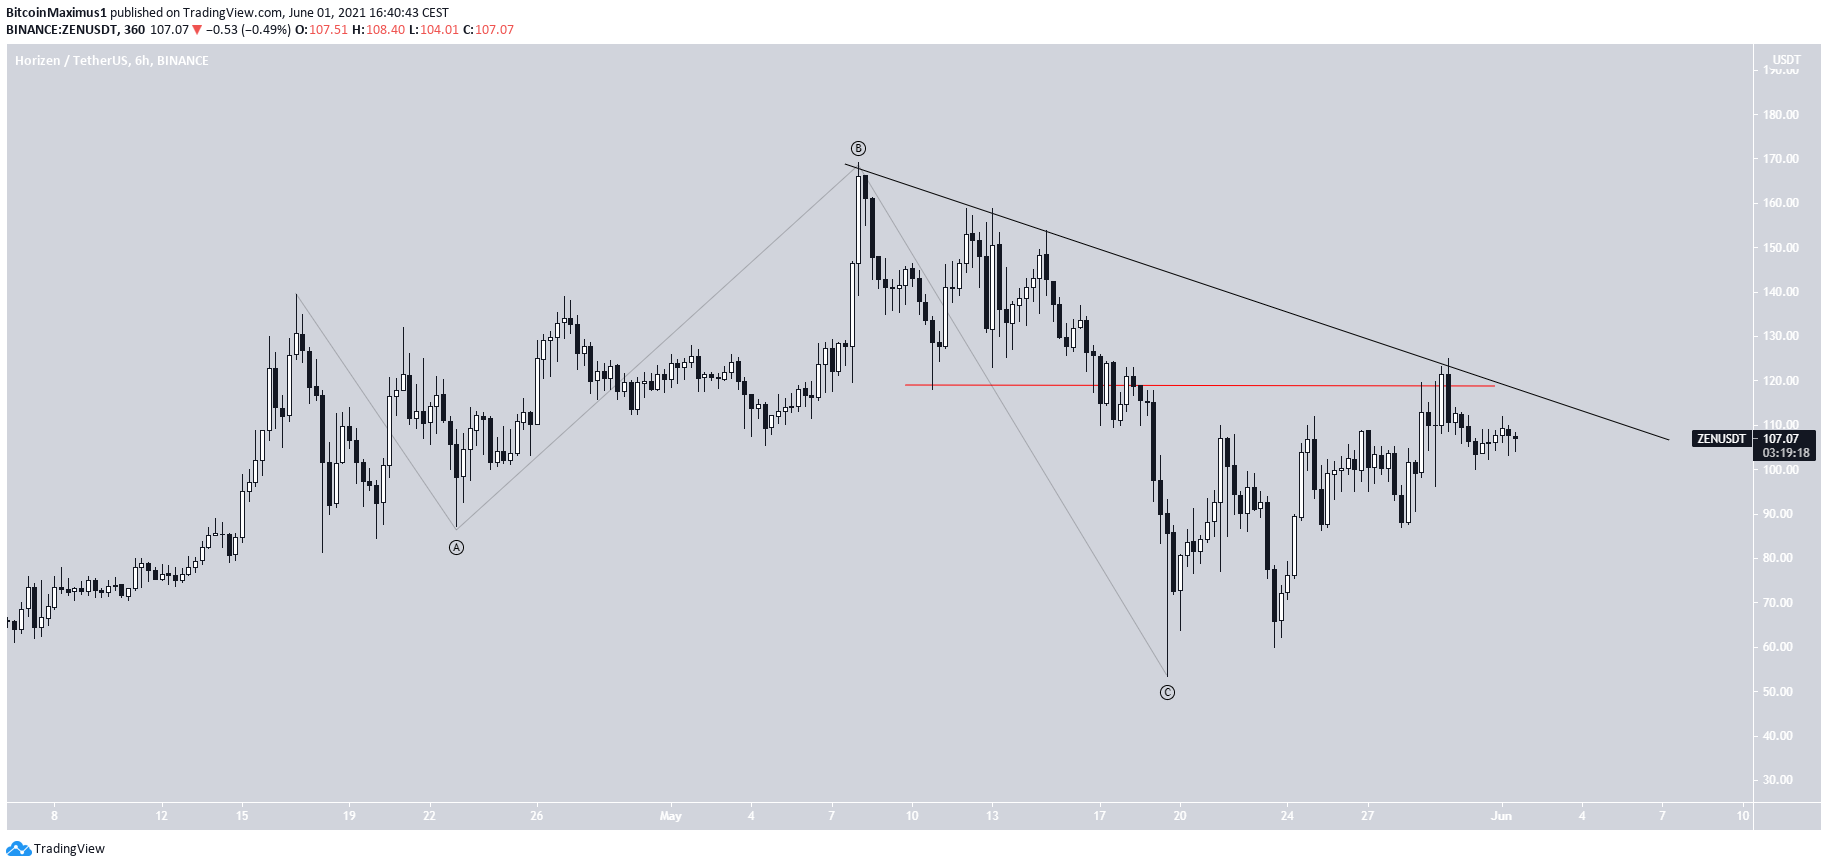
The shorter-term six-hour chart shows that the token is following a descending resistance line. It is currently making its fourth breakout attempt.
The overlap (red line) after the bounce indicates that this is not the beginning of a bearish impulse, but rather is potentially a completed A-B-C flat corrective structure.
If so, ZEN would be expected to break out.
This also fits with the daily time-frame readings.
Highlights
- ZEN has reclaimed the $85 support area.
- Technical indicators in the daily time-frame are bullish.
XMR
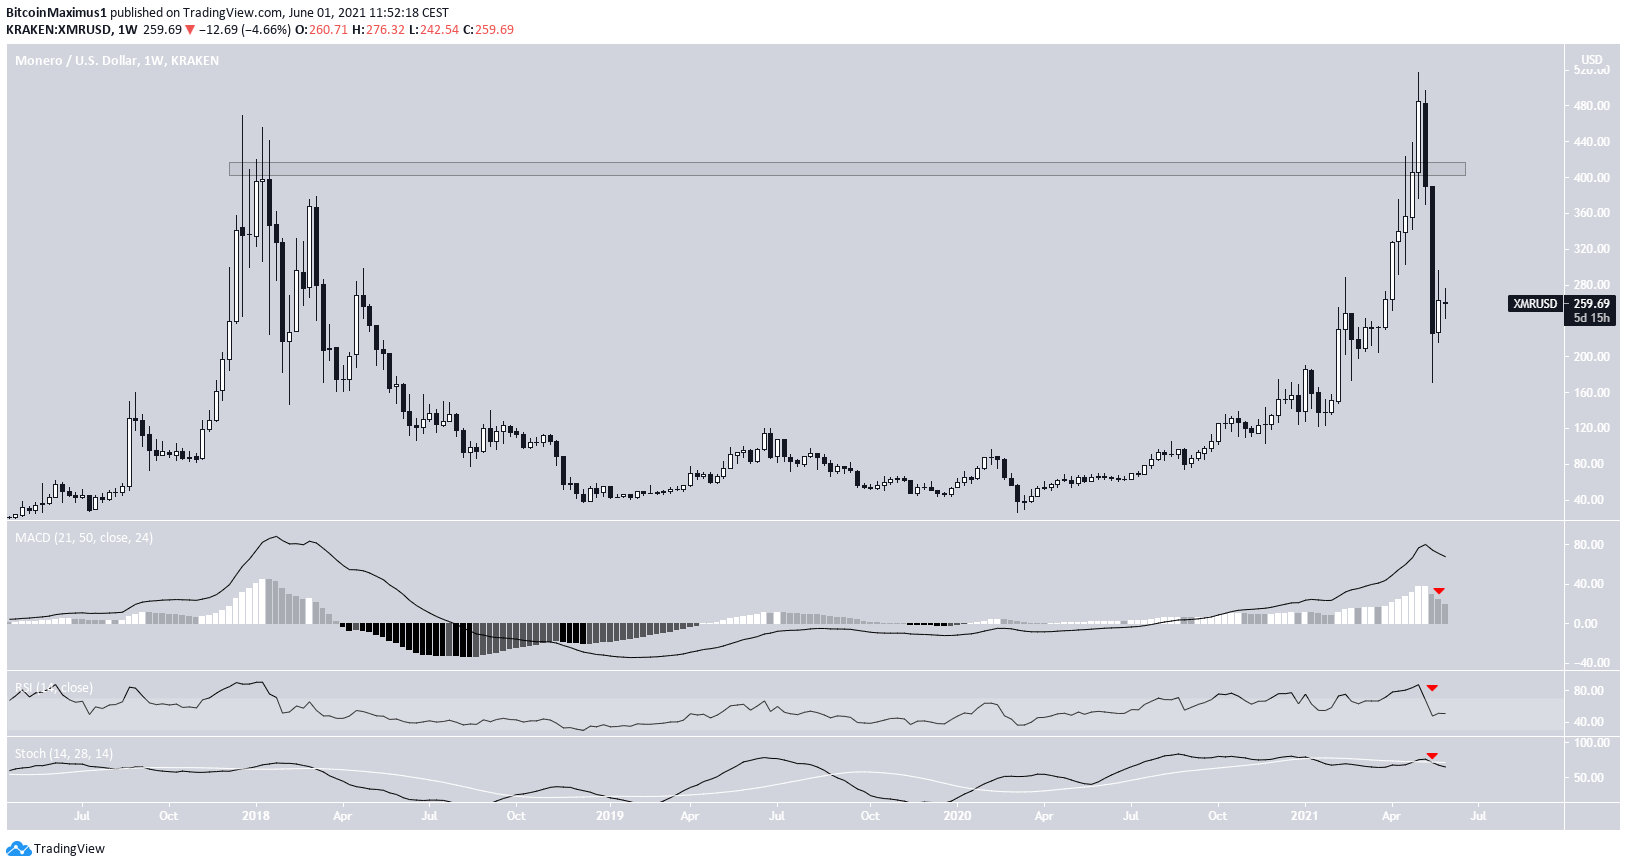
XMR has been decreasing since May 17, when it reached an all-time high price of $517. The decrease has been swift, leading to a low of $171.48 on May 10.
An interesting development on the weekly chat is the decrease below the $410 area. This acted as the all-time high resistance in 2017 and was expected to act as support. Since XMR has broken down, it is expected to act as resistance once more.
Technical indicators have turned bearish. The Stochastic oscillator has made a bearish cross and the RSI has crossed below 70. Furthermore, the MACD has given a bearish reversal signal (red icons)
The trend is considered bearish until the $410 area is reclaimed.
Highlights
- XMR is facing resistance at $410.
- Long-term indicators have turned bearish.
For BeInCrypto’s previous BTC (BTC) analysis, click here.
The post Privacy Coins Recover But Continue Range Trading appeared first on BeInCrypto.


