The ratio of realized and market capitalization indicates the local bottom
2 min readFrom the point of view of on-chain indicators, more specifically the ratio between realized and market capitalization, it is possible to draw parallels with previous bull runs. The current ratio between the level of realized and market capitalization has historically marked the bottom.
Realized capitalization
The market capitalization of BTC (MC) is generated by multiplying the market price of BTC by the total number of coins mined. Realized capitalization (RC) also uses similar multiplication. However, instead of the market price, it uses the price at the time of the last exit of unrealized transactions (UTXO).
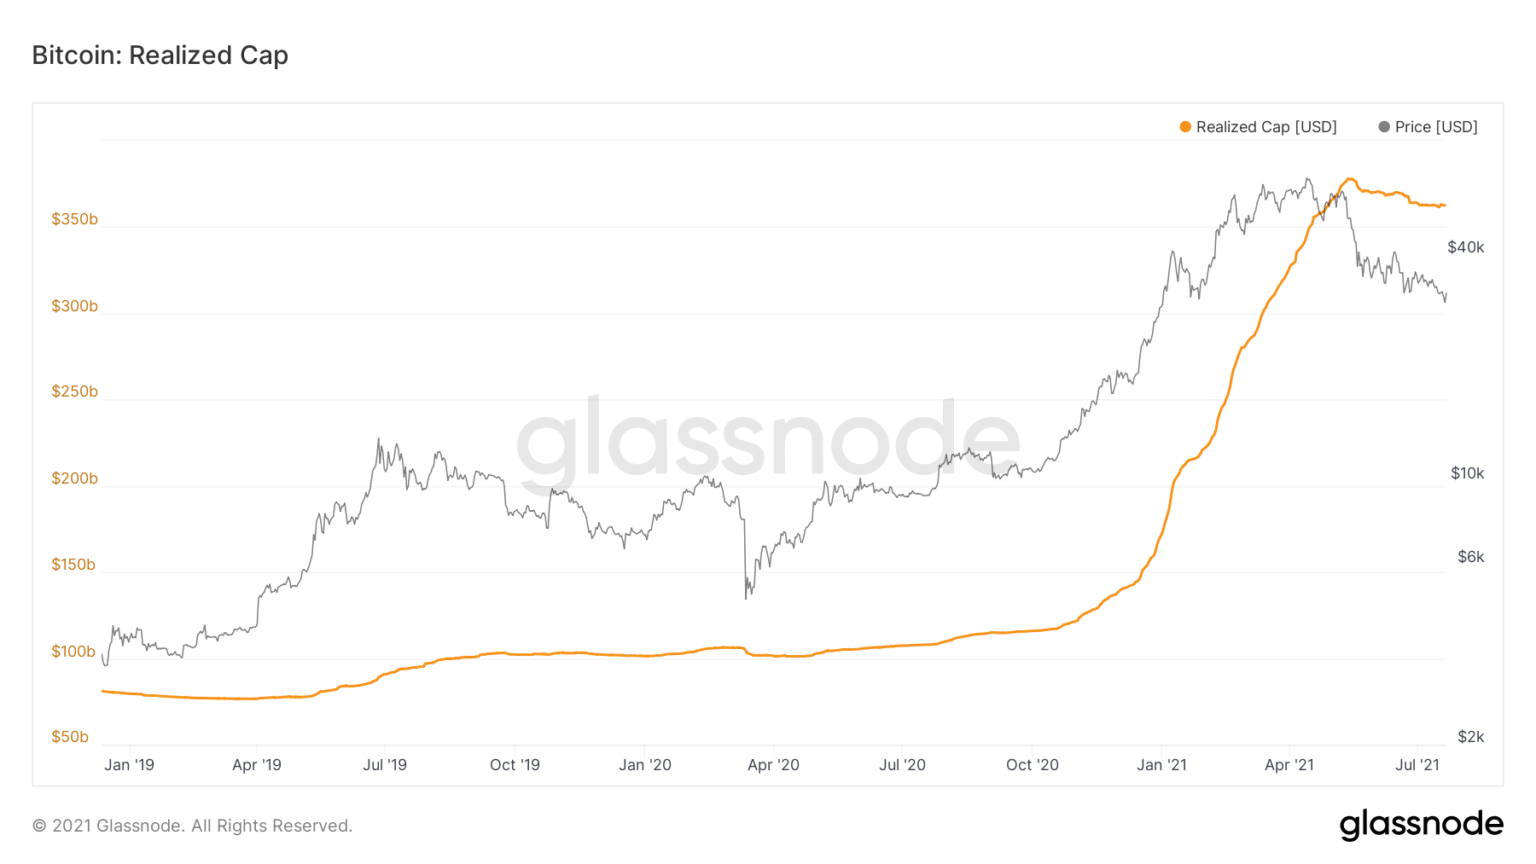
The reason is the deduction of coins that were lost and that did not move for a long time. The realized capitalization has been moving at an accelerated pace since April 2019. On May 15, it reached an all-time high of $ 377.795 billion. This happened about a month after market capitalization reached its all-time high.
RC has been moving down since then and is currently at $ 362 billion. This means that participants sell coins at a loss, which will cause the RC to fall. Since its all-time high, the market has lost about $ 15 billion.

MC approaches RC
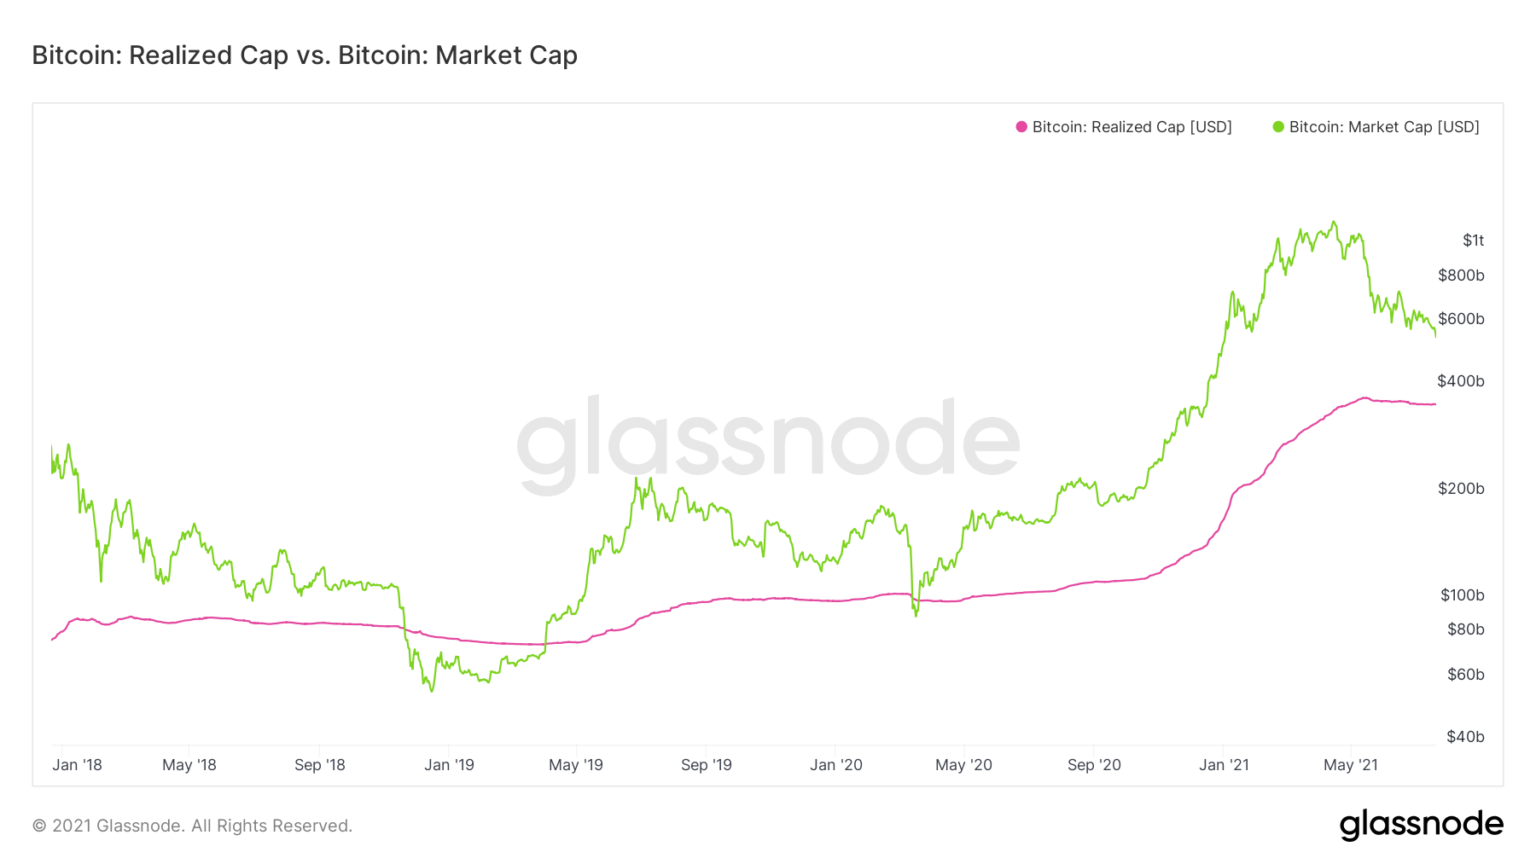
A closer look at the historical movement of this on-chain indicator shows that the MC fell below the RC in December 2018 and in March 2020. These two periods also marked the bottom. In December 2018, the MC remained under RC for five months, while in March 2020 it was less than one month.
In terms of the ratio between the two, RC is currently 64% MC. This is a relatively high value, as the realized capitalization is usually less than 50% of the market capitalization. By the time the market capitalization reached an all-time high in April 2021, RC was 25% MC.
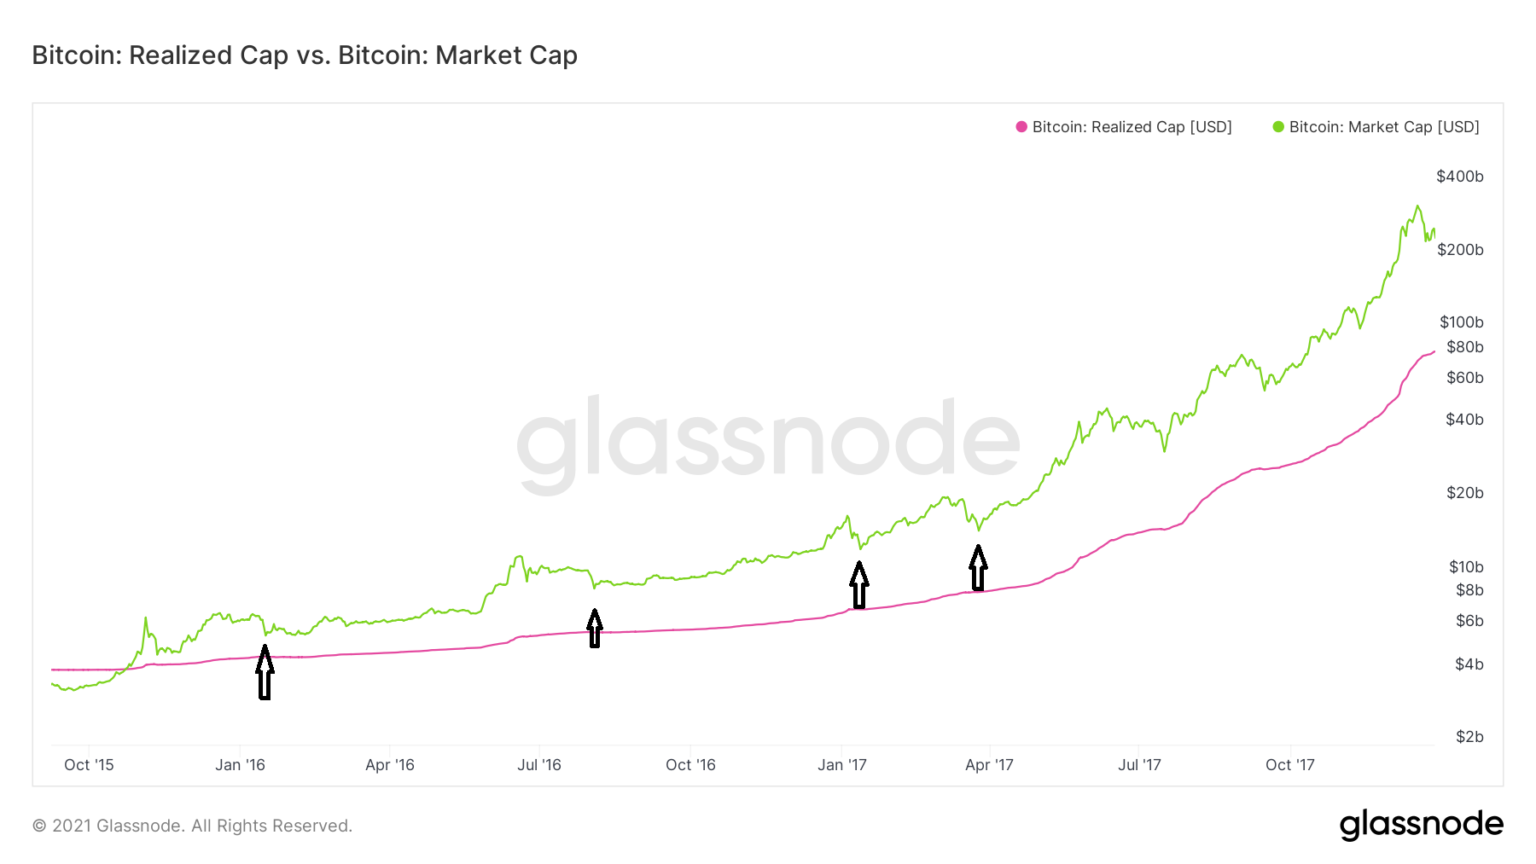
Similarly high ratios were reached on 17 January (78%) in 2017 and 21 August (66%) 2016. In addition, ratios above 50% were reached on 13 January (55%) and on March 25, (52%) 2017. These four periods are indicated by black arrows in the graph below. All four indicate local bottoms.
For the rest of 2015–2018, the realized capitalization was less than 50% market.
Bull run 2012-2015
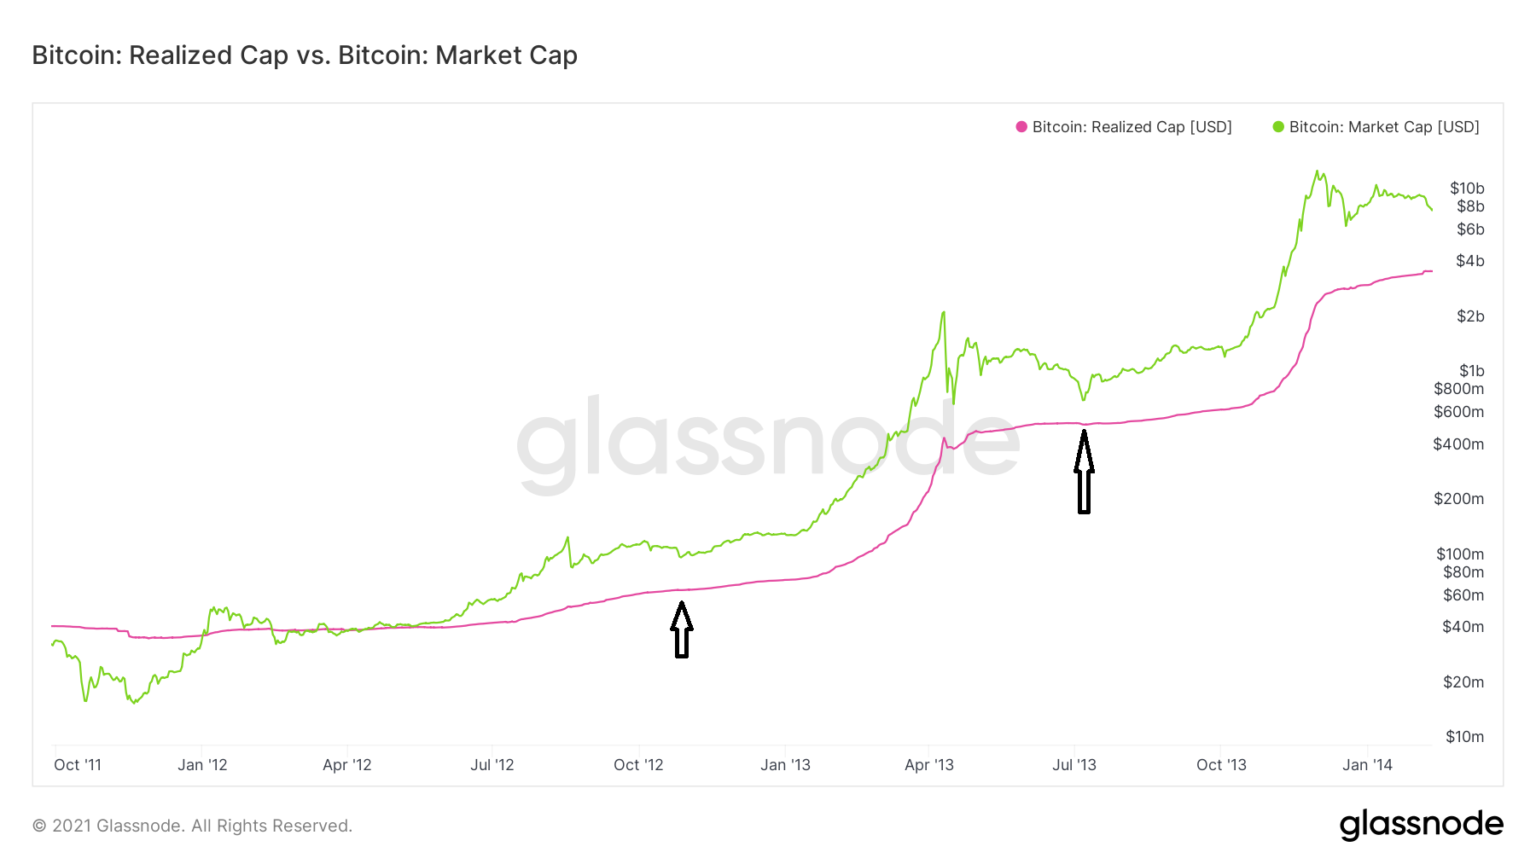
Returning to the next bull run, we see that the MC fell below the RC on February 2012. This also meant the absolute bottom before the start of the bull run. RC was at 64% MC in October 2012 and at 73% in July 2013. After that, it remained below 50% for the rest of the bull run.
In conclusion, these data show that the current bull run was marked by much higher sales at a loss than previous upward movements, and therefore there was a significant decline in RC. In addition, the current RC / MC ratio may indicate the local bottom.


