Waves Bounces But Fails to Clear Resistance
2 min readThe Waves (WAVES) price has been rising since Sept but has reached a crucial resistance level and has been rejected.
The most likely scenario seems to be a decline towards the support levels outlined below.
Bounce Leads to Rejection
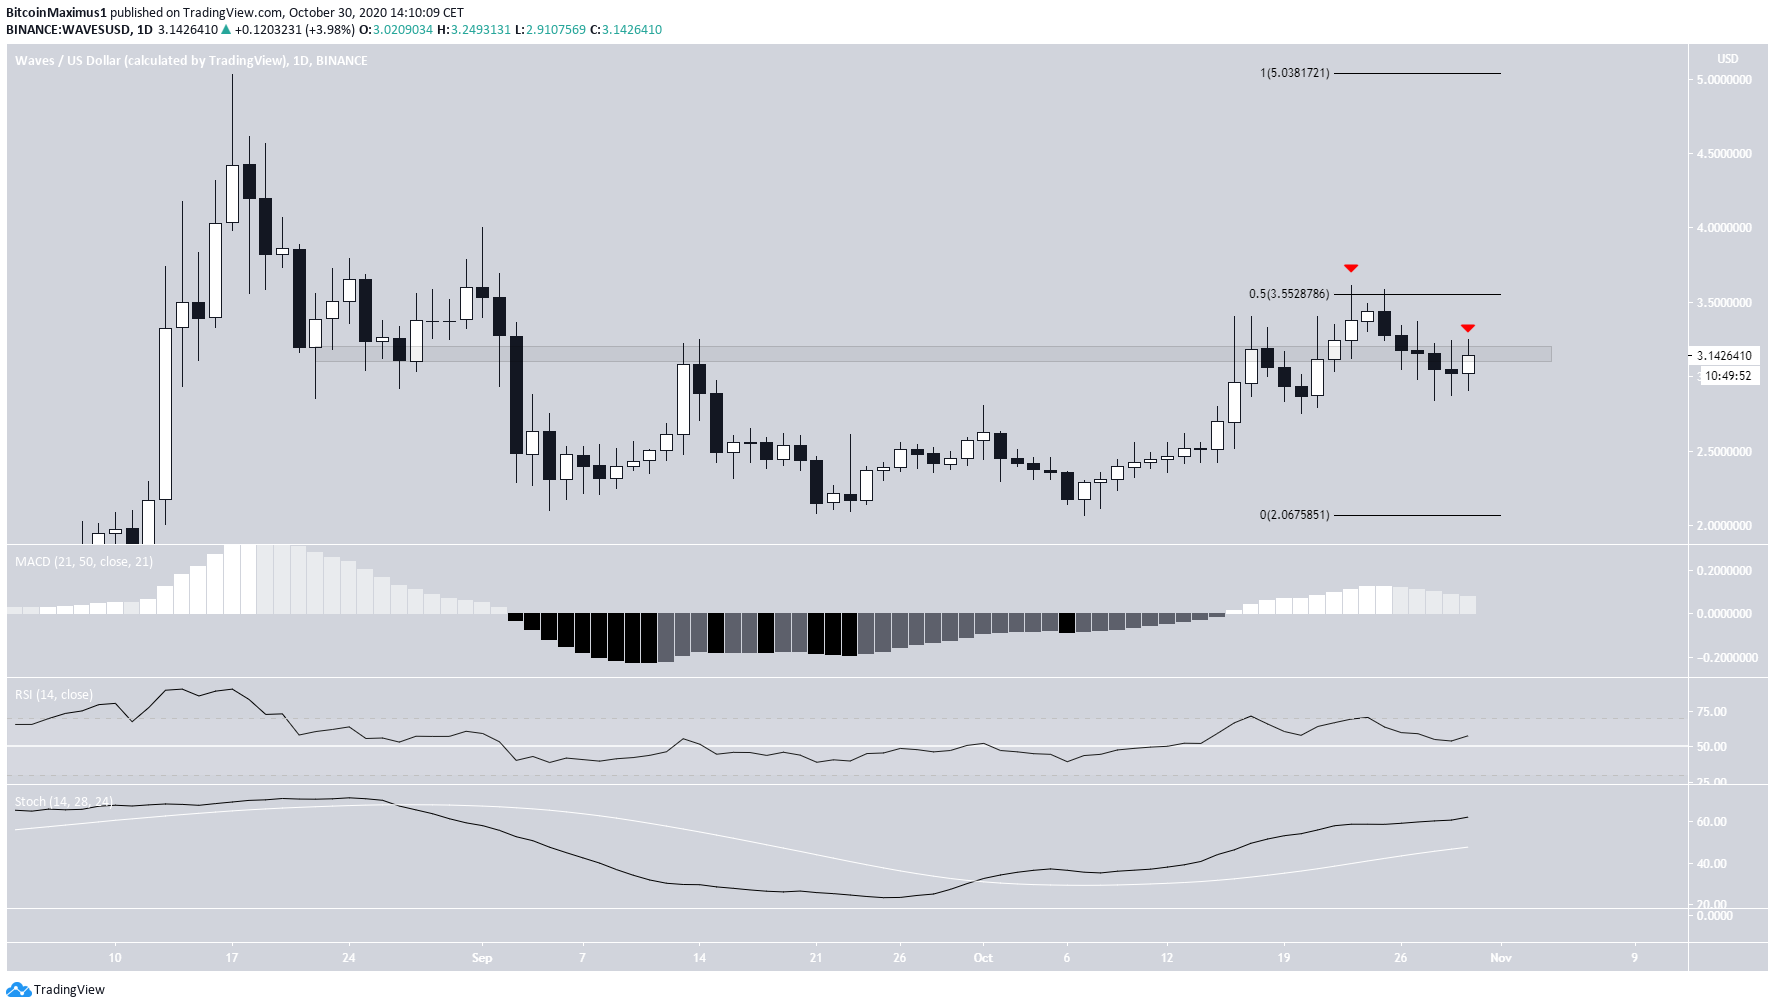
WAVES has been rallying since Sept 21, when the price reached a low of $2.07. Until now, the price has reached a high of $3.61, doing so on Oct 23.
The high was right at the 0.5 Fib level of the previous decline, a level likely to act as resistance. The price has been declining since and has also fallen below the $3.15 level, which is now likely to act as resistance.
Despite this bearish price action, technical indicators are not entirely bearish. Even though the MACD is decreasing, the Stochastic Oscillator is still increasing, and the RSI is above 50.

Short-Term Resistance
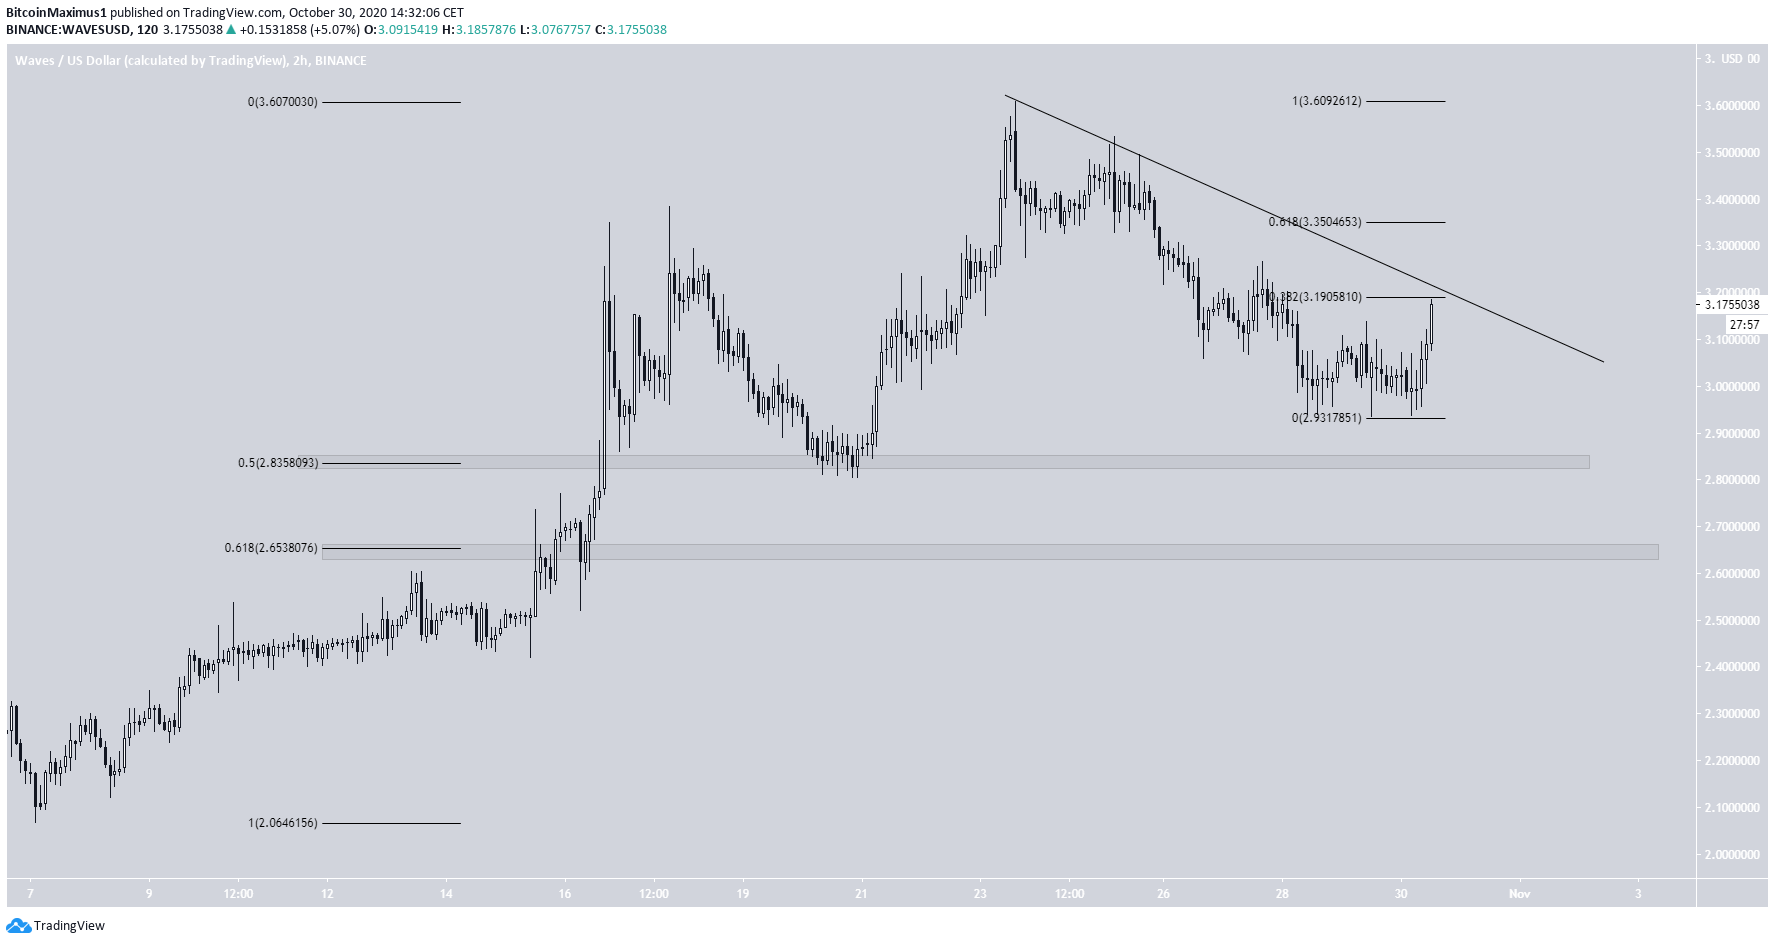
In the short-term, the price seems to be following a descending resistance line after touching the previous high on Oct 23. The line has been validated three times until now, and at the time of writing, the price was very close to validating it for the fourth time.
Furthermore, the line coincides with the 0.382 Fib level of the entire fall, strengthening its significance.
If the price falls, the closest support levels would be found at $2.83 and $2.65, the 0.5 and 0.618 Fib level of the entire previous upward move.

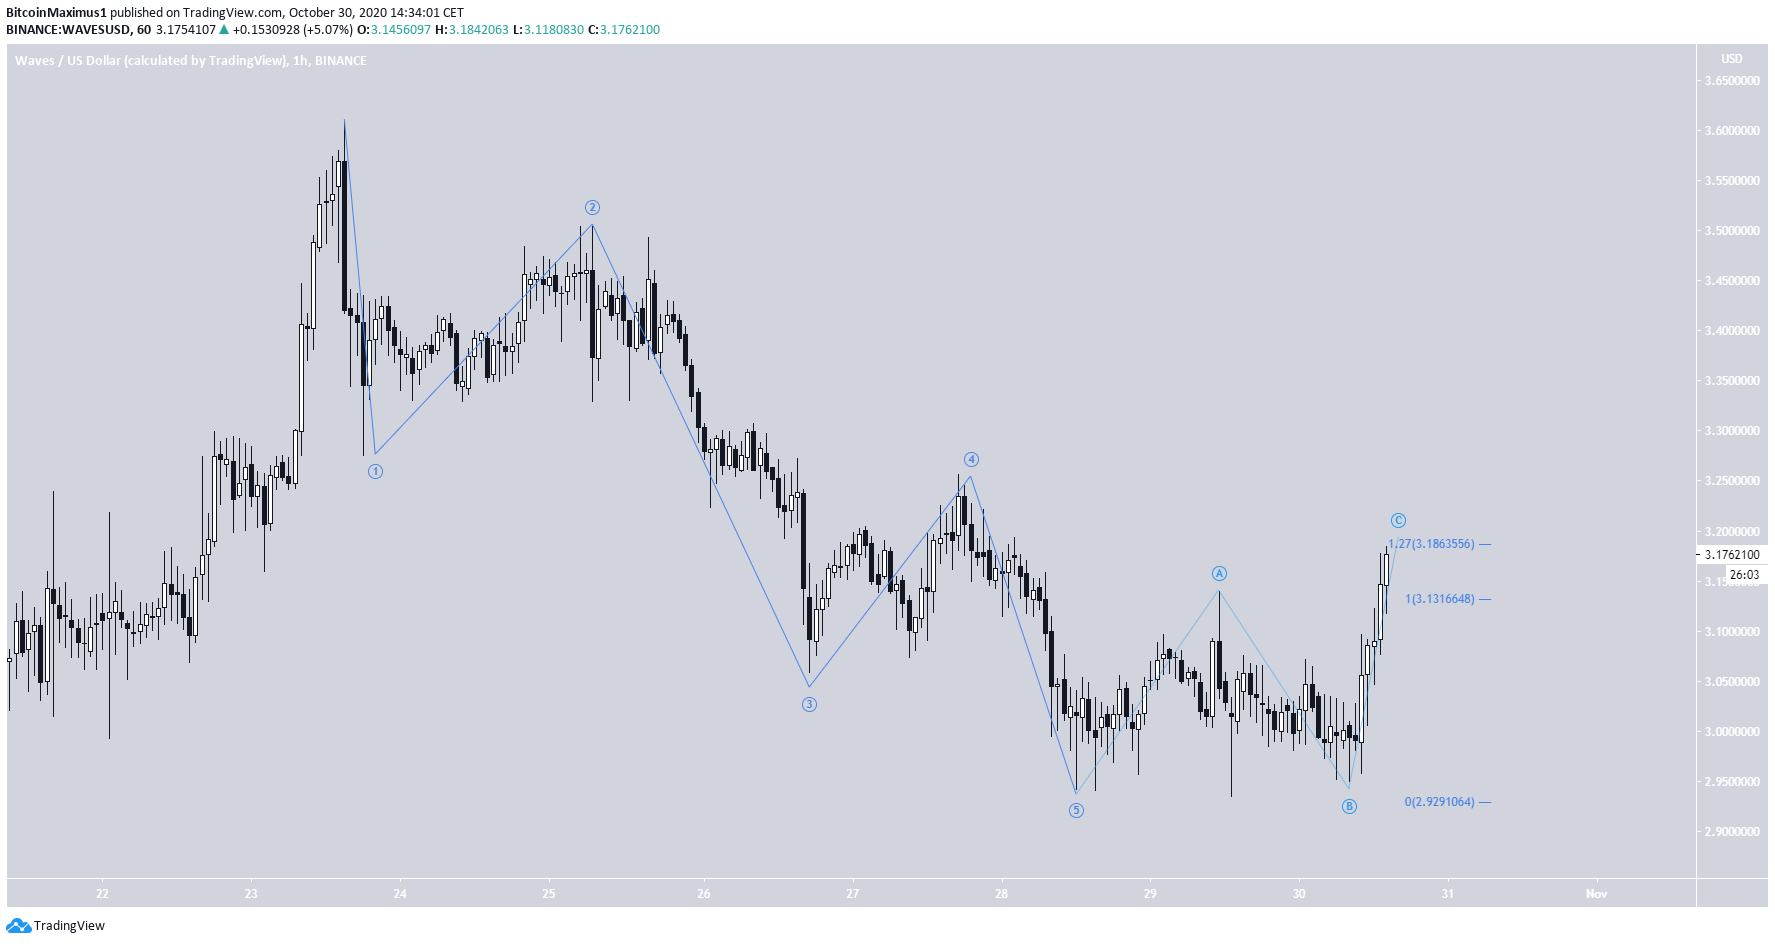
The move from the highs seems like a completed bearish impulse, and what followed was an A-B-C correction. This supports the possibility that the price will get rejected by the descending resistance line and continue its descent shortly.

Waves/BTC
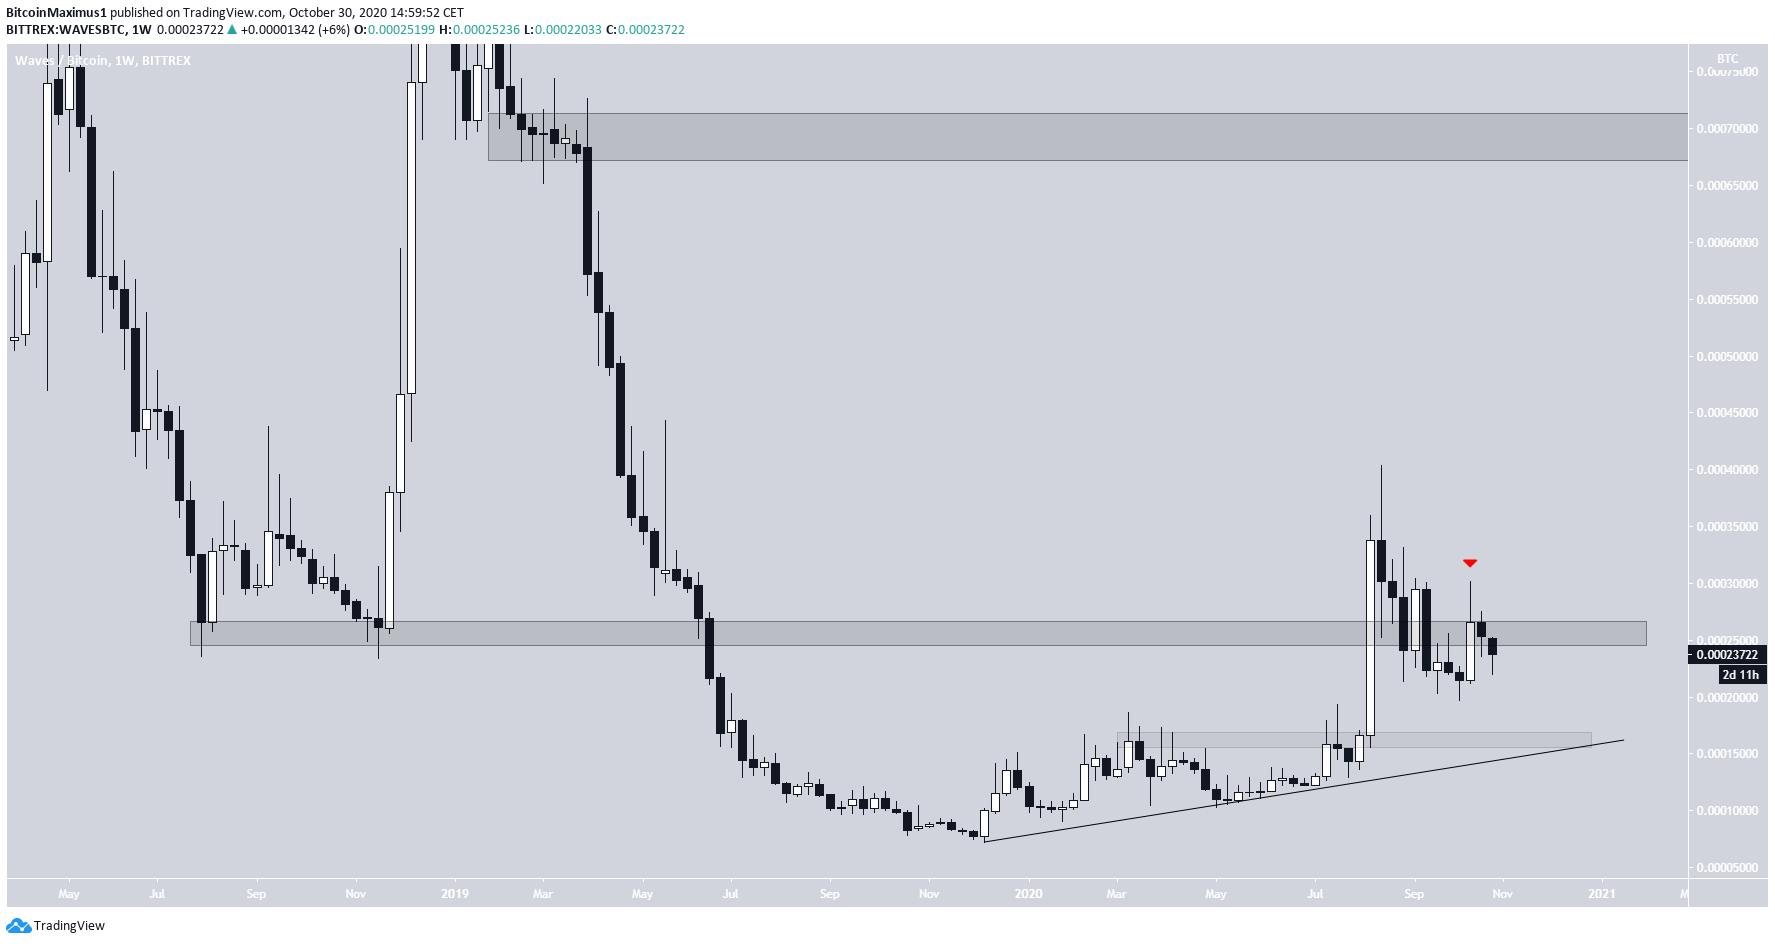
Cryptocurrency trader @CryptoCapo_ outlined a Waves chart, stating that the current support level at 23,000 satoshis is crucial since a breakdown below could trigger a rapid fall.
Conversely, if the support area holds, he predicts an extended upward move.

However, the weekly chart reveals that the price is slightly below the main support area, which is found at 25,000 satoshis and was the catalyst for a significant upward move in 2018.
While the price initially broke out above this level, it fell below shortly afterward and was then rejected, leaving a long upper wick in its wake.
If the price continues to decrease, which seems likely, the closest support level would be found at 16,000 satoshis, also coinciding with an ascending support line drawn from the Dec 2019 lows.
If the price were to break out, there is no clear resistance until 70,000 satoshis. However, this seems unlikely at the current time.

To conclude, the outlook for both WAVES/USD and WAVES/BTC seems relatively bearish, more so for the latter.
For BeInCrypto’s latest Bitcoin analysis, click here!
Disclaimer: Cryptocurrency trading carries a high level of risk and may not be suitable for all investors. The views expressed in this article do not reflect those of BeInCrypto.
The post Waves Bounces But Fails to Clear Resistance appeared first on BeInCrypto.


