Hateful Eight: MDX, RUNE, KCS, XDC, SNX, GRT, ONE, KSM – Biggest Losers July 16-23
3 min readTable of Contents
BeInCrypto takes a look at the eight altcoins that decreased the most over the past seven days, from July 16 to July 23
These altcoins are:
- Mdex (MDX) : -25.46%
- THORChain (RUNE) : -14.76%
- KuCoin Token (KCS) : -10.60%
- XinFin Network (XDC) : -10.28%
- Synthetix (SNX): -9.90%
- The Graph (GRT) : -7.82%
- Harmony (ONE) : -7.52%
- Kusama (KSM): -6.64%
MDX
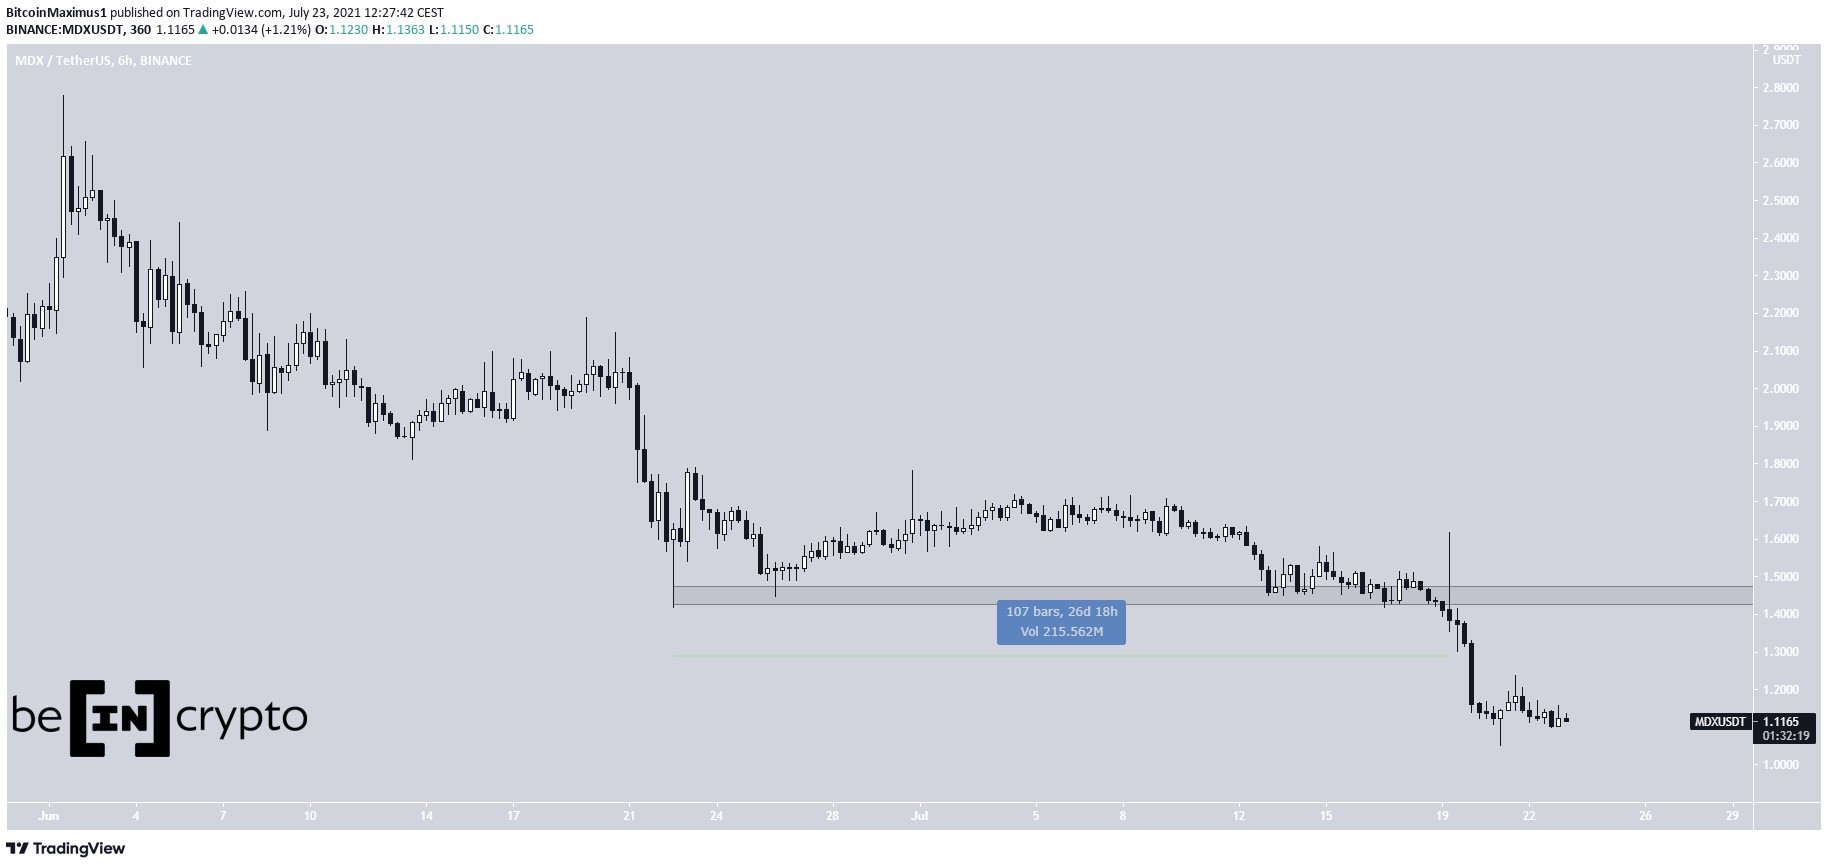
MDX has been moving downwards since June 1, when it reached an all-time high price of $2.78. The downward movement temporarily halted on June 22, once a low of $1.41 was reached.
MDX consolidated above this level for 27 days, before finally breaking down. It proceeded to reach a new all-time low price of $1.05 on July 21.
While MDX has bounced slightly, it is not showing any clear bullish reversal signs. The main resistance area is at $1.45.
RUNE
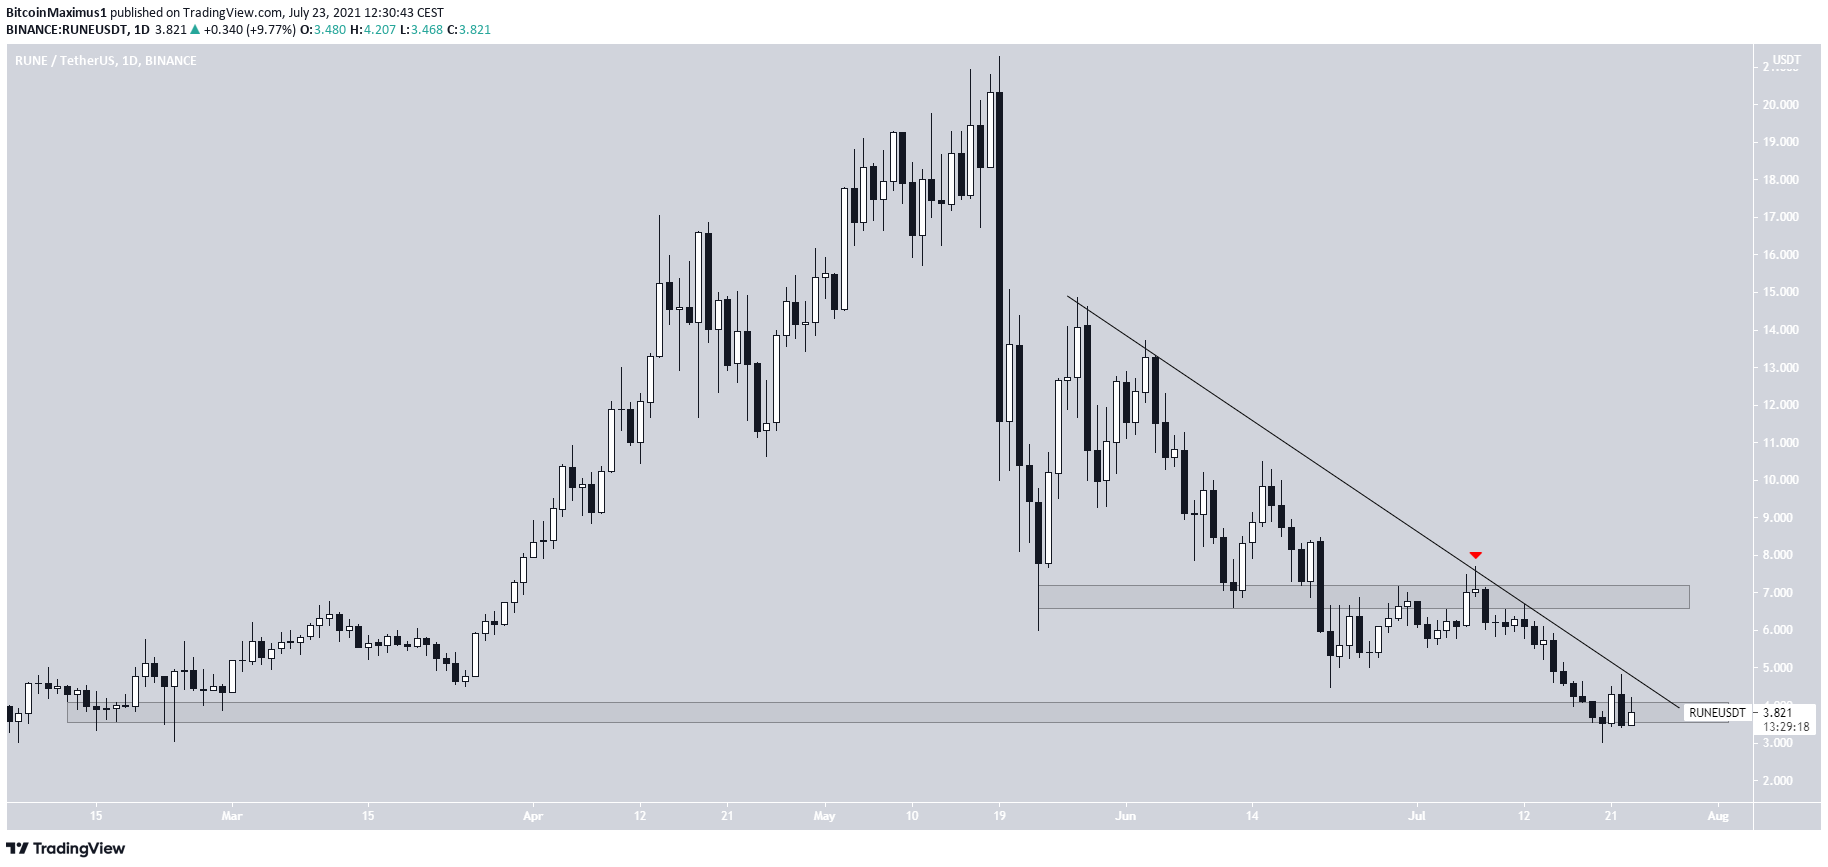
RUNE has been decreasing since July 7, when it was rejected by the $7 resistance area.
So far, it has reached a low of $3.01, doing so on July 20. However, it bounced immediately and is now trading inside the $3.80 horizontal support area.
Despite the bounce, RUNE is still following a descending resistance line. The trend cannot be considered bullish until a breakout above this line transpires.
KCS
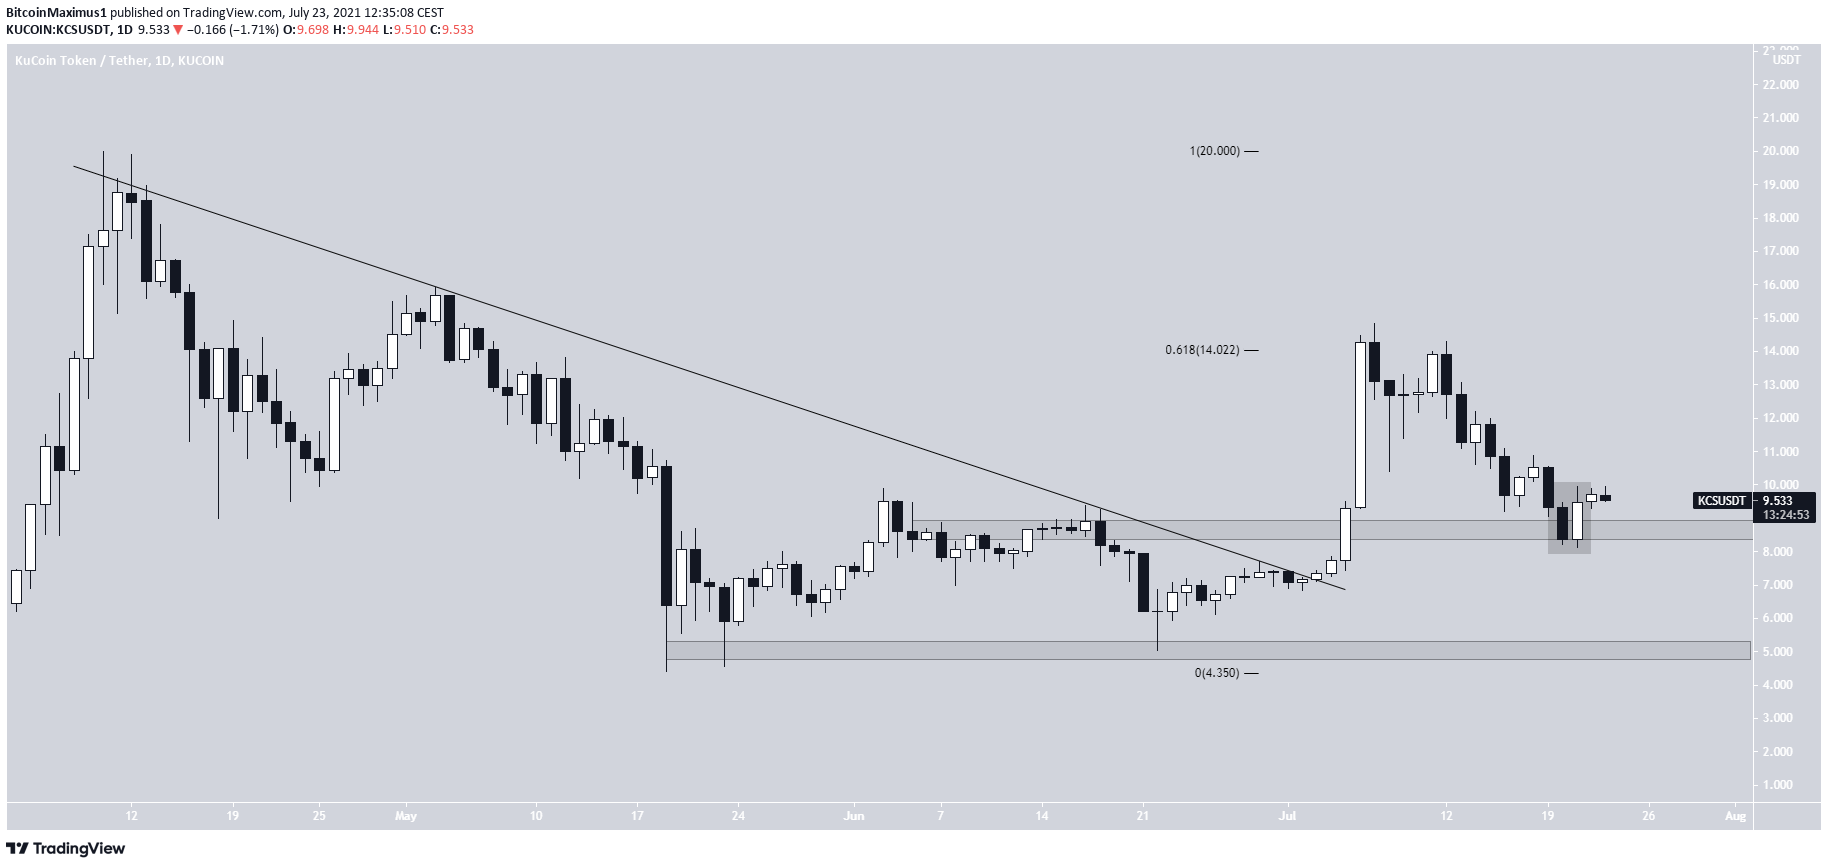
KCS has been moving downwards since July 7, when it reached a high of $14.84. The high was made just slightly above the 0.618 Fib retracement resistance level.
The ensuing drop caused the token to validate the $8.60 horizontal support area on July 20. KCS created a bullish engulfing candlestick the next day.
As long as the token manages to hold this support area, the trend can be considered bullish. Conversely, a breakdown below this area would likely cause a revisit of the $5 horizontal support area.
XDC
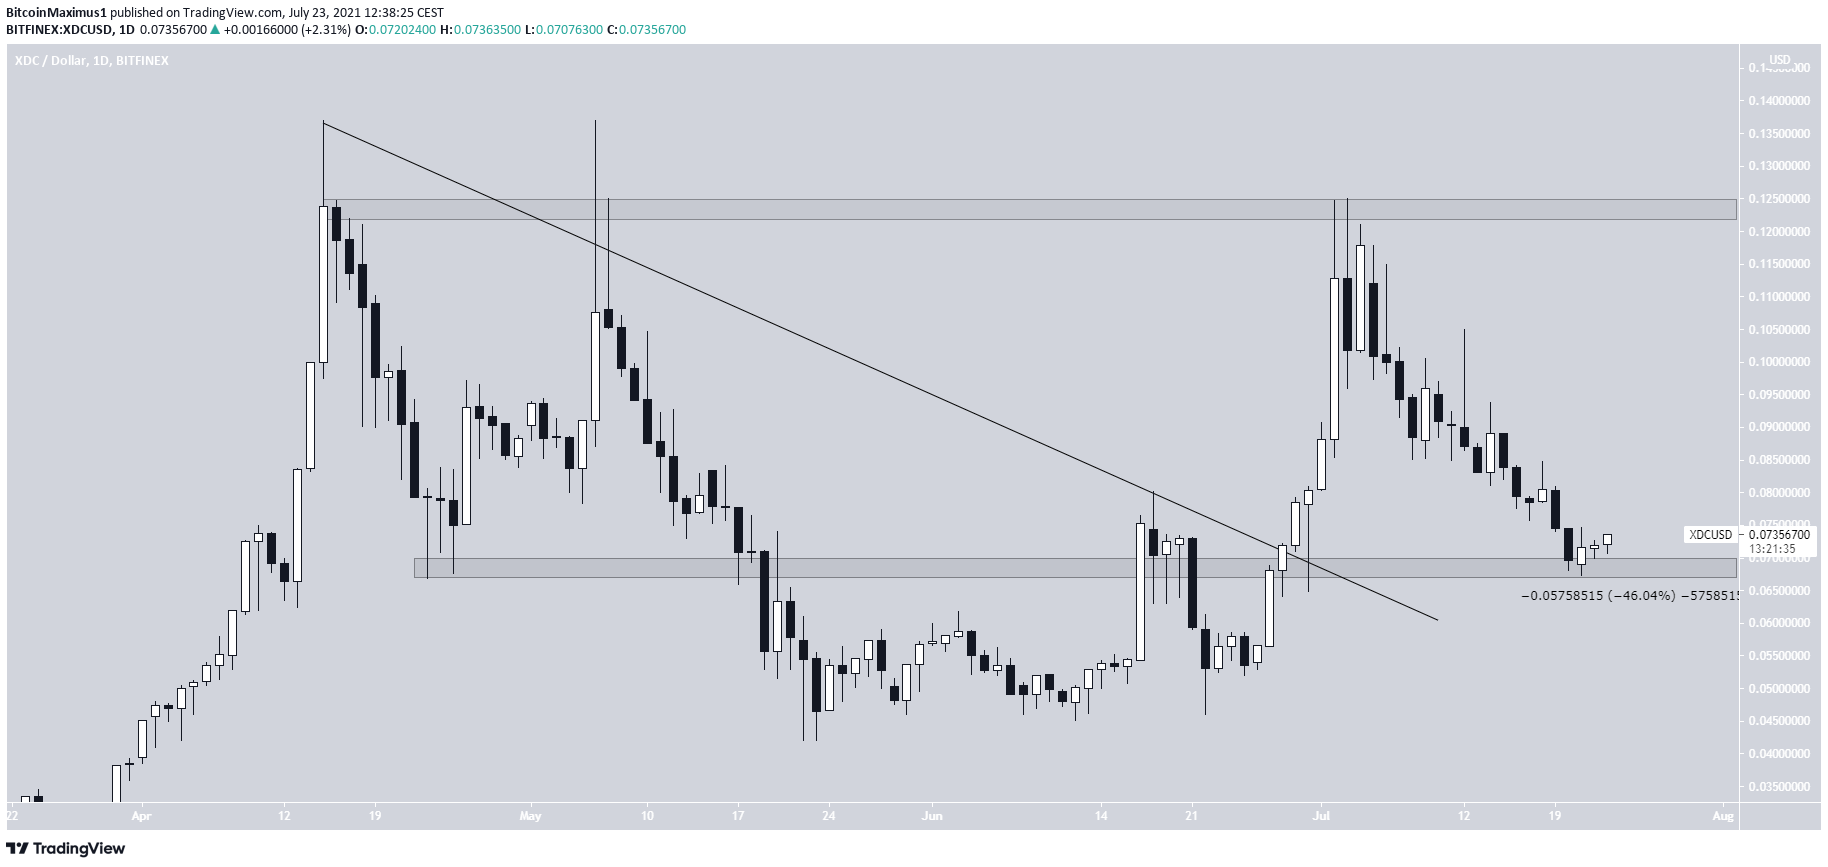
XDC has been moving downwards since July 3, when it was rejected by the $0.123 horizontal resistance area.
The descent continued until XDC bounced at the $0.068 horizontal support area on July 20. This amounted to a decrease of 46%.
XDC has bounced slightly, but has not shown any bullish reversal signs.
SNX
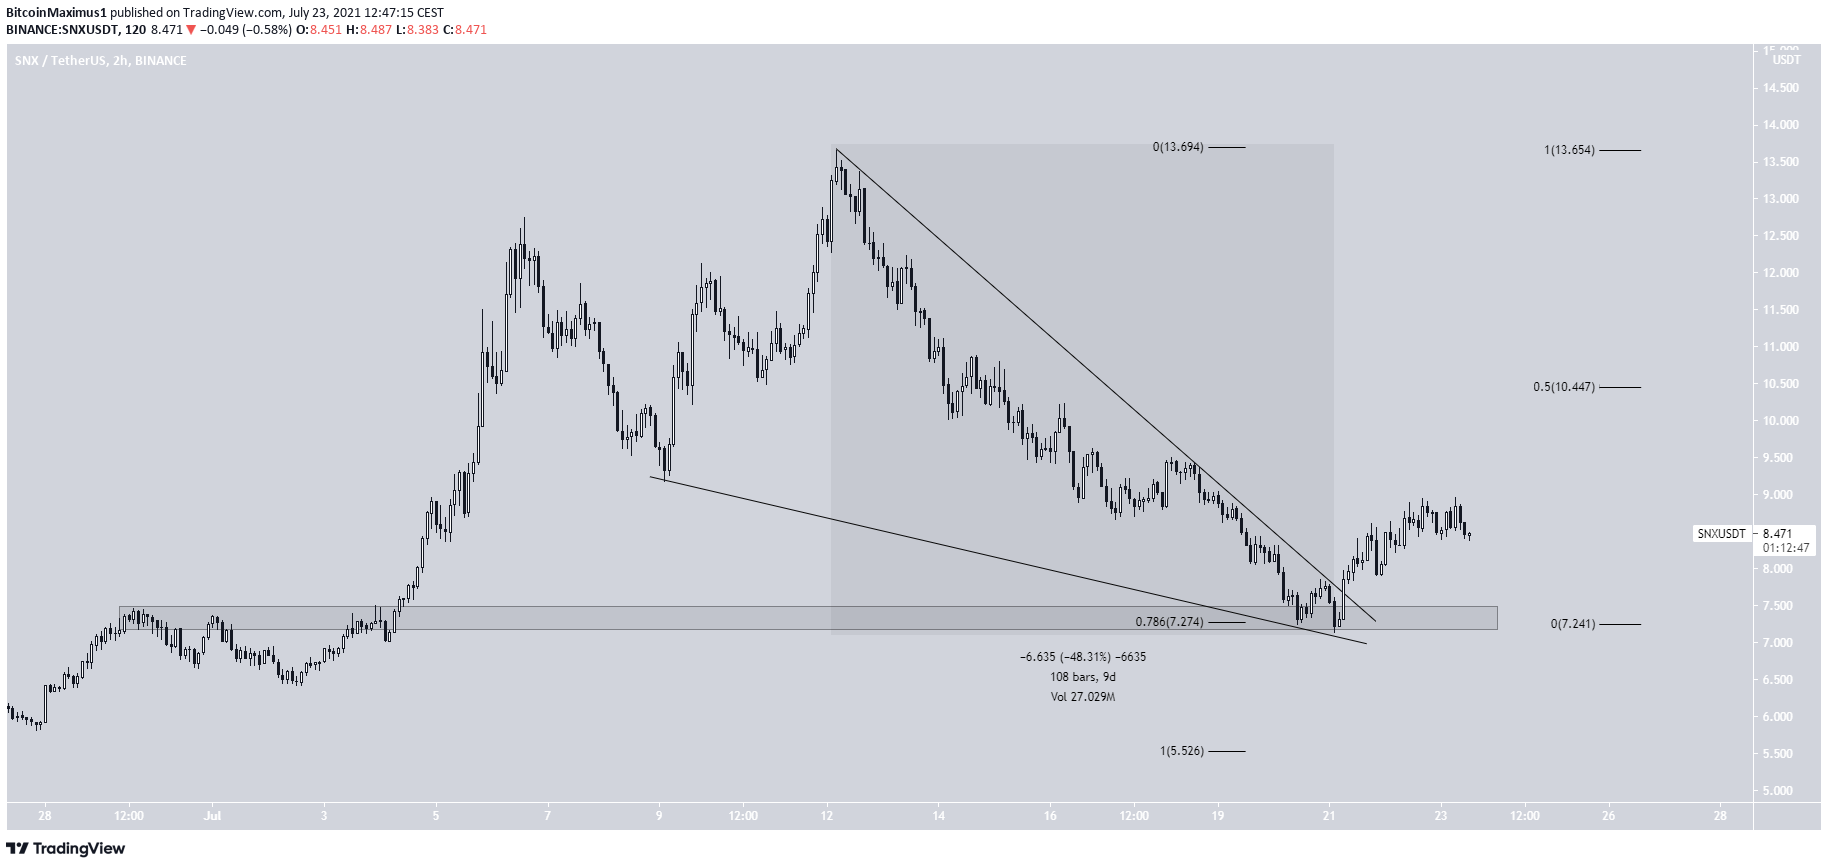
SNX has been moving downwards inside a descending wedge since July 12, when it reached a high of $13.65. The downward movement continued for 9 days, in which the token lost 49% of its value.
On July 22, SNX bounced at the $7.25 horizontal support area, which is also the 0.786 Fib retracement support level.
It broke out shortly afterwards and has been moving upwards since.
The closest resistance is at $10.45, the 0.5 Fib retracement resistance level.
GRT
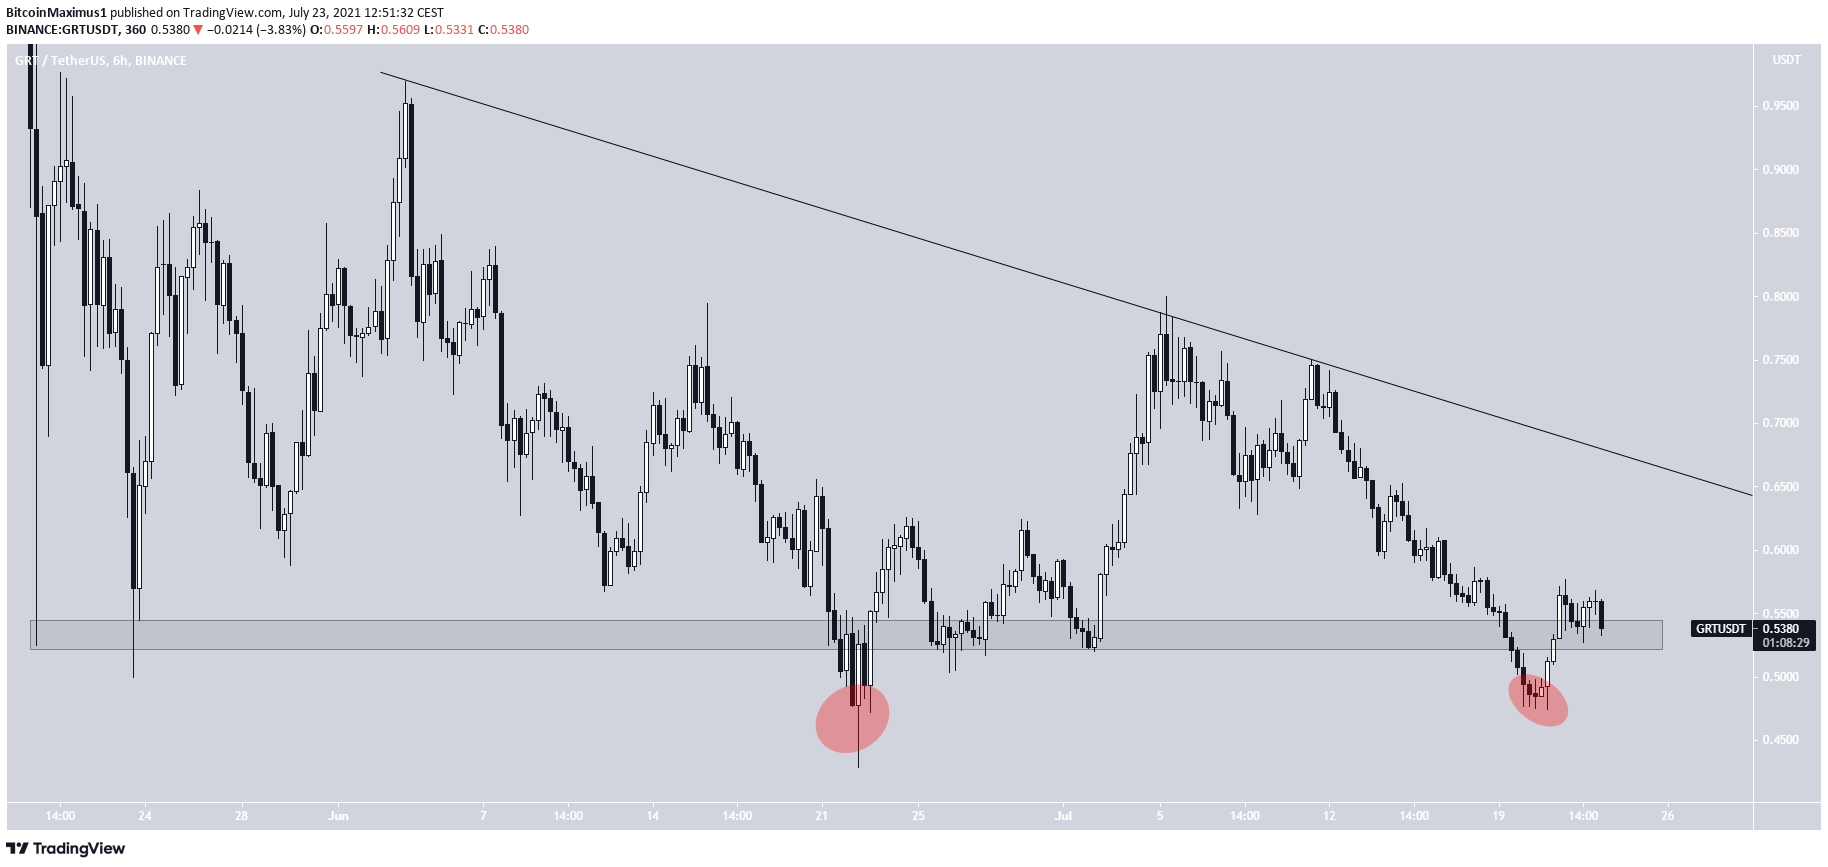
GRT has been trading above the $0.53 horizontal support area since May 22. While the area has caused numerous bounces, GRT twice seemed to break down below it, on June 21 and July 20.
However, the token reclaimed the support area both times, initiating a significant upward movement the first time it did so. It has yet to begin increasing after reclaiming the area for the second time.
GRT is also following a descending resistance line that is currently at $0.64.
ONE
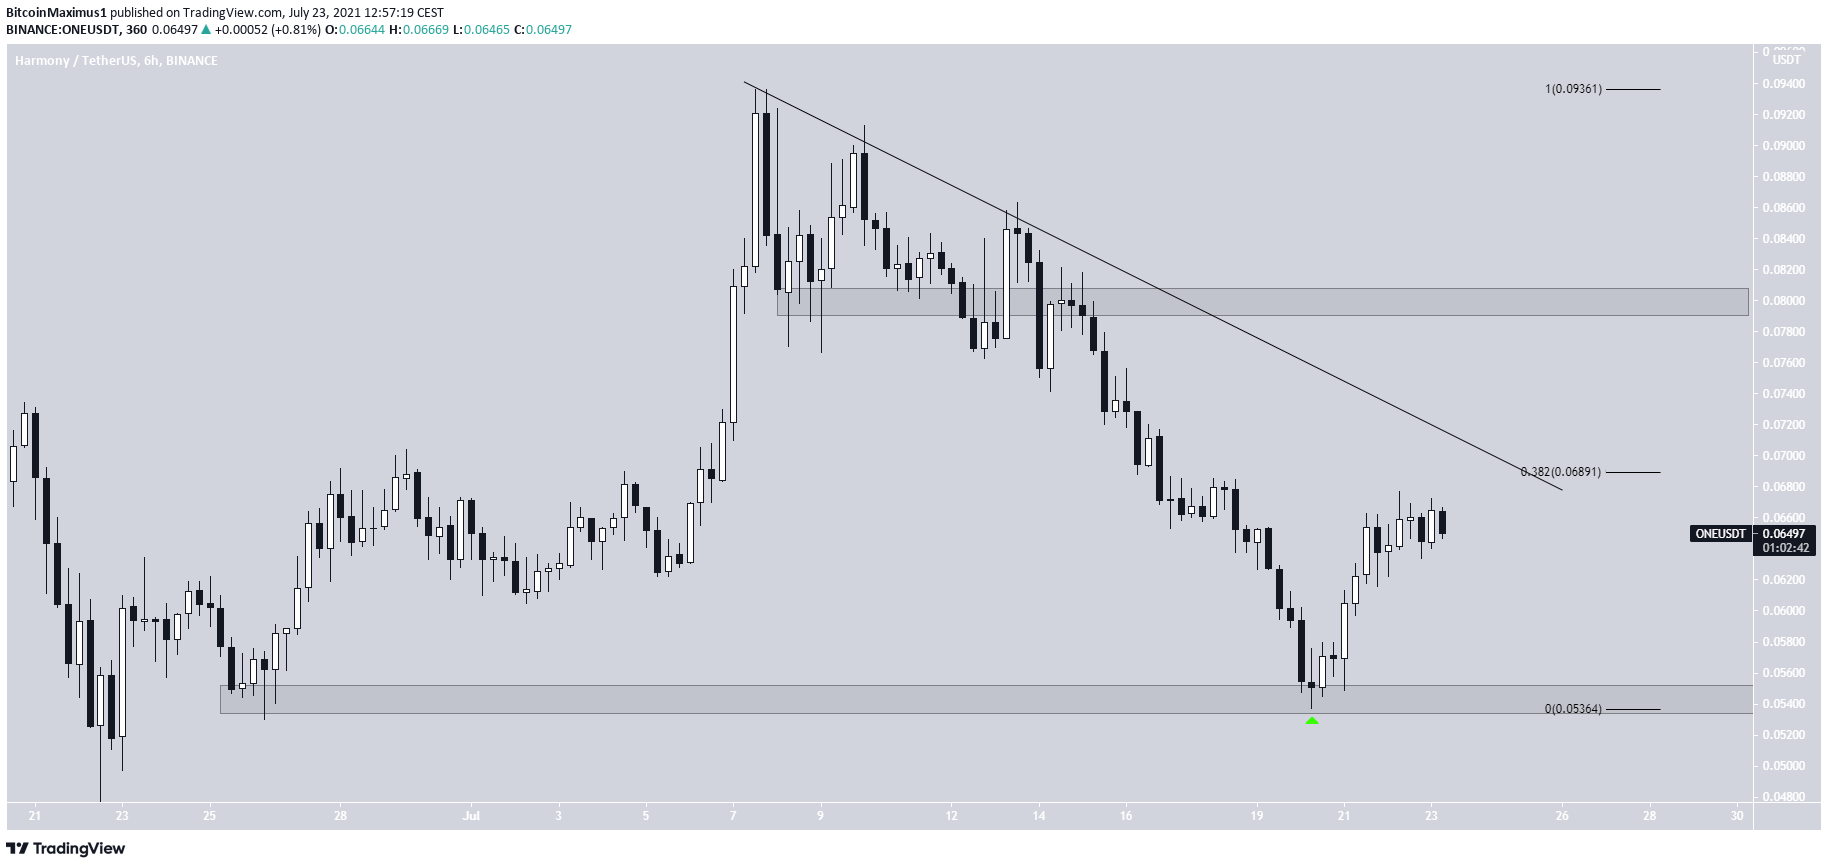
ONE has been decreasing alongside a descending resistance line since July 7, when it reached a high of $0.093. The downward movement continued until a low of $0.053 was reached on July 20 (green icon).
The ensuing bounce validated the $0.054 area as support.
ONE has been moving upwards since, but is still trading below the descending resistance line, which now coincides with the 0.382 Fib retracement resistance level at $0.068.
A breakout could cause an upward movement towards the $0.80 region.
KSM
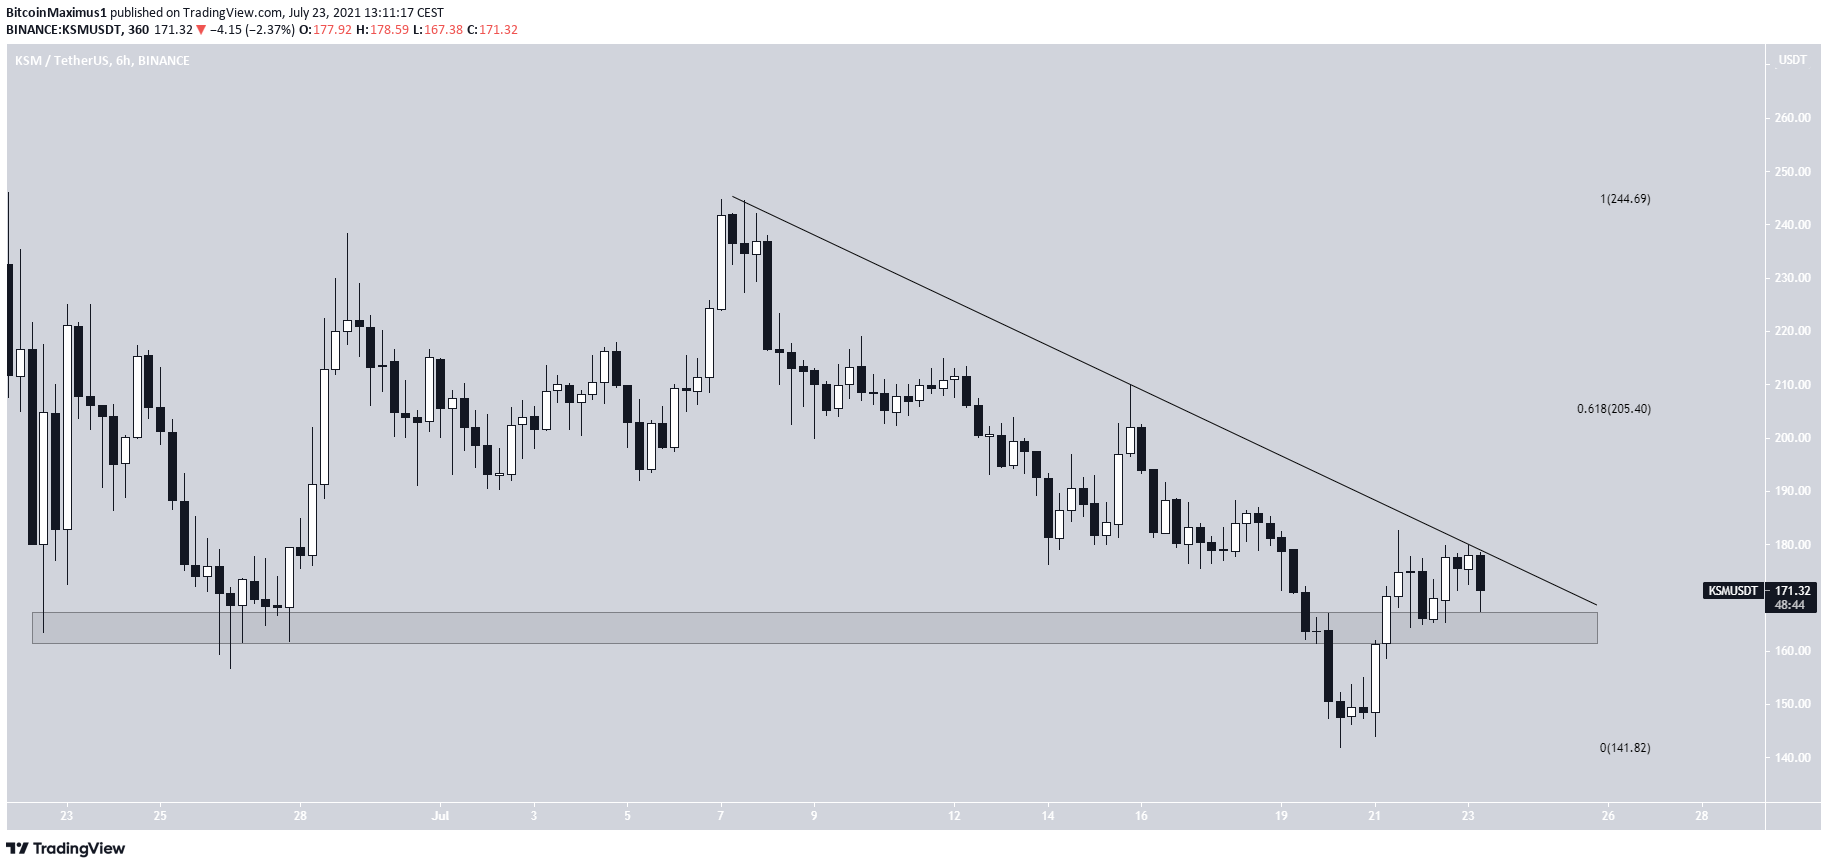
On July 20, KSM reached a low of $142. This purportedly caused a breakdown below the $165 support area.
However, the token reclaimed the level shortly afterwards.
Currently, it is attempting to break out from a descending resistance line that has been in place since July 7.
Doing so would likely take it towards the 0.618 Fib retracement resistance level at $205.
For BeInCrypto’s latest BTC (BTC) analysis, click here.
The post Hateful Eight: MDX, RUNE, KCS, XDC, SNX, GRT, ONE, KSM – Biggest Losers July 16-23 appeared first on BeInCrypto.


![Decentraland: Review & Beginner's Guide [current_date format=Y] 41 Decentraland: Review & Beginner's Guide](https://cryptheory.org/wp-content/uploads/2020/11/decentraland-02-gID_7-300x150.jpg)