Stellar (XLM) Pumps But Fails to Clear Long-Term Resistance
2 min readTable of Contents
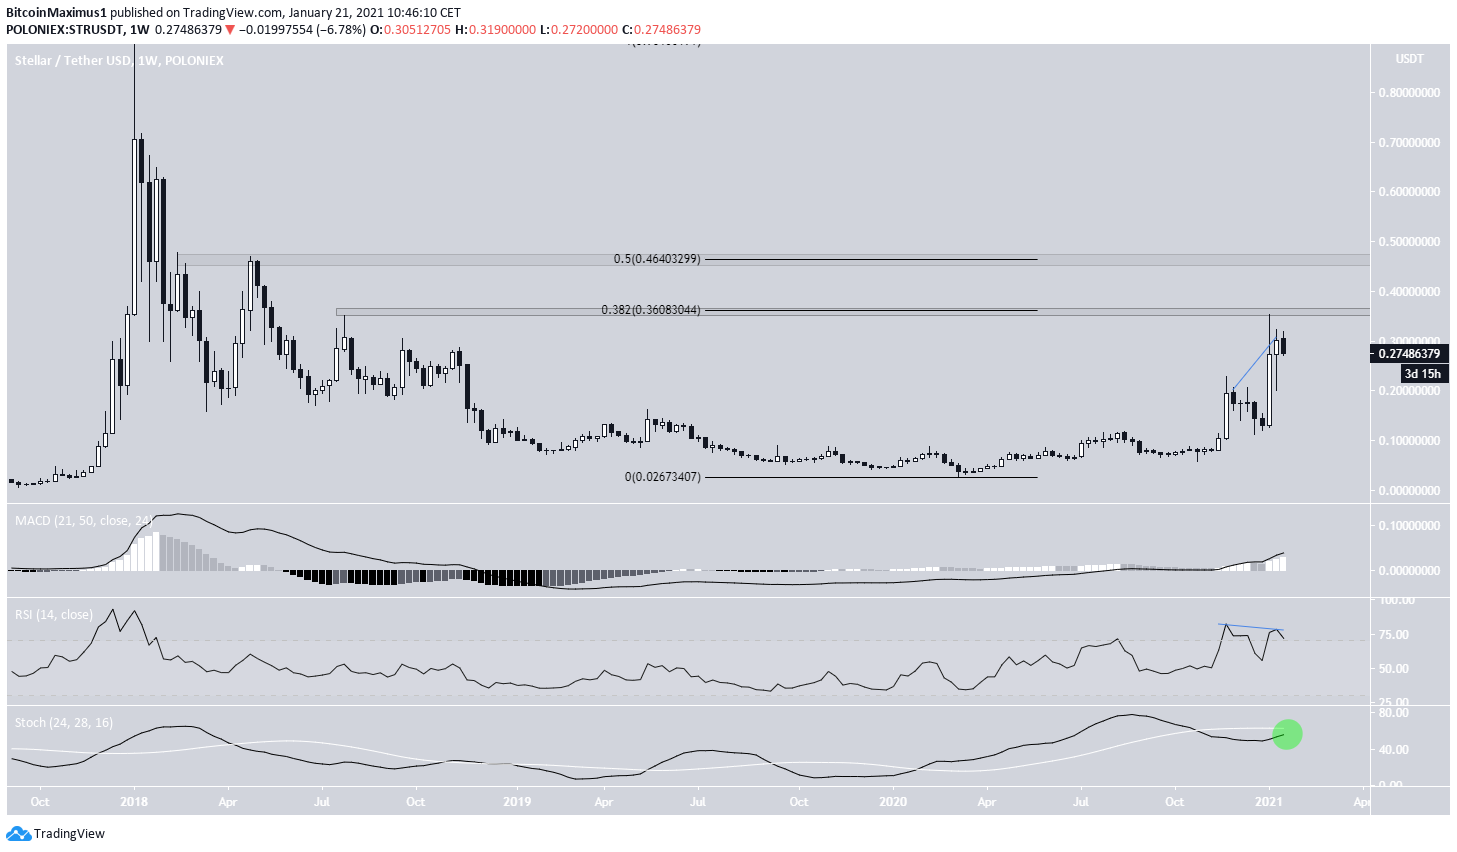
The Stellar Lumens (XLM) price has been moving upwards at an accelerated pace since the beginning of November 2020 but has failed to clear a crucial resistance area.
While short-term bounces could occur while XLM is trading above $0.267, it appears that XLM has yet to complete its correction.
XLM Long-Term Resistance
XLM has been moving upwards since the beginning of March 2020. The upward movement accelerated in November 2020 and proceeded to reach a high of $0.35 on Jan. 6.
However, XLM was rejected by the $0.36 resistance area, which is the 0.382 Fib retracement of the entire downward move from the all-time high price.
Technical indicators provide a mixed outlook. The MACD is above 0 and increasing, while the RSI has generated bearish divergence and is falling.
The Stochastic oscillator is increasing but has yet to make a bullish cross (shown with the green circle). Therefore, a look at lower time-frames is required in order to better estimate its future movement.
Future Movement
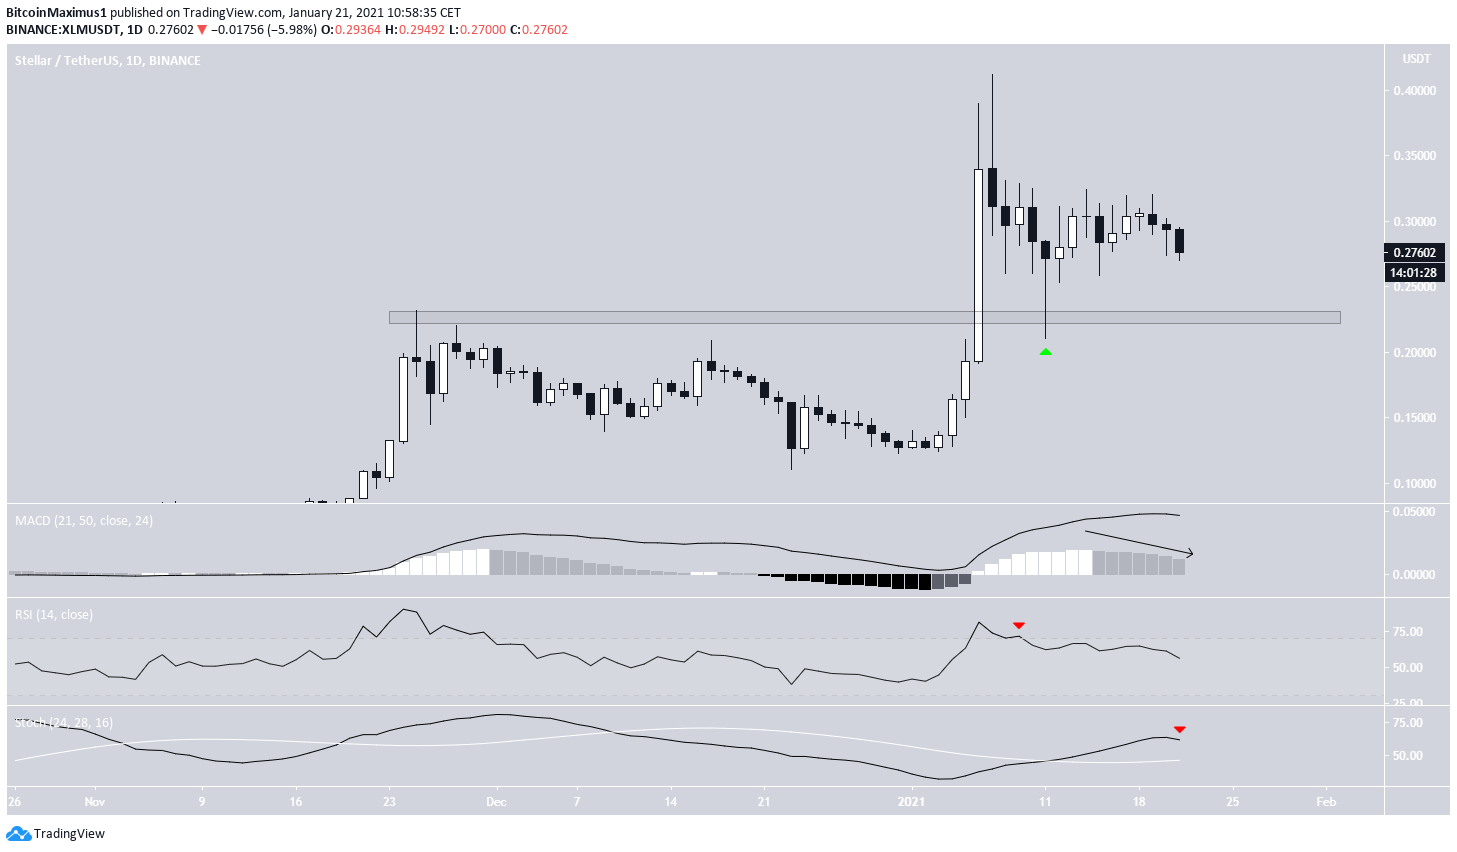
The daily chart shows a support area at $0.225, which has been validated in the form of a long lower wick on Jan. 12.
However, technical indicators are bearish. The MACD has nearly crossed into negative territory, the Stochastic oscillator is falling, and the RSI has dropped below 70.
A bearish Stochastic cross and a MACD cross into negative territory would likely confirm that the trend is bearish.
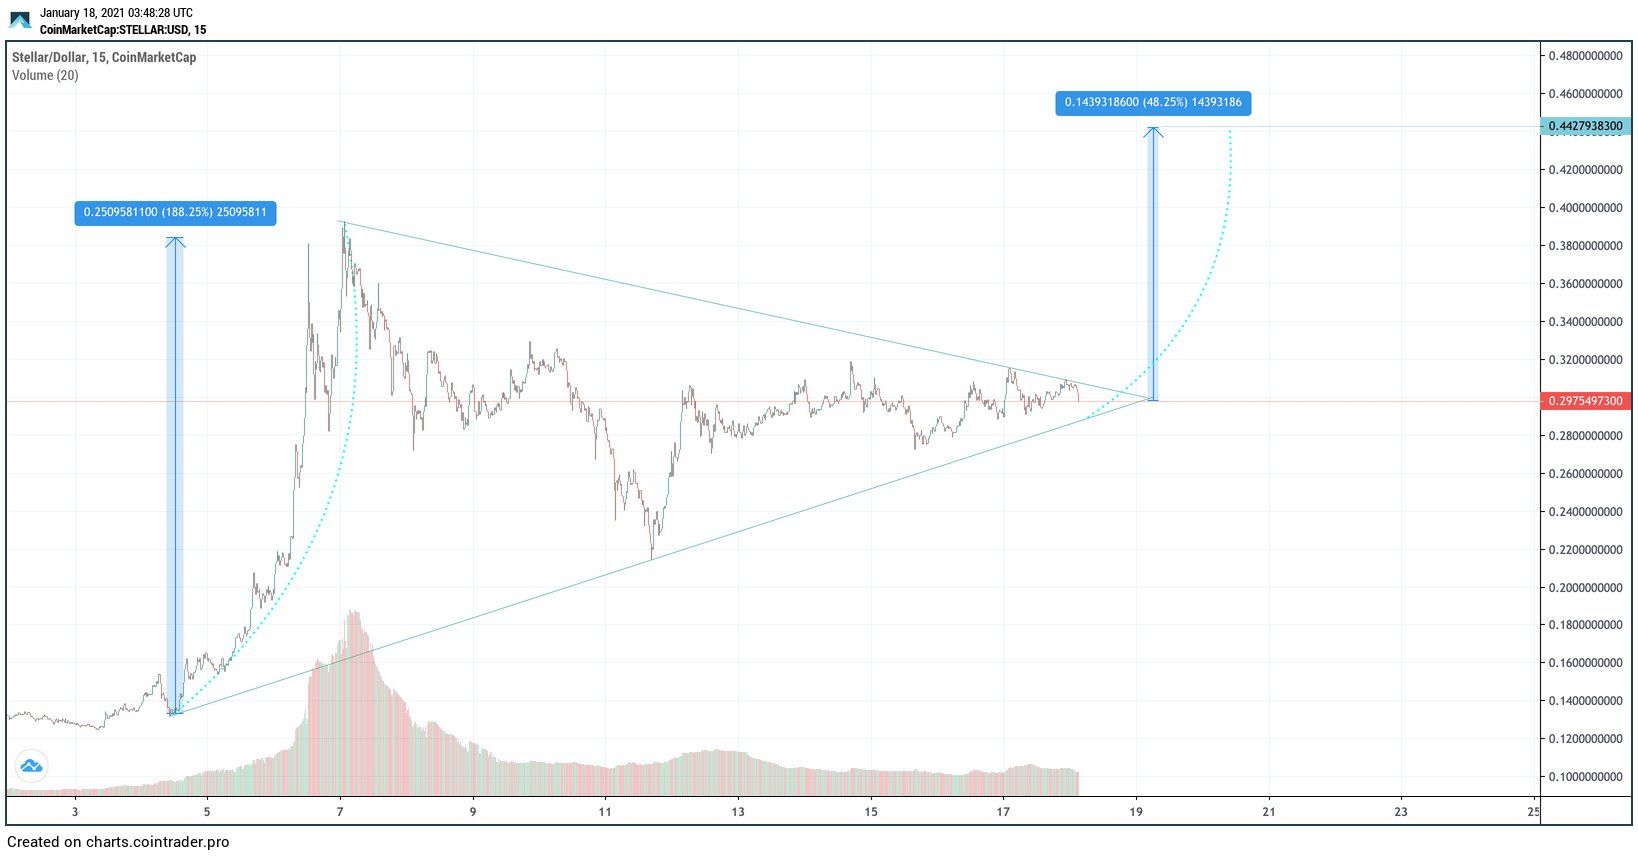
Cryptocurrency trader @IholdBitcoin stated that XLM is likely to begin another upward move soon once if it breaks out from the current symmetrical triangle.
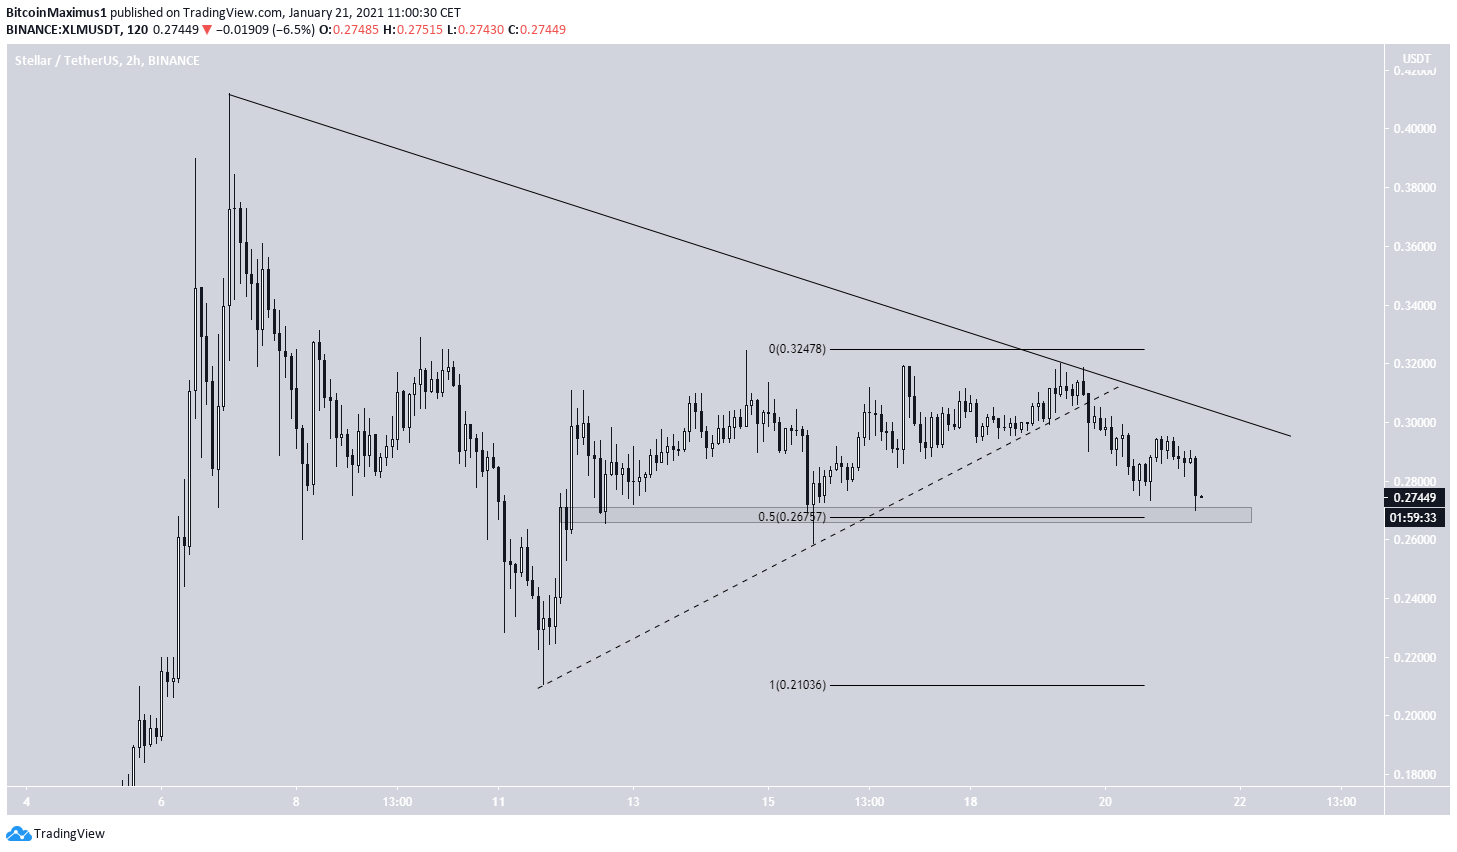
However, XLM has broken down from the support line of the triangle (dashed) since the tweet.
XLM is still trading above the 0.5 Fib retracement support at $0.267, so the possibility of a short-term bounce remains.
Nevertheless, it does seem that the long-term trend is bearish.
Wave Count
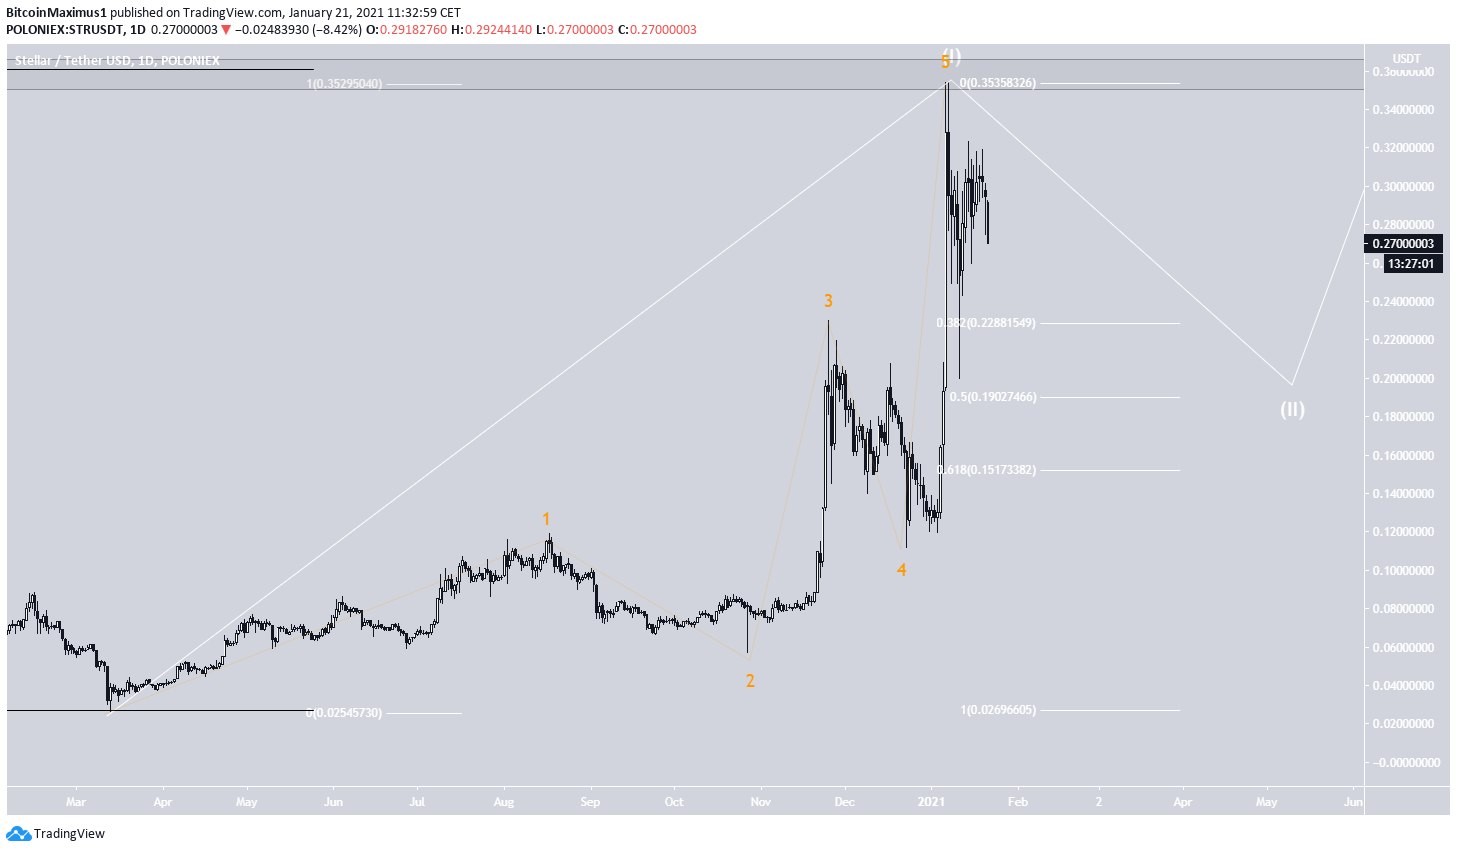
The wave count suggests that XLM has completed wave 1 of a long-term bullish impulse (shown in white), which began with the March lows.
The sub-wave count (orange) shows that this is a leading diagonal since sub-wave 4 entered into sub-wave 1 territory.
If correct, the price has begun its corrective second wave, which could end at either the 0.382, 0.5, or 0.618 Fib retracement levels ($0.22, $0.19, and $0.15 respectively).
The latter two levels are more commonly reached in second waves and are also horizontal support levels.
Conclusion
While XLM could bounce in the short-term to validate the resistance line near $0.30, it seems that it has yet to complete its correction.
A breakout from the resistance line would likely invalidate this possibility and suggest that the price is heading higher.
For BeInCrypto’s latest Bitcoin (BTC) analysis, click here!
The post Stellar (XLM) Pumps But Fails to Clear Long-Term Resistance appeared first on BeInCrypto.


![Decentraland: Review & Beginner's Guide [current_date format=Y] 32 Decentraland: Review & Beginner's Guide](https://cryptheory.org/wp-content/uploads/2020/11/decentraland-02-gID_7-300x150.jpg)