ADA Prevents Breakdown With Bounce At Long-Term Support Line
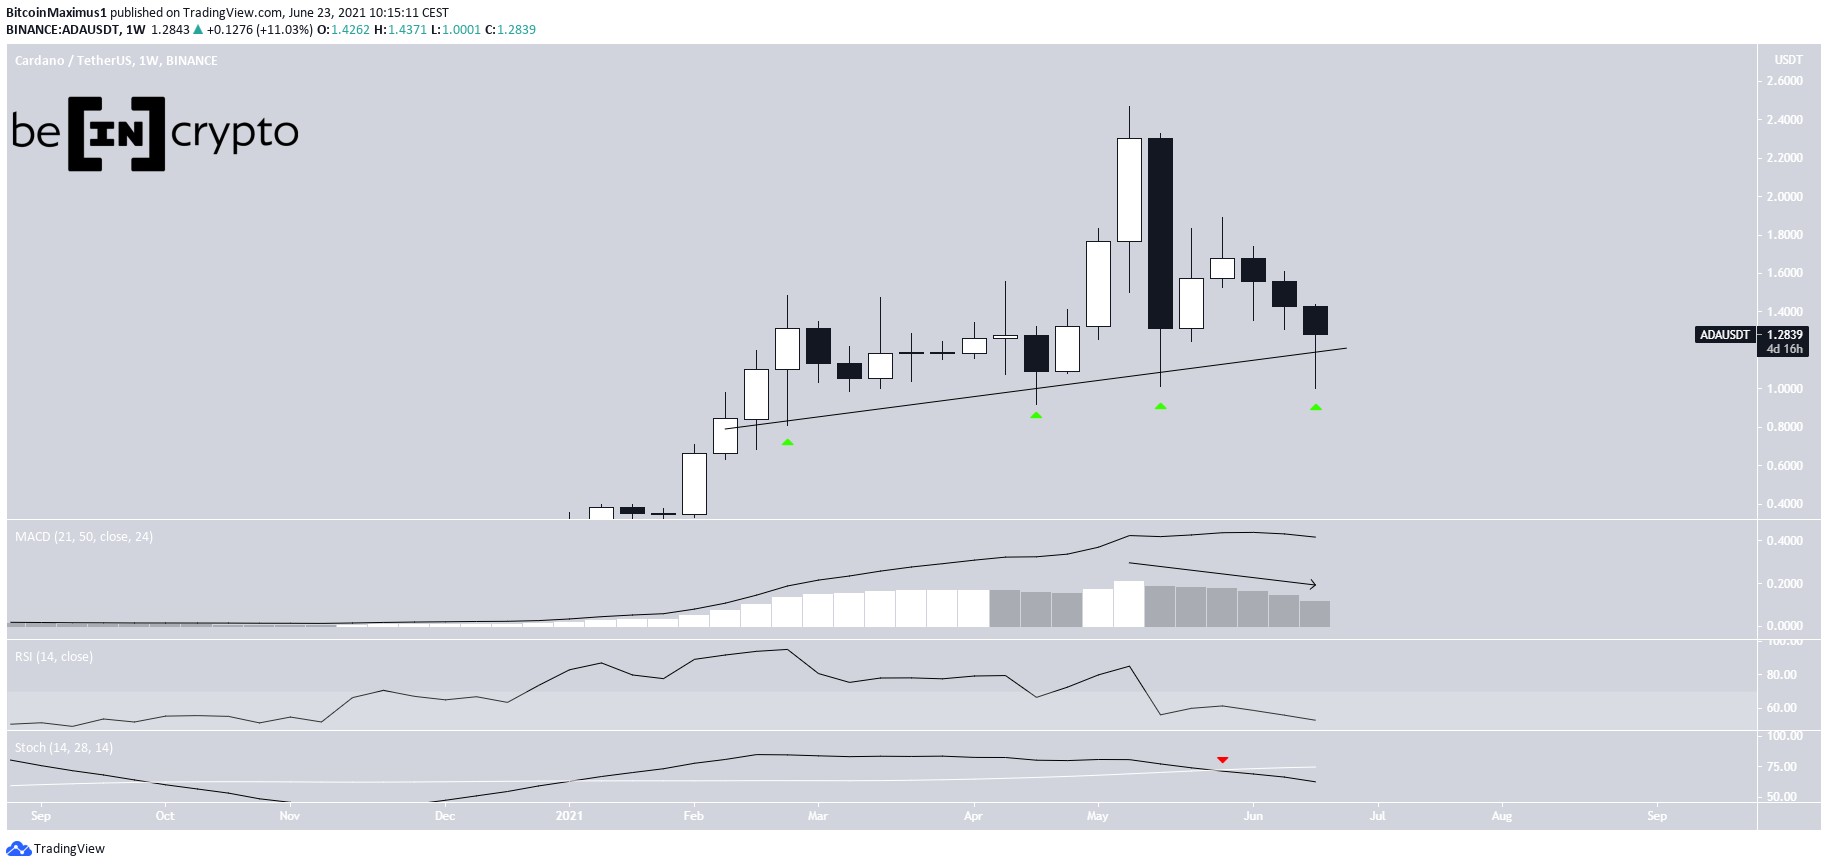
2 min readCardano (ADA) has been decreasing since May 16 but bounced at a long-term ascending support line on June 22.
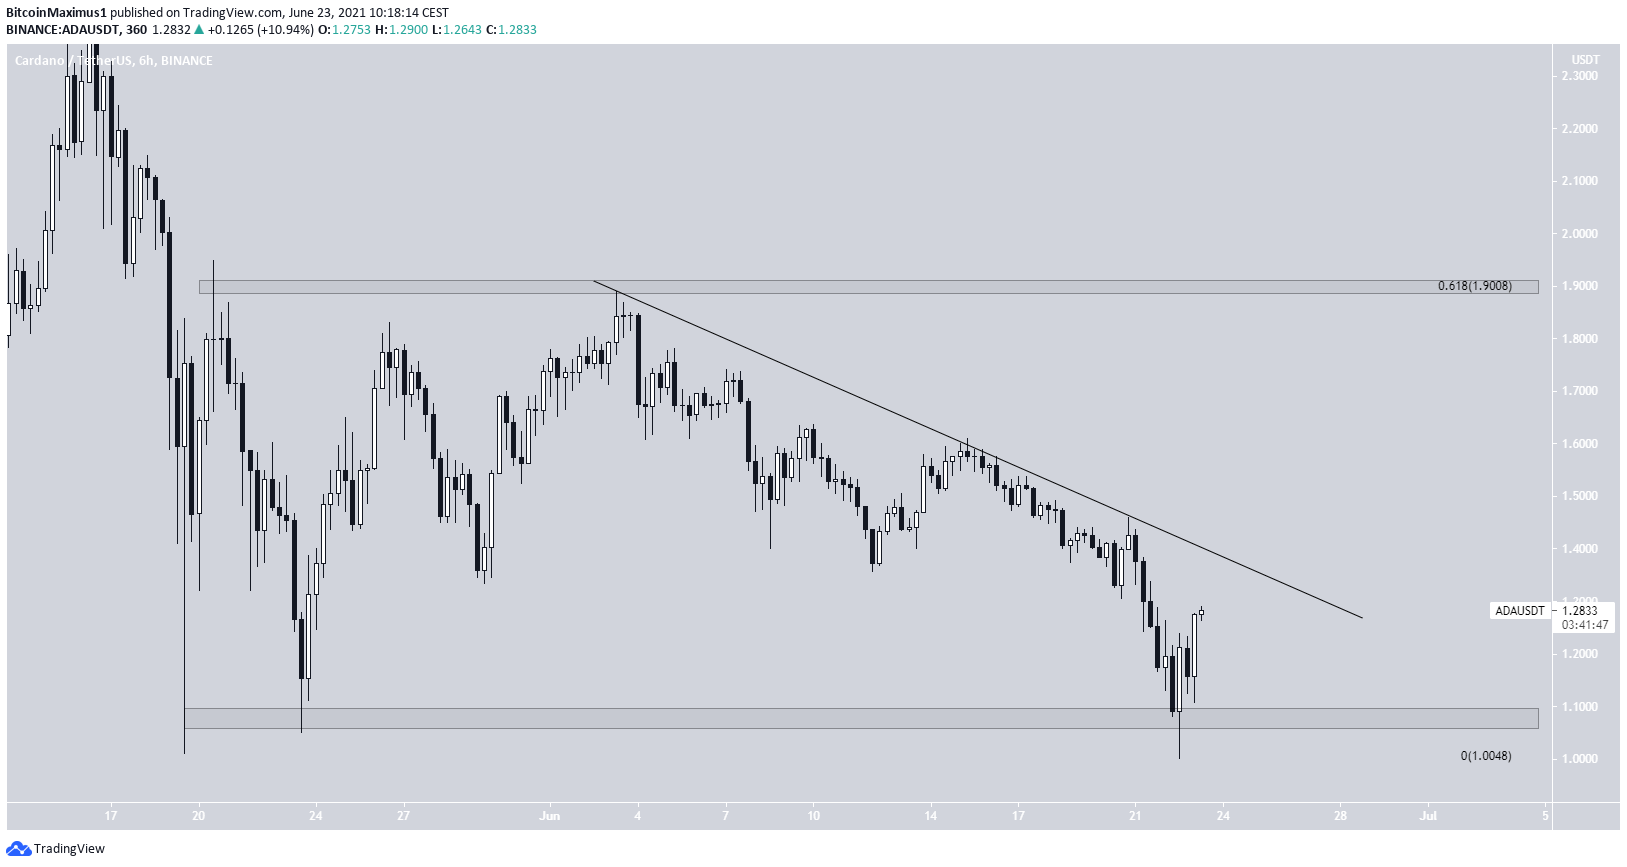
It is following a short-term descending resistance line, a breakout from which could take it towards the $1.90 resistance area.
Long-term ADA drop
ADA has been falling since reaching an all-time high of $2.47 on May 16.
On June 22, it reached a low of $1 and bounced. The low served to validate an ascending support line for the fourth time (green icons).
However, despite the bounce, technical indicators are still bearish. The Stochastic oscillator has made a bearish cross (red icon), the MACD has given a bearish reversal signal and the RSI is falling. This is a sign that the long-term trend is still bearish.
Current movement
The shorter-term six-hour chart shows a potential triple bottom pattern made at the $1.08 horizontal support area. In addition, it shows a descending resistance line that has been in place since June 3.
A breakout from the line would take ADA towards the $1.90 resistance area, which is the 0.618 Fib retracement resistance level.
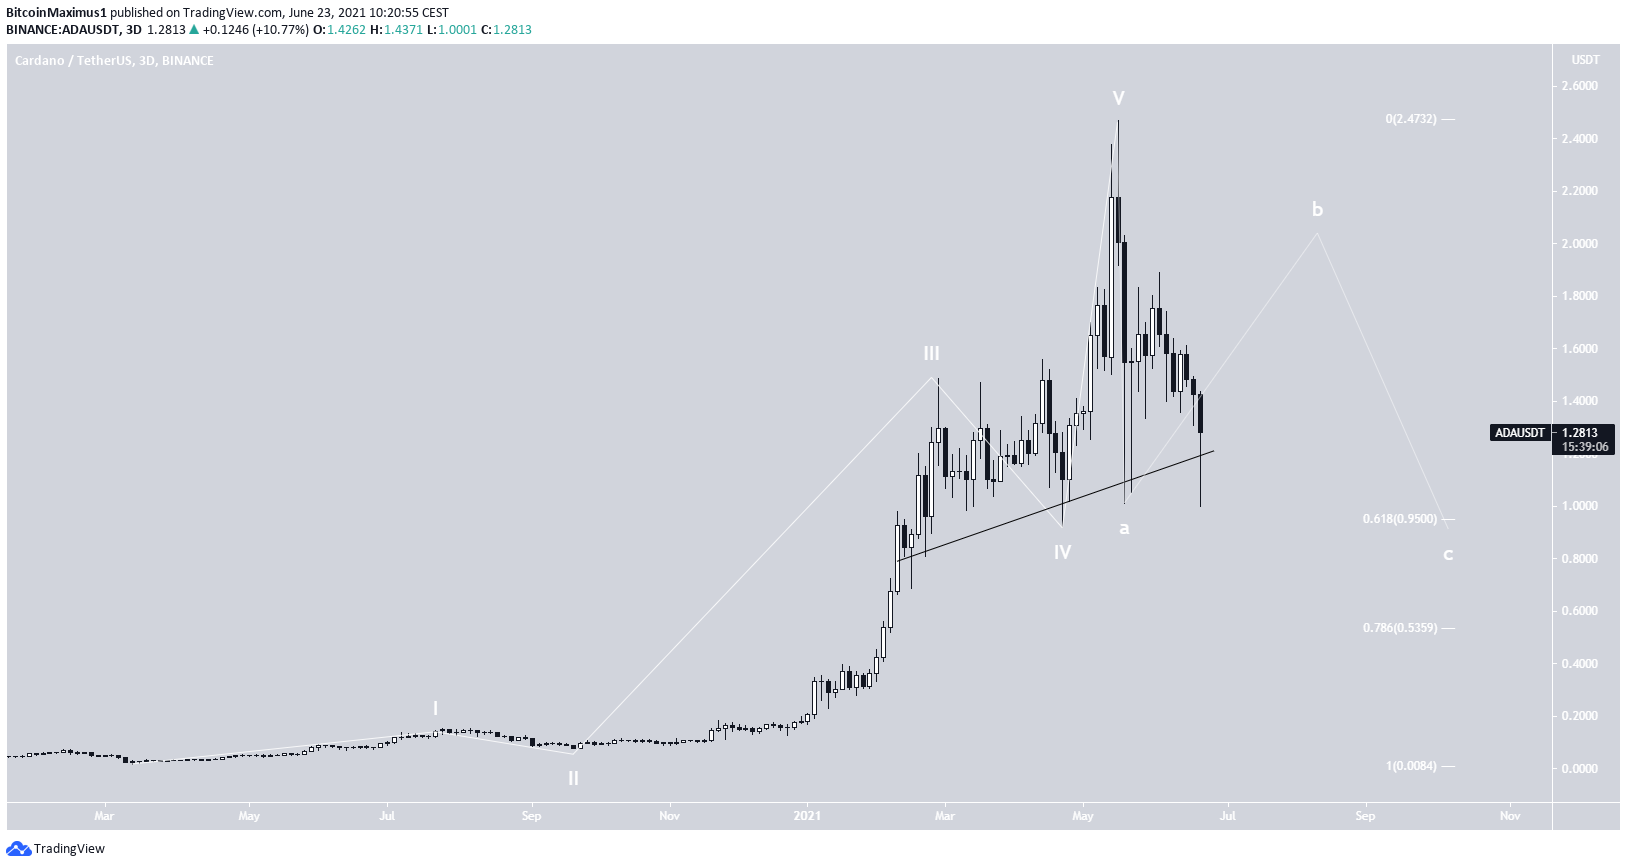
Despite the possibility of a bounce, it does seem like the token has already completed a five-wave bullish impulse that began on March 2020.
In this case, the proposed increase would only be the B wave (white) before another fall completes the correction.
ADA/BTC
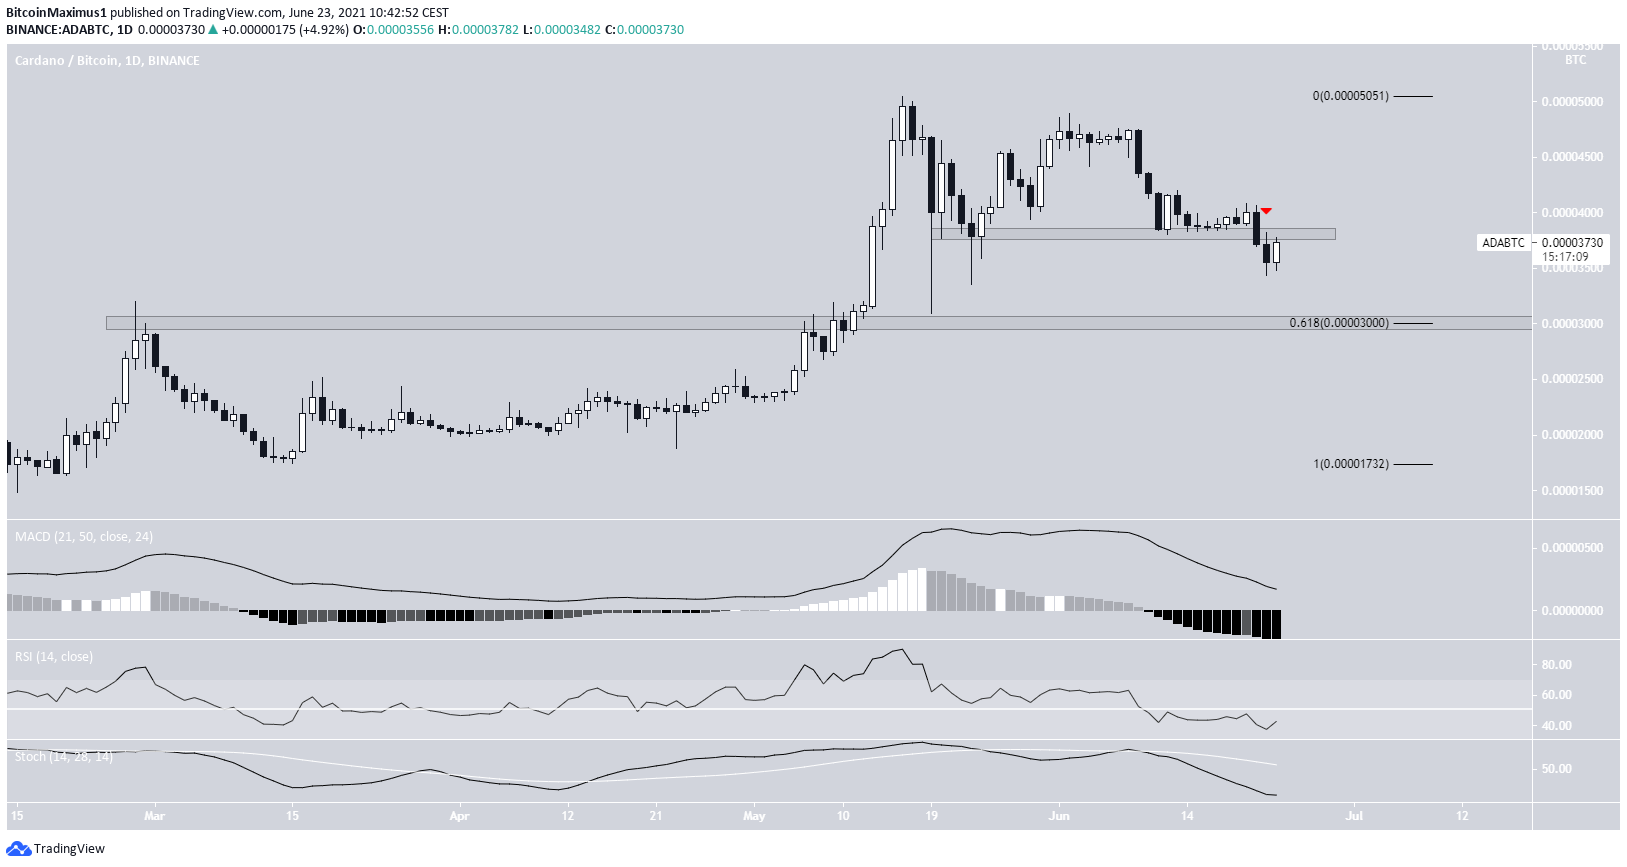
Cryptocurrency trader @CryptoMichNL out an ADA/BTC chart, stating that the ensuing drop could take it to the 3000 satoshi support area.
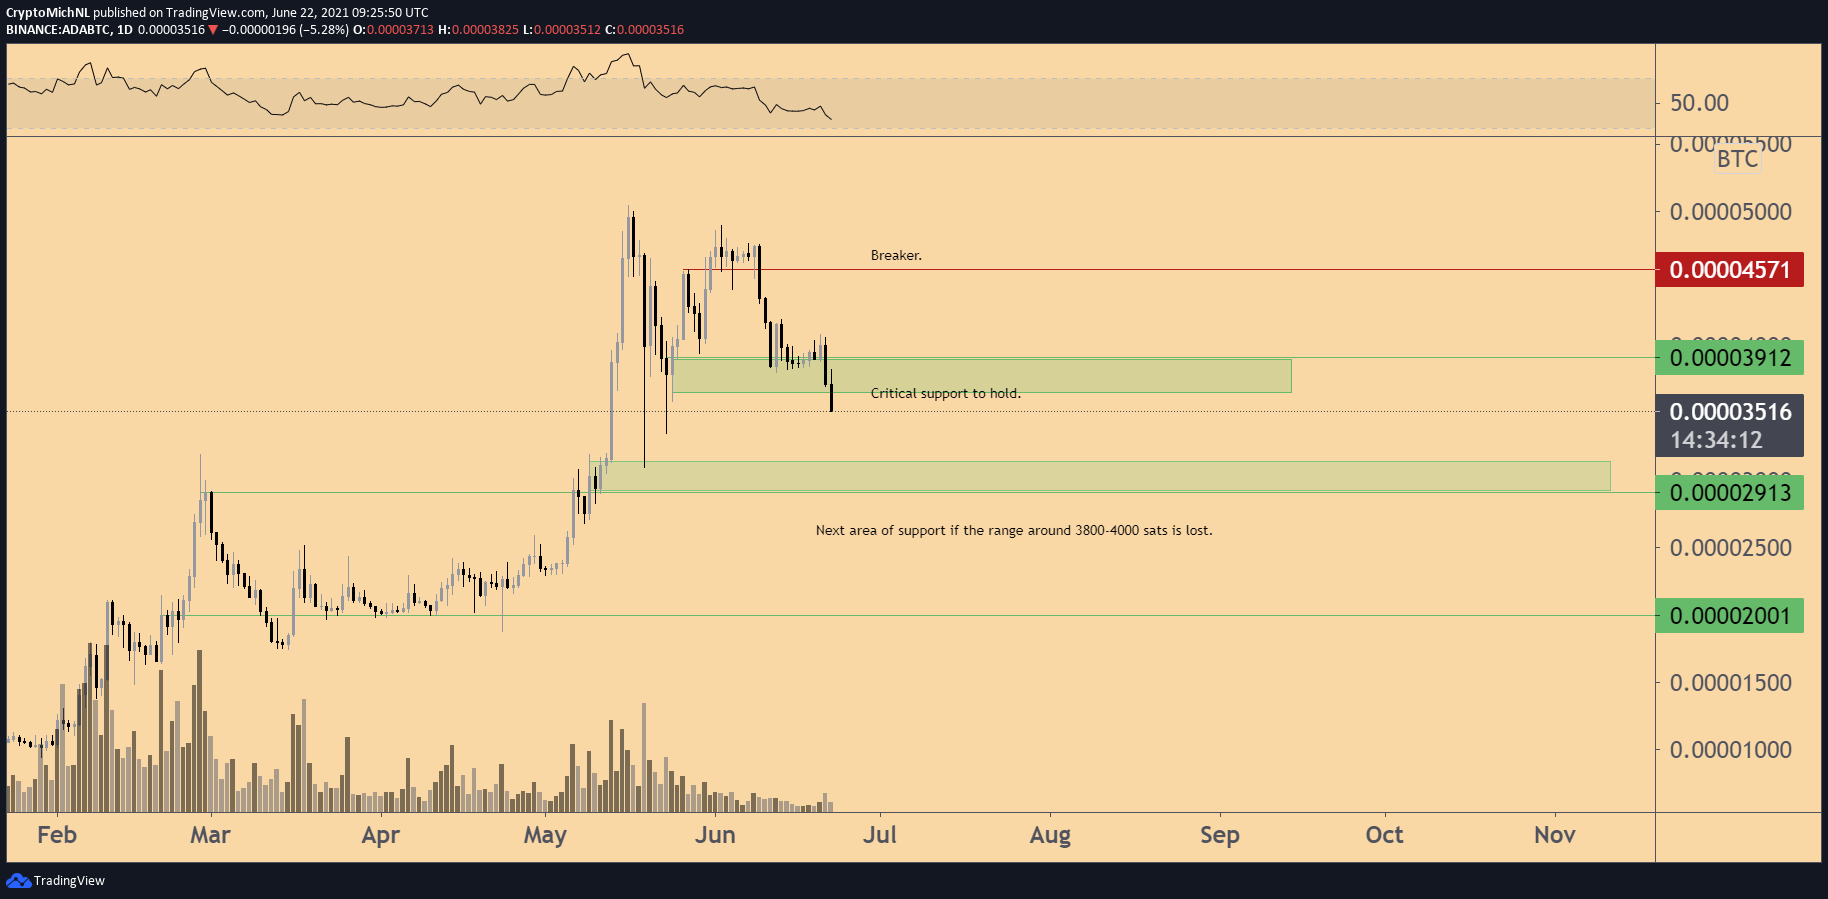
ADA has broken down from the 3800 horizontal area, which is now likely to act as resistance. Furthermore, technical indicators are bearish. The MACD, RSI & Stochastic oscillator are all falling.
The closest support area is at 3000 satoshis, the 0.618 Fib retracement level and a horizontal support area.
For BeInCrypto’s latest BTC (BTC) analysis, click here.
The post ADA Prevents Breakdown With Bounce At Long-Term Support Line appeared first on BeInCrypto.


![Decentraland: Review & Beginner's Guide [current_date format=Y] 32 Decentraland: Review & Beginner's Guide](https://cryptheory.org/wp-content/uploads/2020/11/decentraland-02-gID_7-300x150.jpg)