BAND Drops After Reaching All-Time High
2 min readTable of Contents
Band Protocol’s token, BAND’s price has been decreasing since reaching an all-time high price on Feb. 13.
Despite being above support, the ambiguity in both the price action and technical indicators makes the trend undetermined.
All-Time High And Drop
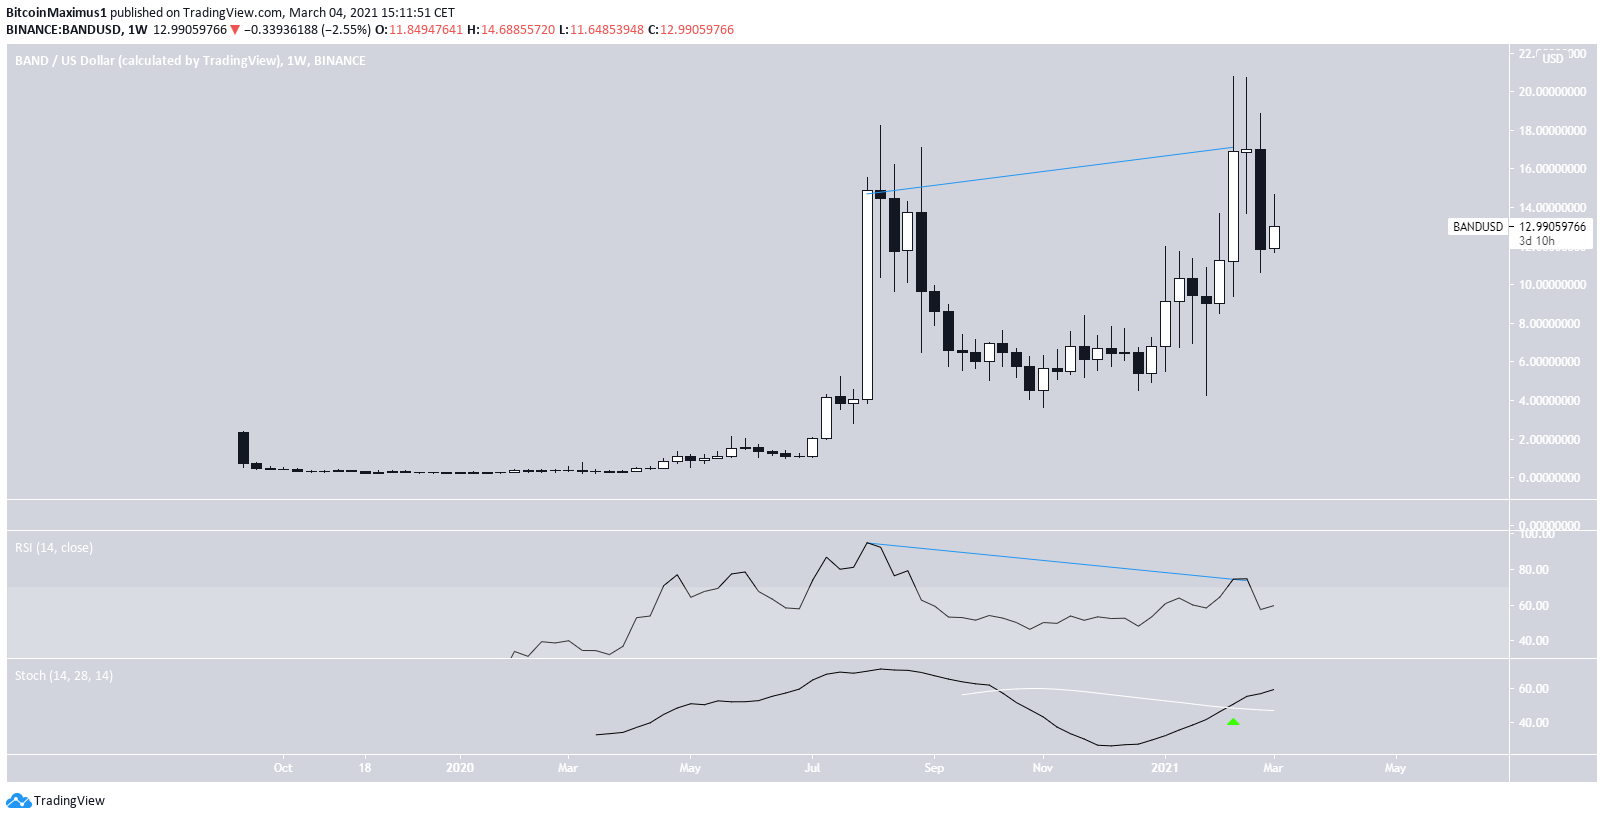
BAND has been decreasing since reaching an all-time high price of $20.77 on Feb. 13. So far, it has reached a low of $10.63, doing so on Feb. 23.
Before the drop, there was a very pronounced bearish divergence in the RSI. However, since then, the Stochastic oscillator has made a bullish cross.
Therefore, there are mixed signs as to the direction of the long-term trend.
Potential Reversal For BAND?
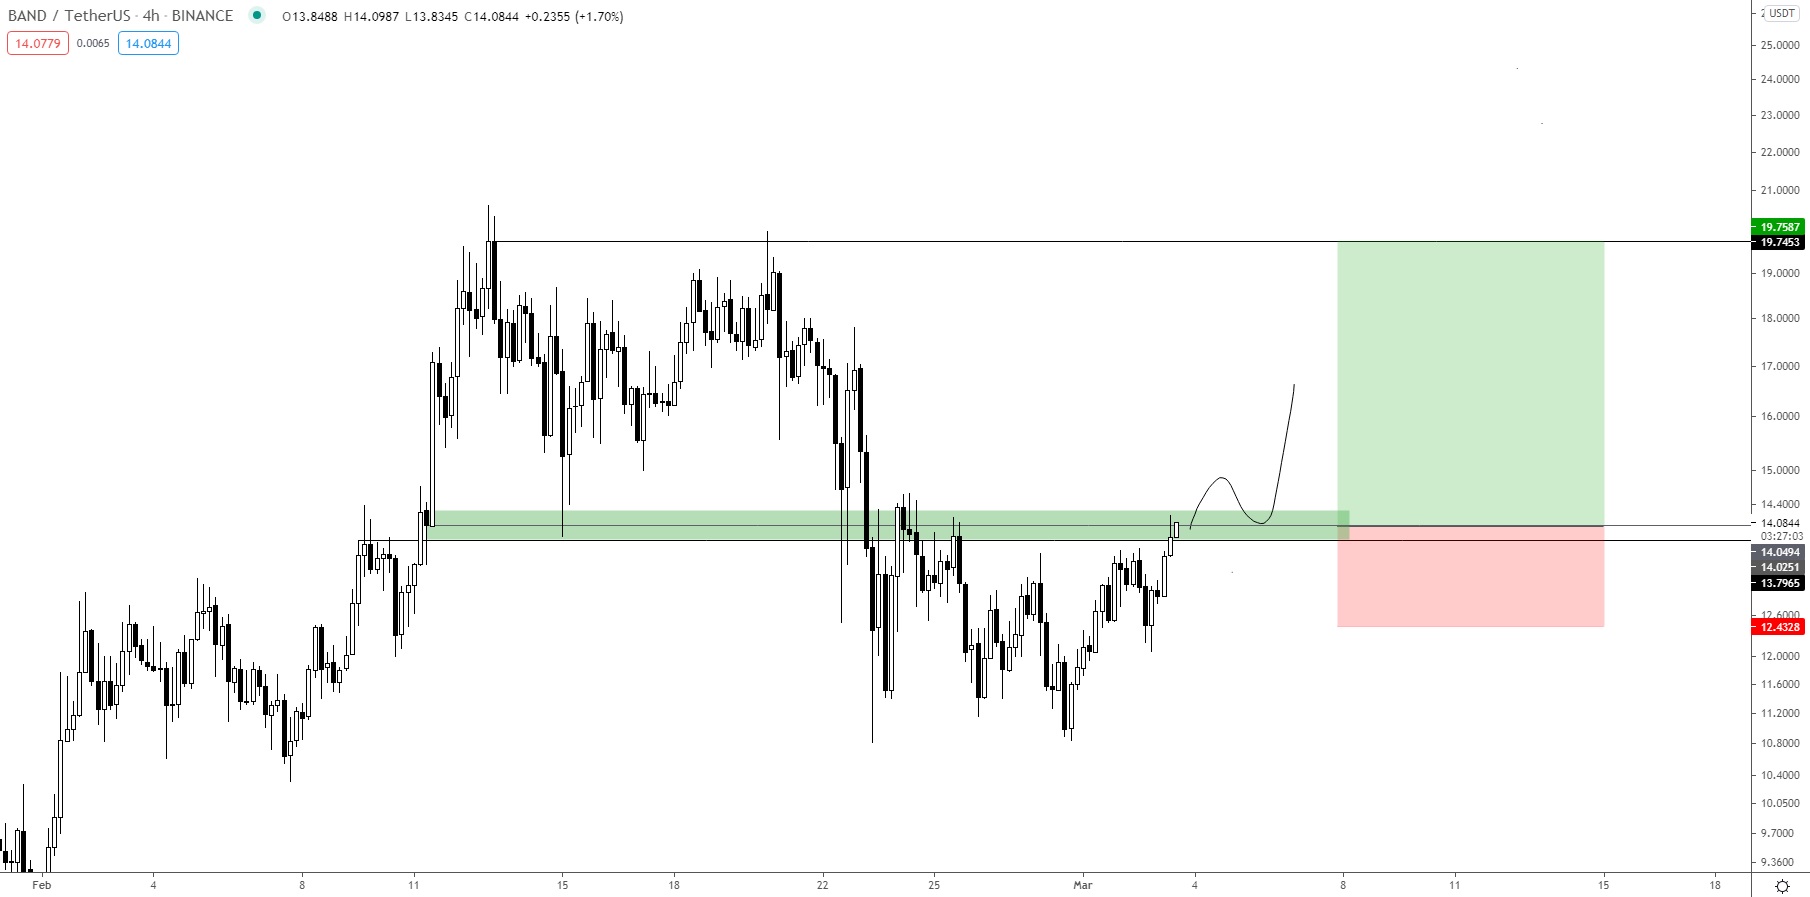
Cryptocurrency trader @TheEurosniper outlined a BAND chart, stating that he has entered a trade and expects the price to continue higher towards $19.
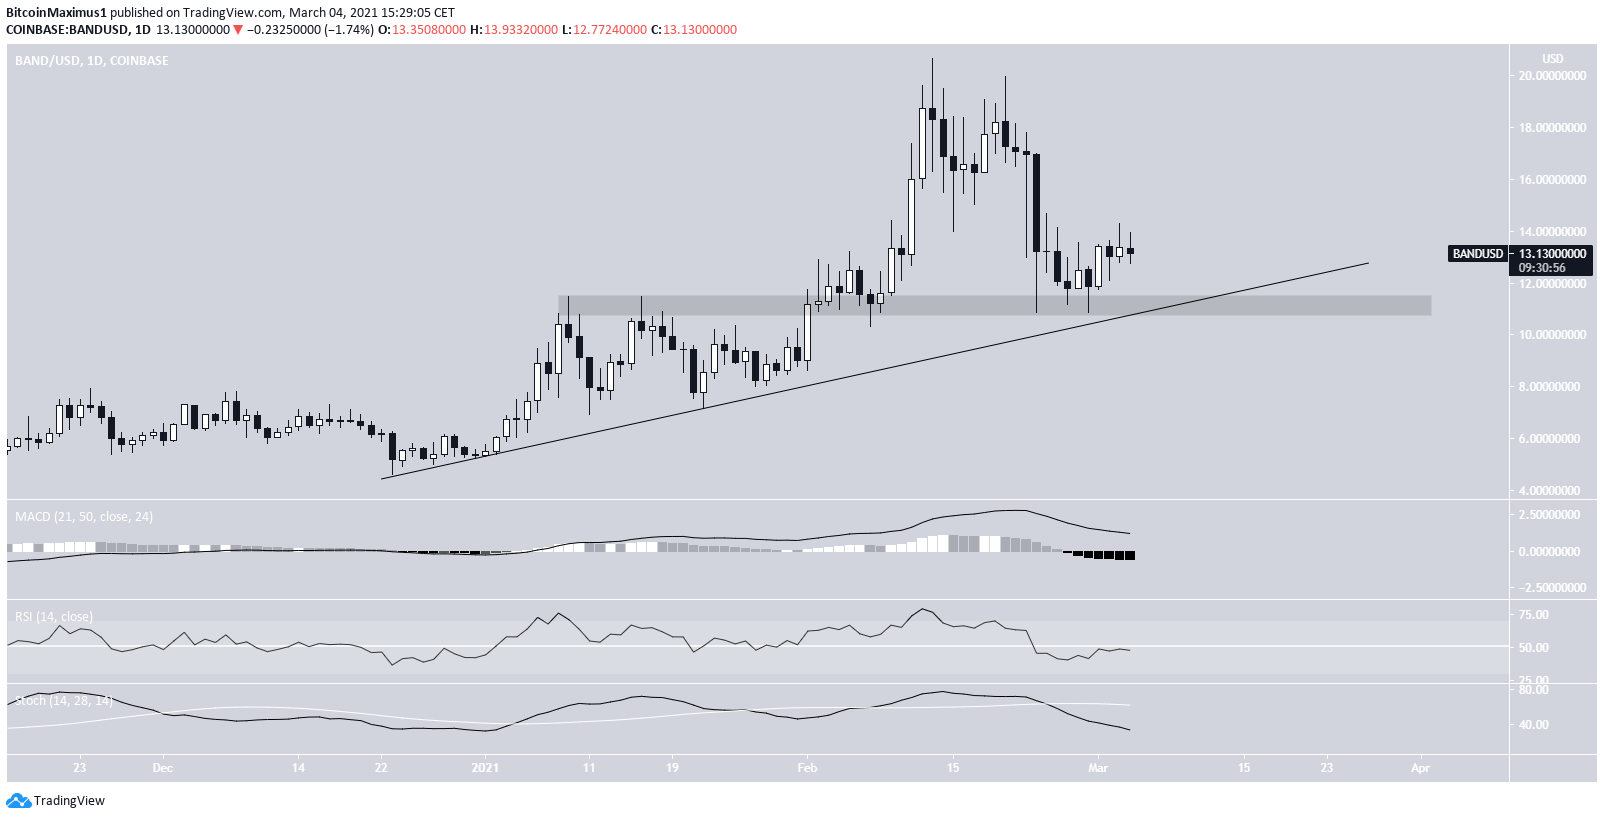
The daily chart shows two things:
- The price has bounced above the $11.10 support area.
- It is potentially following an ascending support line.
The line coincides with the support area, and both caused a bounce on Feb. 28.
Despite the bounce, technical indicators are neutral, failing to confirm the reversal.
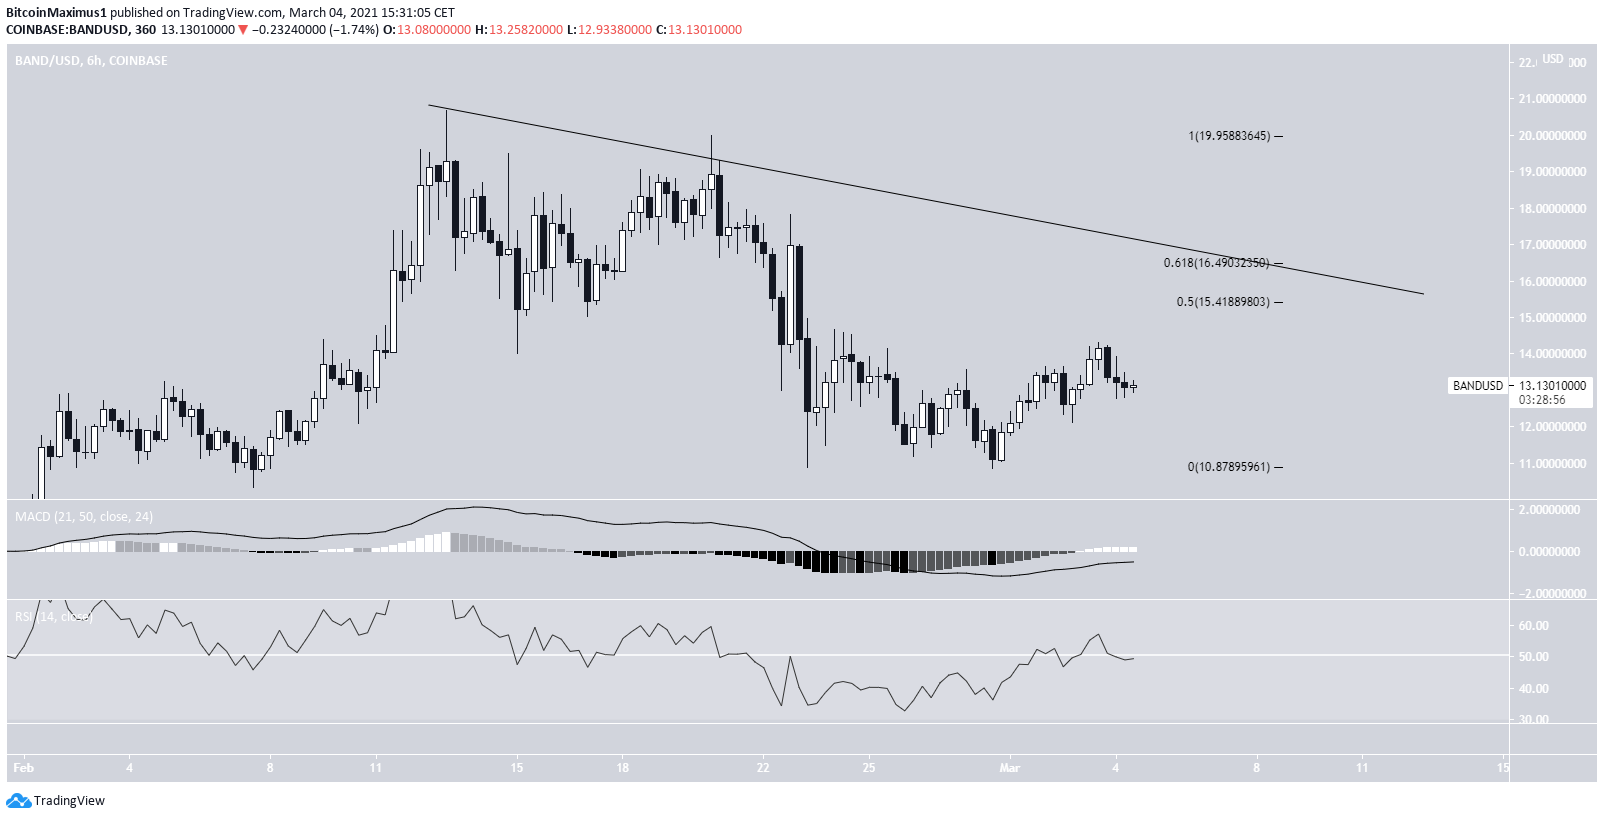
Similarly, the daily chart shows that there is significant resistance above the current price. The main resistance is found at $16.50, created by a descending resistance line and the 0.618 Fib retracement level of the most recent downward movement.
Therefore, in order to move towards the $19 target outlined in the tweet, the price has to initially clear this resistance area.
BAND/BTC
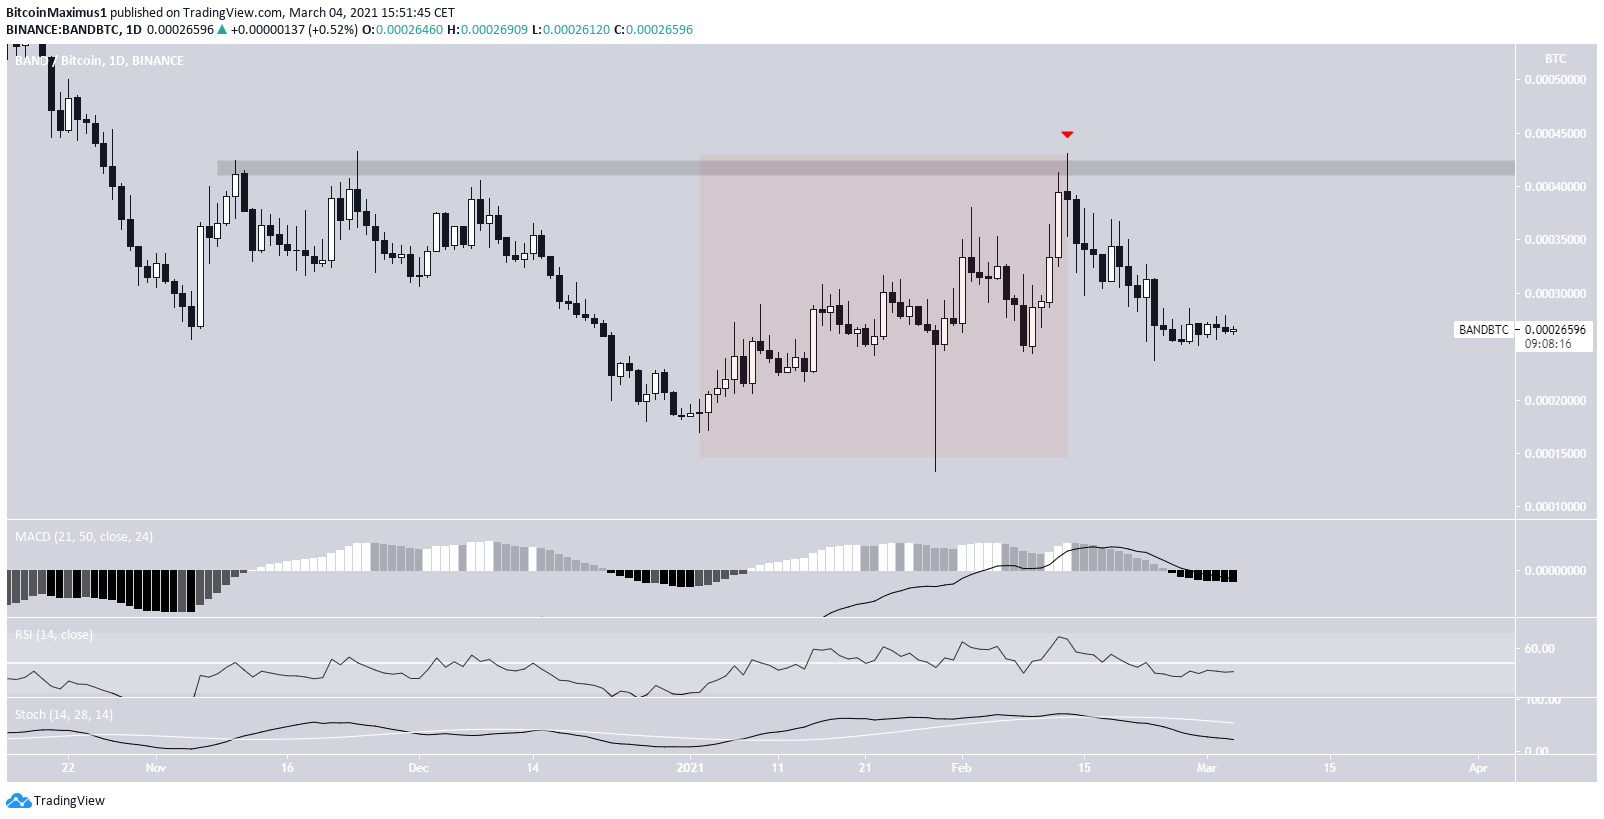
On the other hand, the trend for the BAND/BTC pair looks bearish. The price has been decreasing since reaching a high of 43,093 on Feb. 13.
Furthermore, the upward move leading to the high looks corrective, indicating that the trend is bearish.
Finally, technical indicators are bearish, suggesting that the price expectations decreasing towards 2000 satoshis and potentially lower.
Conclusion
To conclude, the direction of the trend cannot be currently determined. A breakout or a rejection from the descending resistance line and the $16.50 resistance area is required for the trend to be confirmed.
On the other hand, the BAND/BTC pair trend looks bearish as long as it is trading below 42,000 satoshis.
For BeInCrypto’s latest Bitcoin (BTC) analysis, click here.
The post BAND Drops After Reaching All-Time High appeared first on BeInCrypto.



![Decentraland: Review & Beginner's Guide [current_date format=Y] 32 Decentraland: Review & Beginner's Guide](https://cryptheory.org/wp-content/uploads/2020/11/decentraland-02-gID_7-300x150.jpg)