Bitcoin (BTC) Continues Ascent Toward $35,000 Target
2 min readTable of Contents
Bitcoin (BTC) reached another all-time high price on Jan. 3, this time increasing to $34,778.
While the trend has yet to show any significant weakness, BTC has already reached a crucial Fib extension level which suggests that it is near a top or has already reached one.
Weekly Bitcoin Close
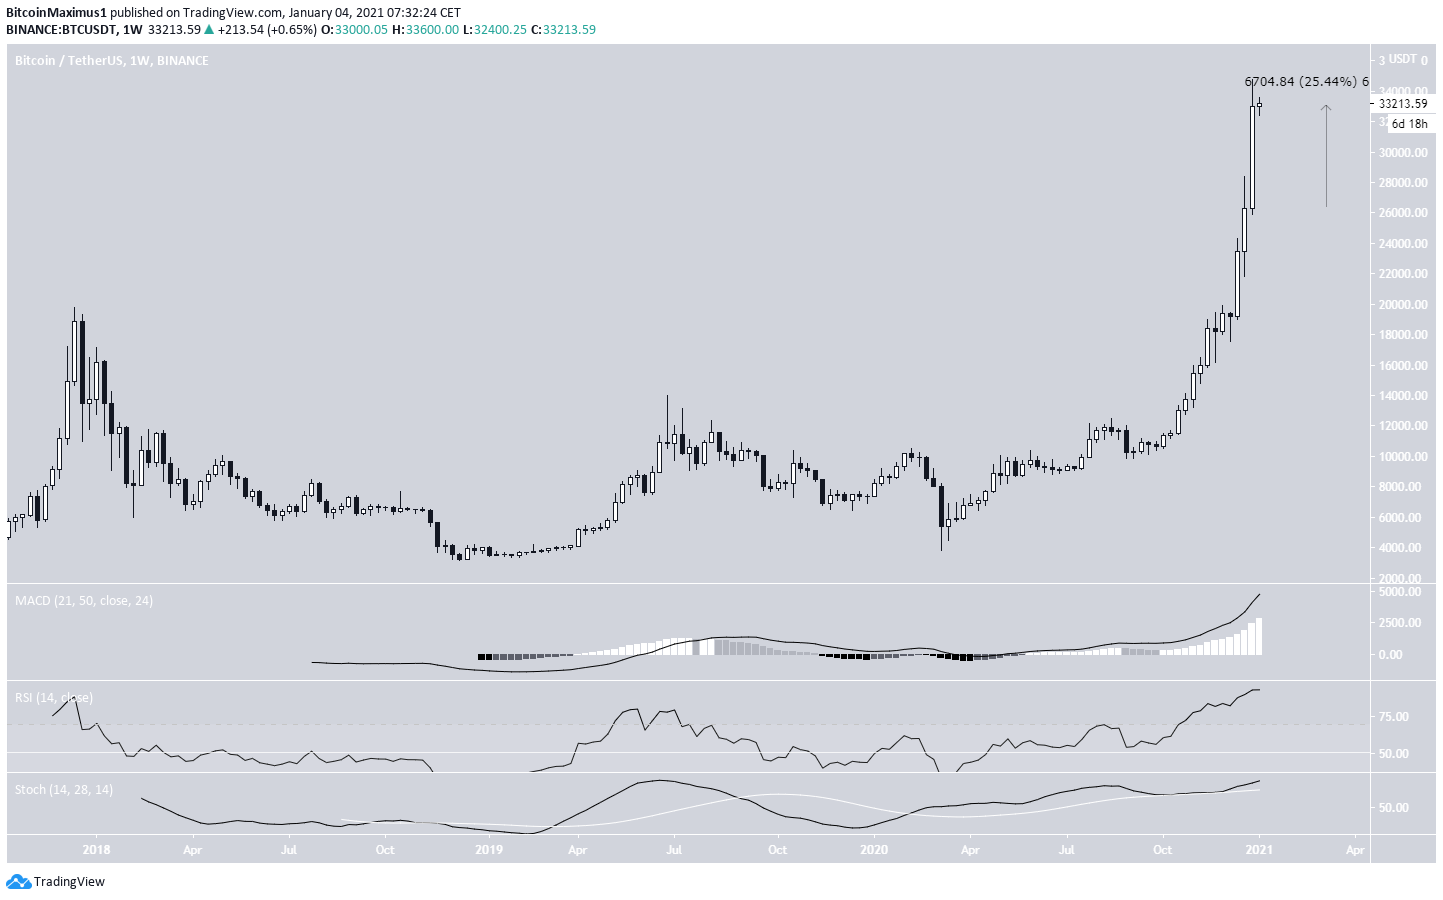
During the week of Dec. 28 – Jan. 4, the BTC price increased considerably, creating a bullish candlestick with a magnitude of 25%. BTC proceeded to reach yet another all-time high of $34,778 on Jan. 3.
Despite the massive increase and the seemingly parabolic rally, there are no clear signs of weakness in technical indicators, suggesting that the trend is still bullish.

Future Movement
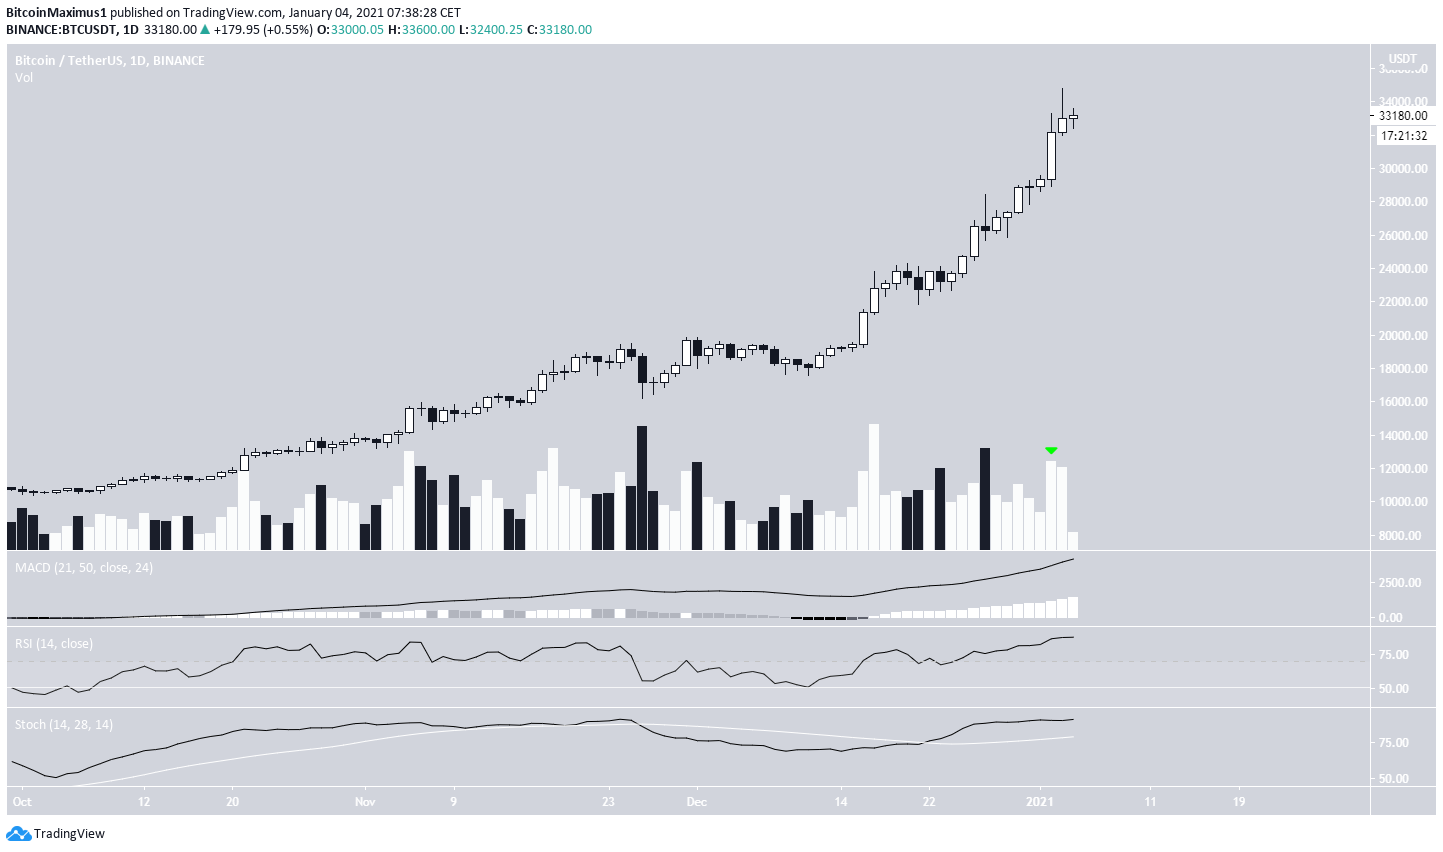
Similarly, the daily chart does not give any clear signs of weakness besides the relatively long upper wick on Jan. 3, which resembles a shooting star candlestick. In addition, we can see that volume has not been especially high during the past two days.
However, there is no bearish divergence in place and both the RSI and MACD are still moving upwards, indicating that BTC could continue increasing.

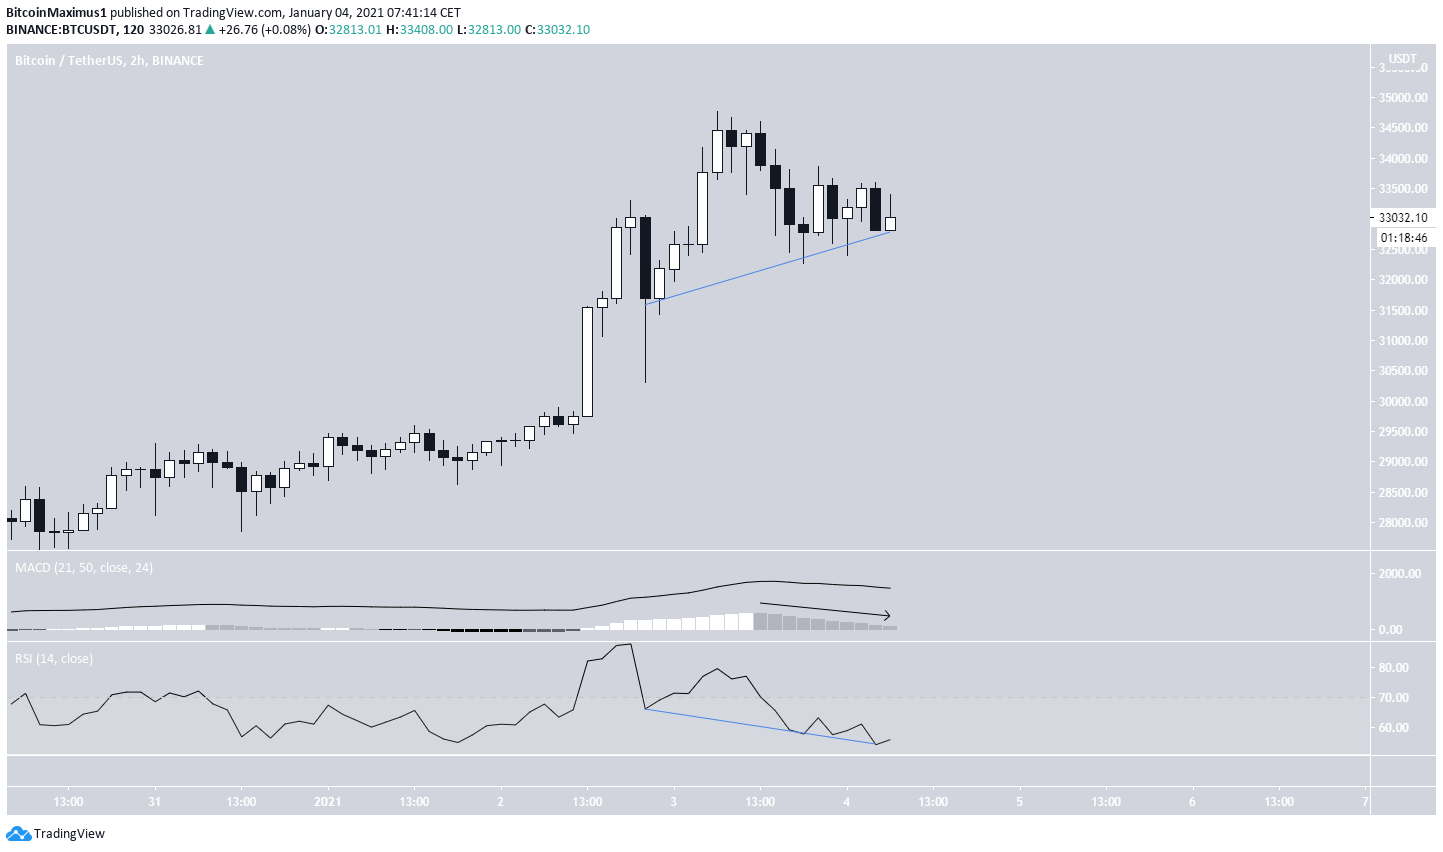
The two-hour chart gives us the first signs of weakness since the MACD has lost its strength and has almost crossed into negative territory. However, the RSI has generated a significant hidden bullish divergence. This is normally considered a sign of continuation after which another upward move would be expected.
However, there is no structure in place nor are there clear resistance or support levels.

BTC Wave Count
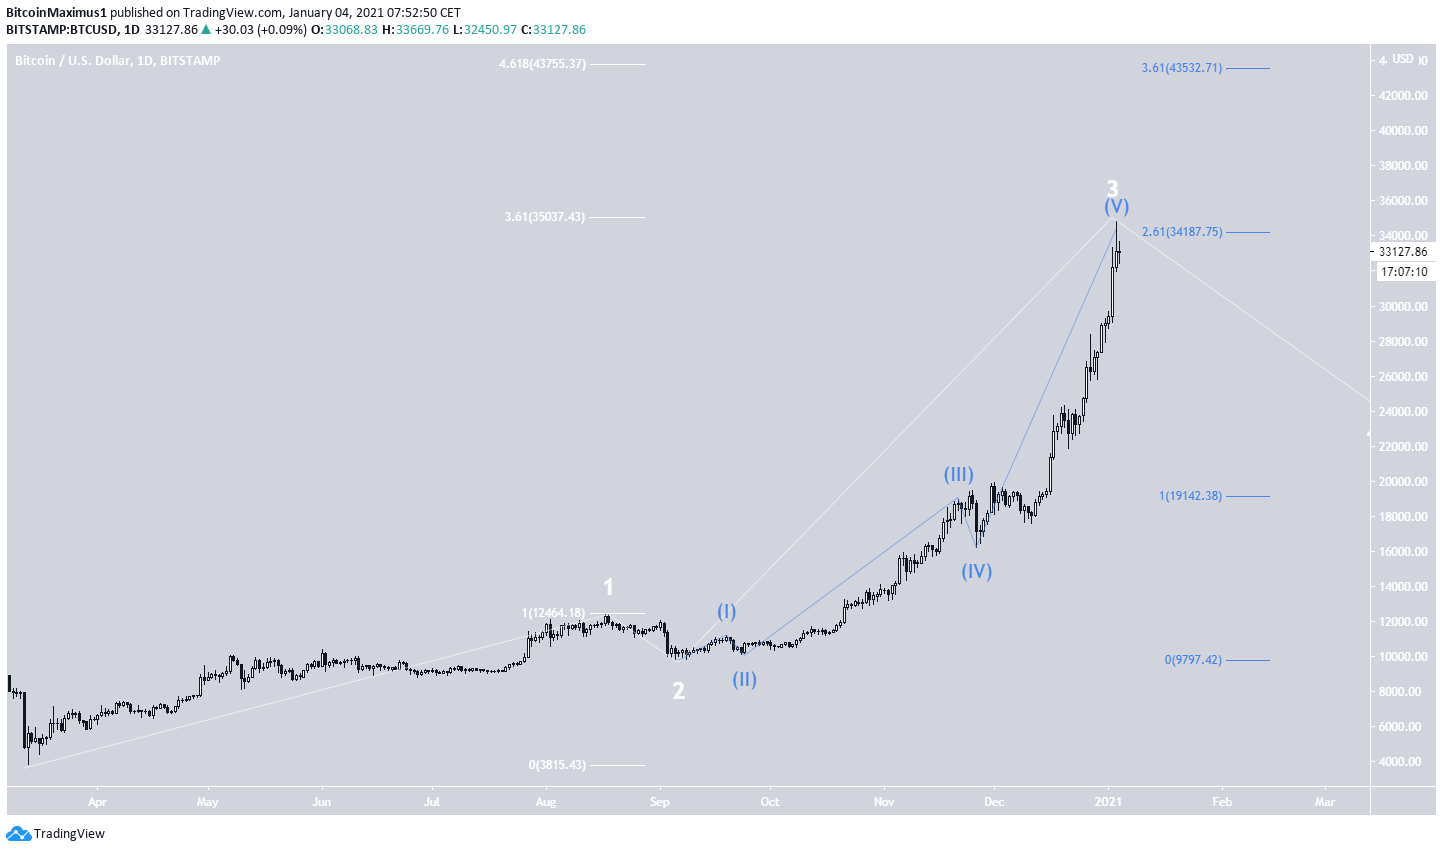
The wave count suggests that BTC is very close to reaching a top, if it has not done so already.
BTC seems to be in wave 5 (shown in blue below) of cycle wave 3 (shown in white).
The 3.61 Fib extension of cycle wave 1 (white) falls at $35,037 and suggests that BTC has already reached a top. The next significant Fib resistance level would be 4.61, found all the way at $43,755.
Using a Fib extension on the length of waves 1-3 (blue) gives us very similar targets of $34,187 (already reached) and $43,532.

Conclusion
The Bitcoin rally has gone completely parabolic and is devoid of any clearly visible trading structure or support/resistance levels. Fib extensions suggest that BTC has possibly reached a top, despite technical indicators not yet showing any weakness.
For BeInCrypto’s previous Bitcoin (BTC) analysis, click here!
Disclaimer: Cryptocurrency trading carries a high level of risk and may not be suitable for all investors. The views expressed in this article do not reflect those of BeInCrypto.
The post Bitcoin (BTC) Continues Ascent Toward $35,000 Target appeared first on BeInCrypto.


![Decentraland: Review & Beginner's Guide [current_date format=Y] 29 Decentraland: Review & Beginner's Guide](https://cryptheory.org/wp-content/uploads/2020/11/decentraland-02-gID_7-300x150.jpg)