Bitcoin (BTC) Stalls Just Short of New All-Time High
2 min readTable of Contents
Bitcoin (BTC) resumed its ongoing increase, nearly reaching a new all-time high price on March 10.
Despite the short-term rejection, the most likely scenario is that Bitcoin will continue moving up and eventually reach a new all-time high price.
Bitcoin Continues Ascent
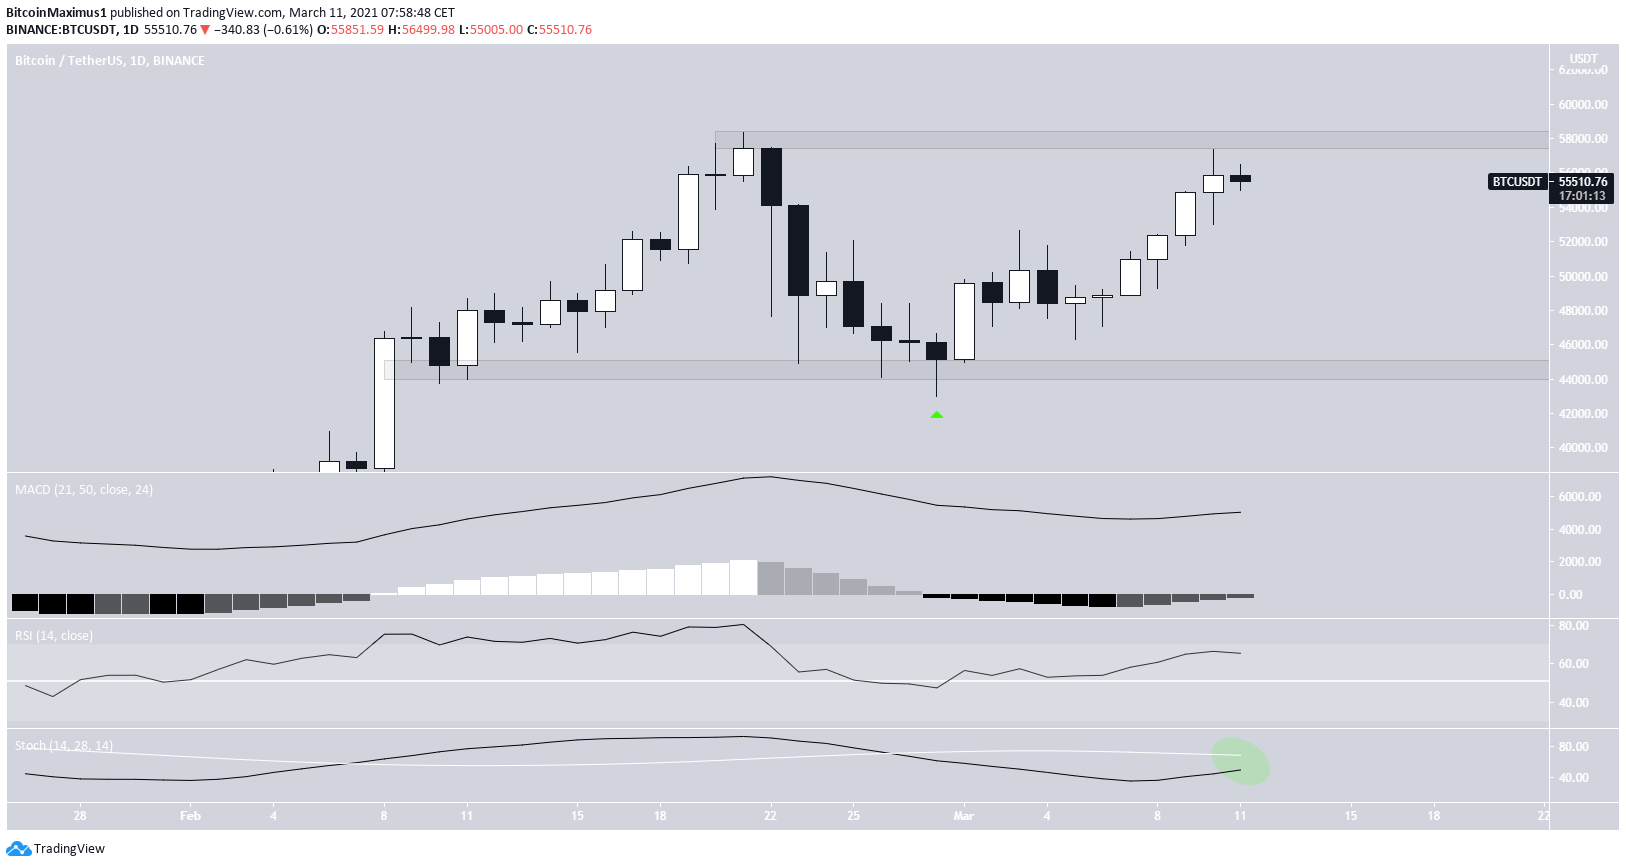
BTC has been moving upwards since Feb. 28, when it was trading at a low of $43,000. So far, the increase has taken it to a local high of $57,387. This is just short of its Feb. 21 all-time high of $58,400.
Technical indicators are bullish. After giving a bullish reversal signal, the MACD histogram has nearly crossed into positive territory. In addition, the RSI is well above 50 and the Stochastic oscillator is very close to making a bullish cross.
In the daily time-frame, the main support and resistance areas are found at $44,500 and $58,000 respectively.

Parallel Channel
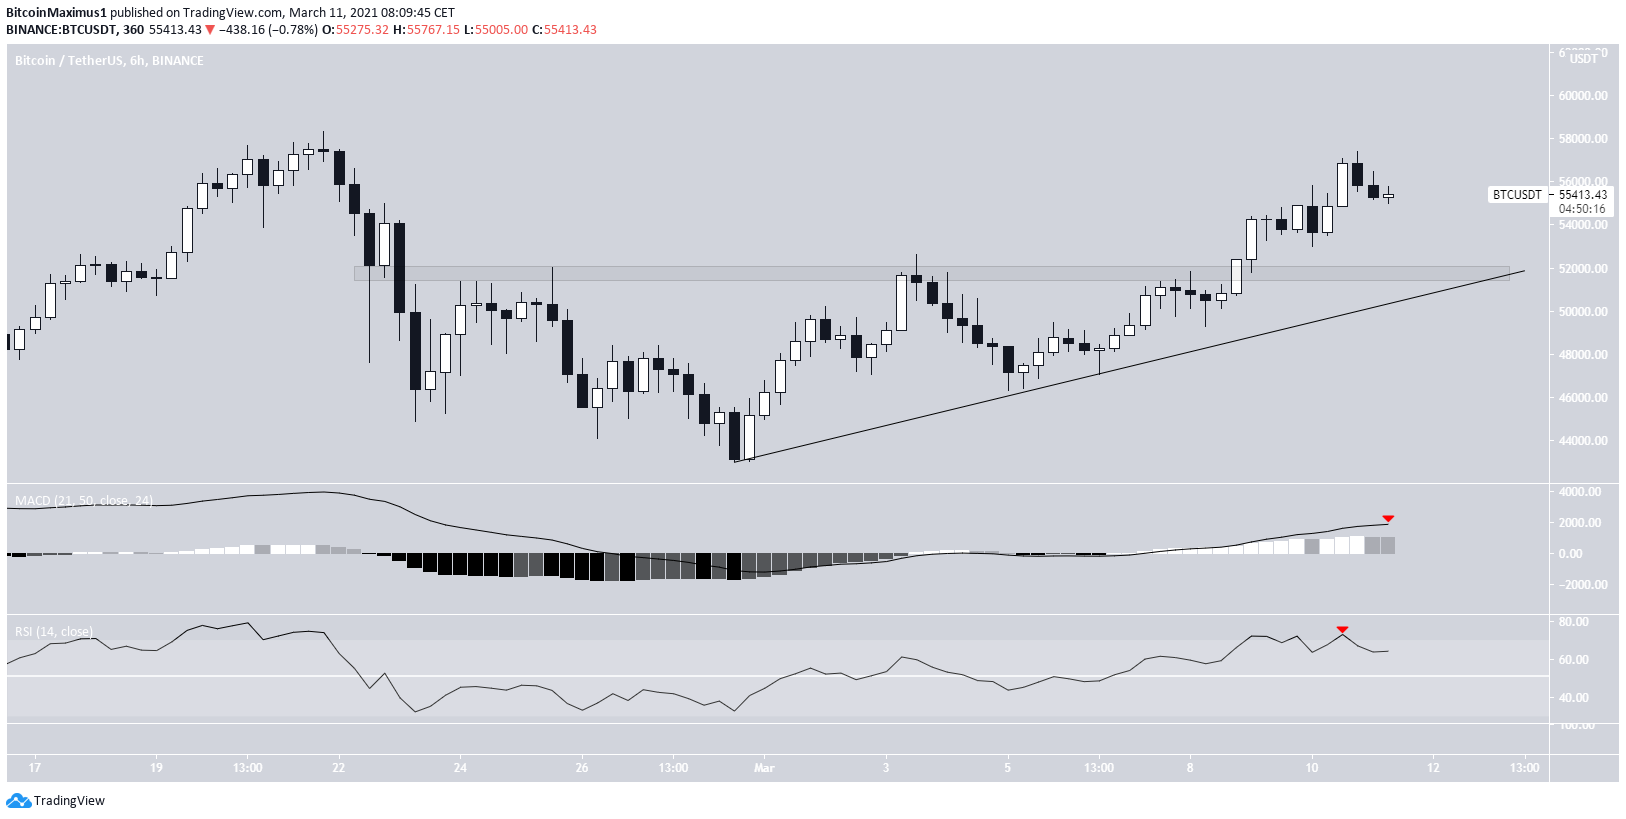
The six-hour chart shows that BTC has broken out above the minor $52,000 support area. This level also coincides with a potential ascending support line.
Technical indicators have begun to show weakness. The MACD has generated one lower momentum bar and the RSI has fallen below 70.
However, as long as the price is trading above this ascending line, the trend is considered bullish.

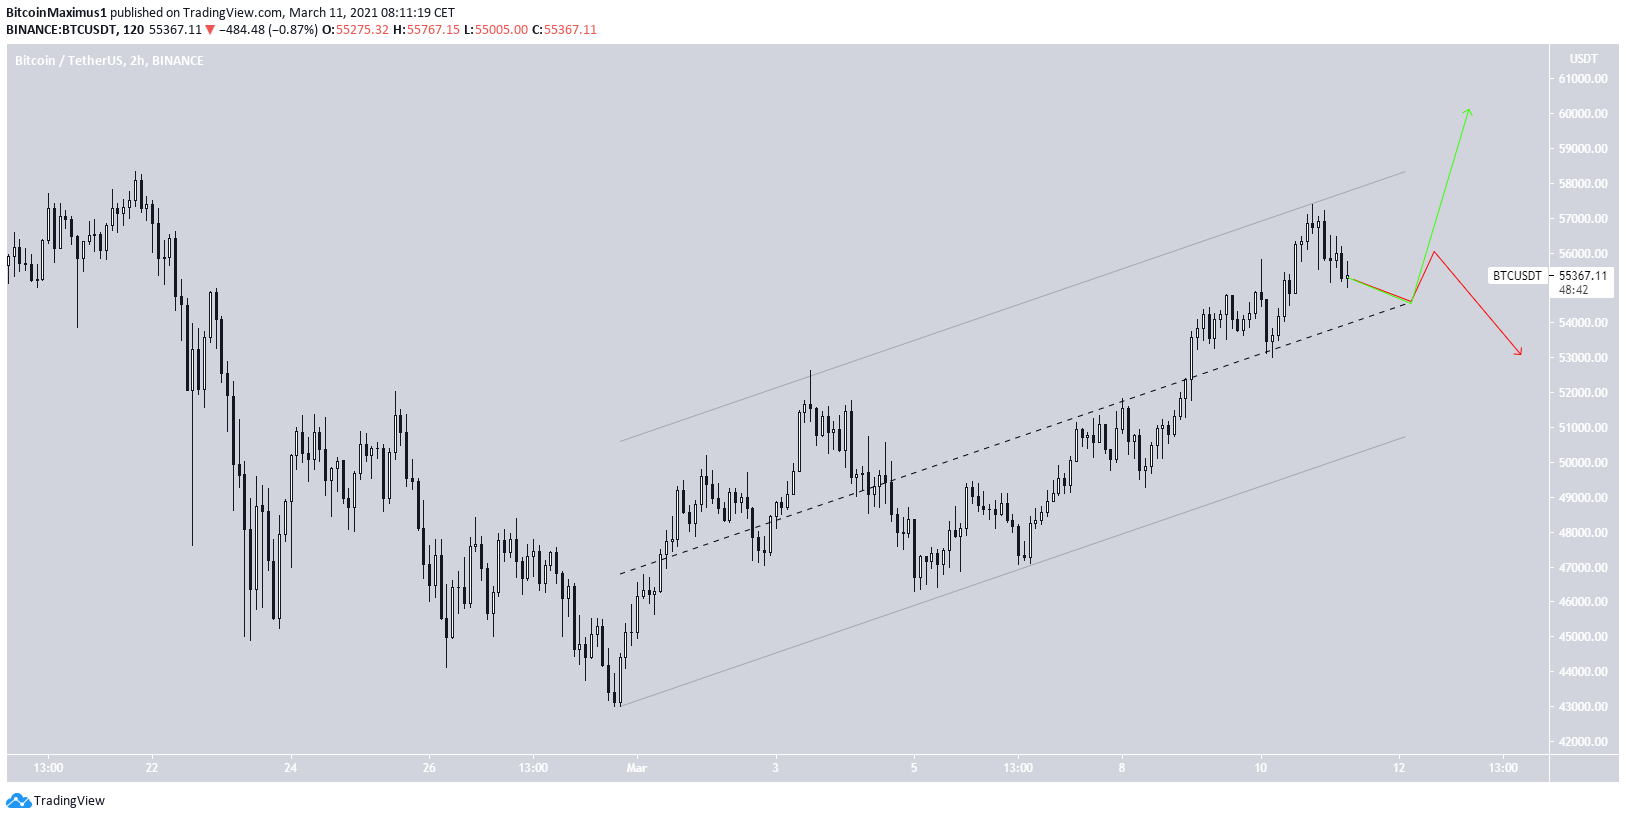
An even closer look shows that BTC is trading inside a parallel ascending channel. Yesterday, it was rejected by its resistance line. On top of the rejection, parallel channels usually contain corrective movements.
Currently, BTC seems to be in the process of decreasing to the middle of the channel. Whether it bounces or gets rejected here will likely determine the direction of the trend.
A decrease below the middle of the channel and fall to support would likely mean that the low is not yet in.
On the other hand, a movement above the channel would lead BTC into price discovery.

BTC Wave Count
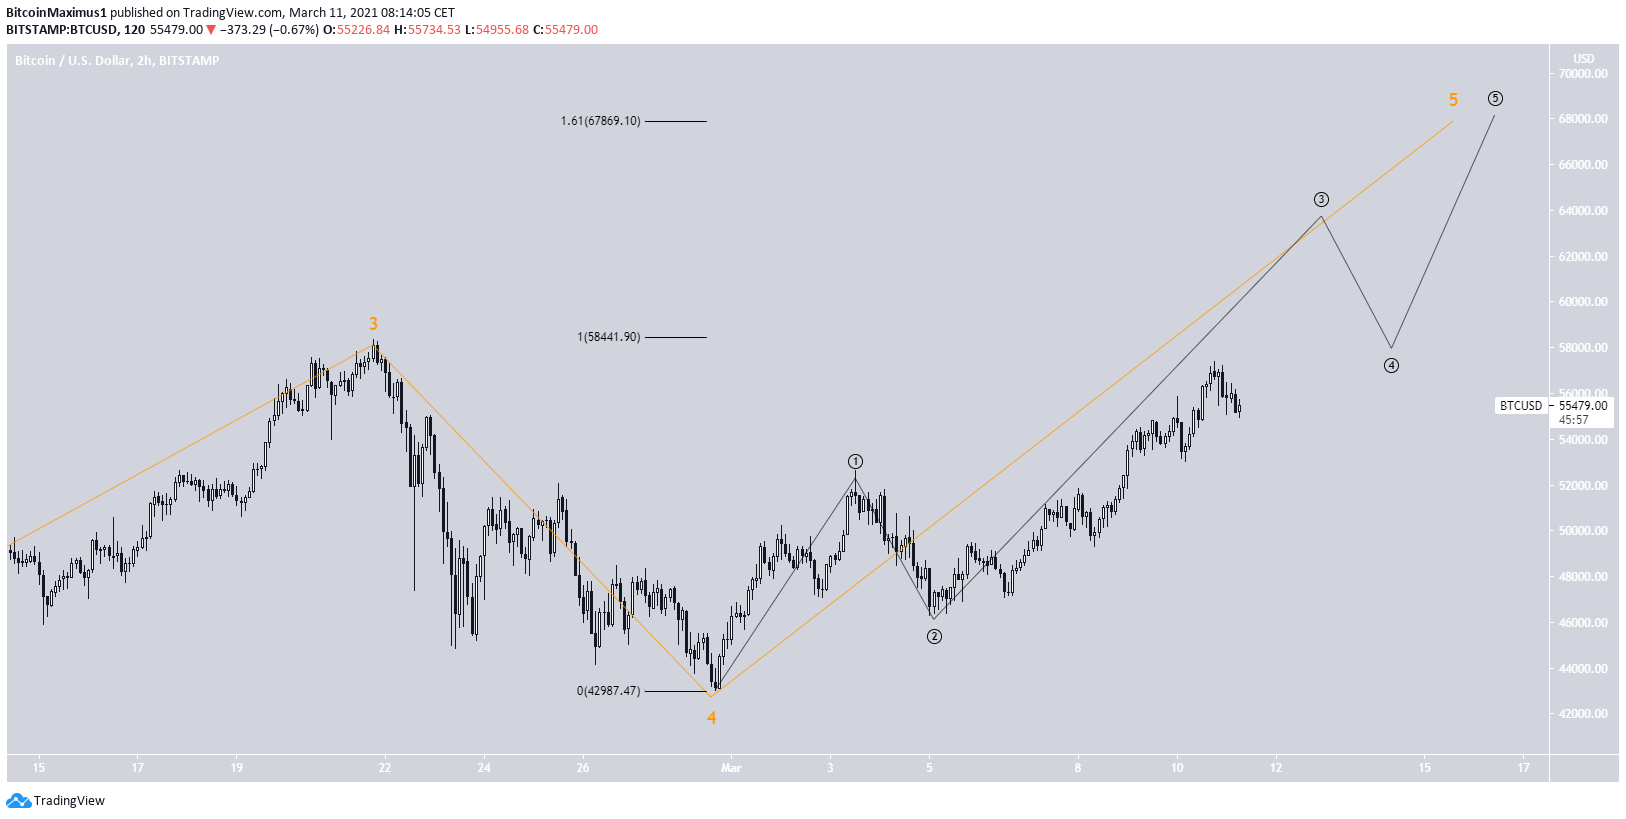
The wave count suggests that BTC is in the fifth wave (orange) of a bullish impulse. The sub-wave count is shown in black. It indicates that BTC is currently in sub-wave three.
A potential target for the top of the movement is found near $67,869.
Therefore, the wave count suggests that a breakout from the channel is the most likely scenario.
For the longer-term wave count, click here.

Conclusion
Bitcoin is currently decreasing towards the middle of a parallel channel. An eventual breakout from the channel is expected. This would likely lead to a new all-time high price.
For BeInCrypto’s previous Bitcoin (BTC) analysis, click here.
The post Bitcoin (BTC) Stalls Just Short of New All-Time High appeared first on BeInCrypto.


![Decentraland: Review & Beginner's Guide [current_date format=Y] 29 Decentraland: Review & Beginner's Guide](https://cryptheory.org/wp-content/uploads/2020/11/decentraland-02-gID_7-300x150.jpg)