Bitcoin (BTC) Wave Count Suggests a Top Has been Reached
3 min readTable of Contents
Bitcoin (BTC) has been decreasing significantly since reaching a high on Jan. 8.
It’s likely that Bitcoin has completed wave 3 and has now begun a correction.
Primary Bitcoin Wave Count
In BeInCrypto’s previous wave count article, we stated that
“Bitcoin is in wave 5 (white) of this cycle wave. A likely target for the top of the move is found between $40,602-$44,127.”
Yesterday’s movement makes it likely that wave 5 (white) is complete. This would also complete cycle wave 3 (red) in the process.
If BTC is now in a bearish cycle wave 4, the three most likely targets for the correction to end would be found at:
- $27,481 – 0.382 Fib retracement
- $22,969 – 0.5 Fib retracement
- $18,457 – 0.618 Fib retracement
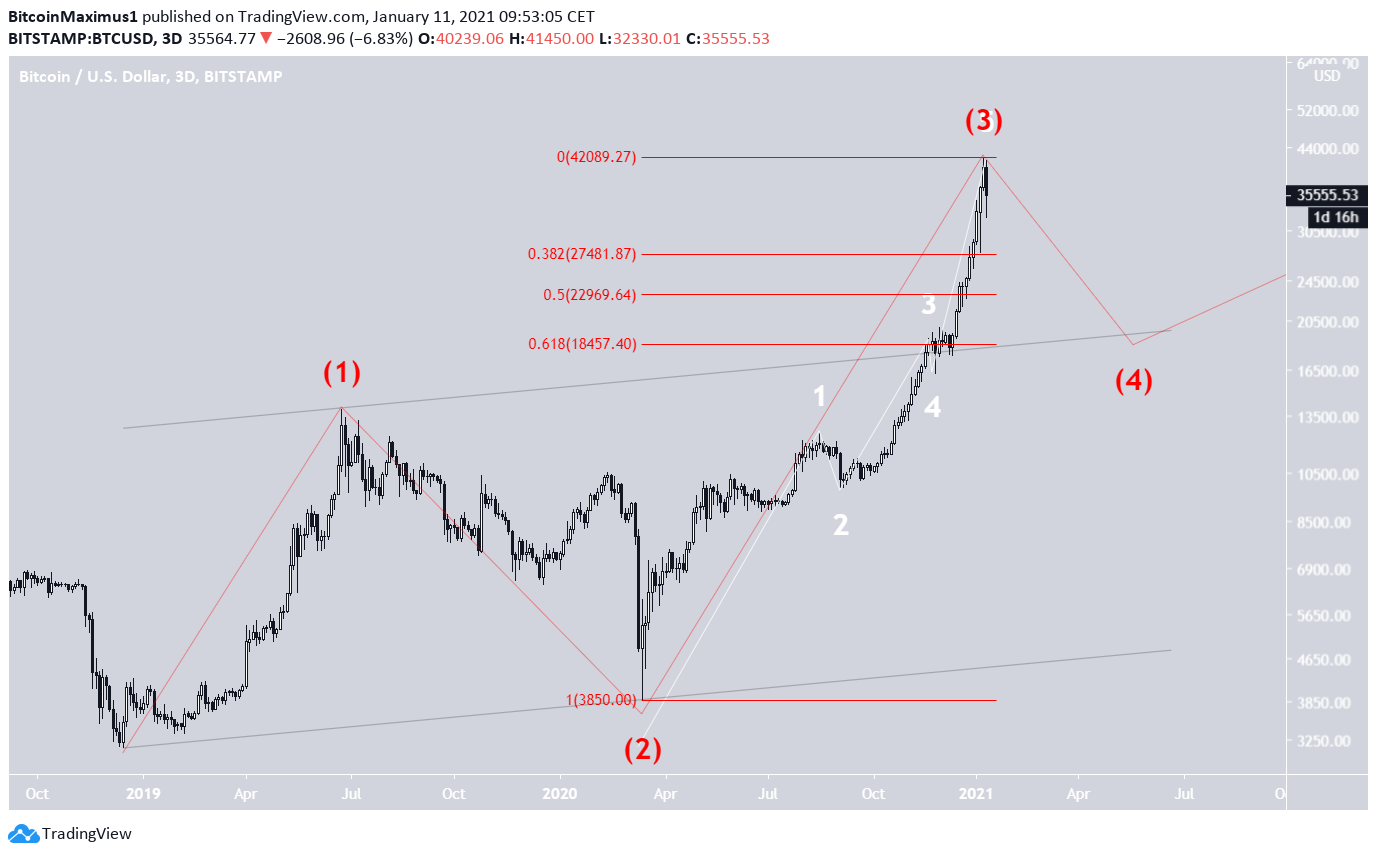
Out of these three, the most likely to act as the bottom would be the $18,457 (0.618 Fib) area, since it was the same level that wave 4 (white) completed.
Very often, waves of a higher degree terminate at the same place as one degree lower. This would be the case if BTC falls to $18,457.
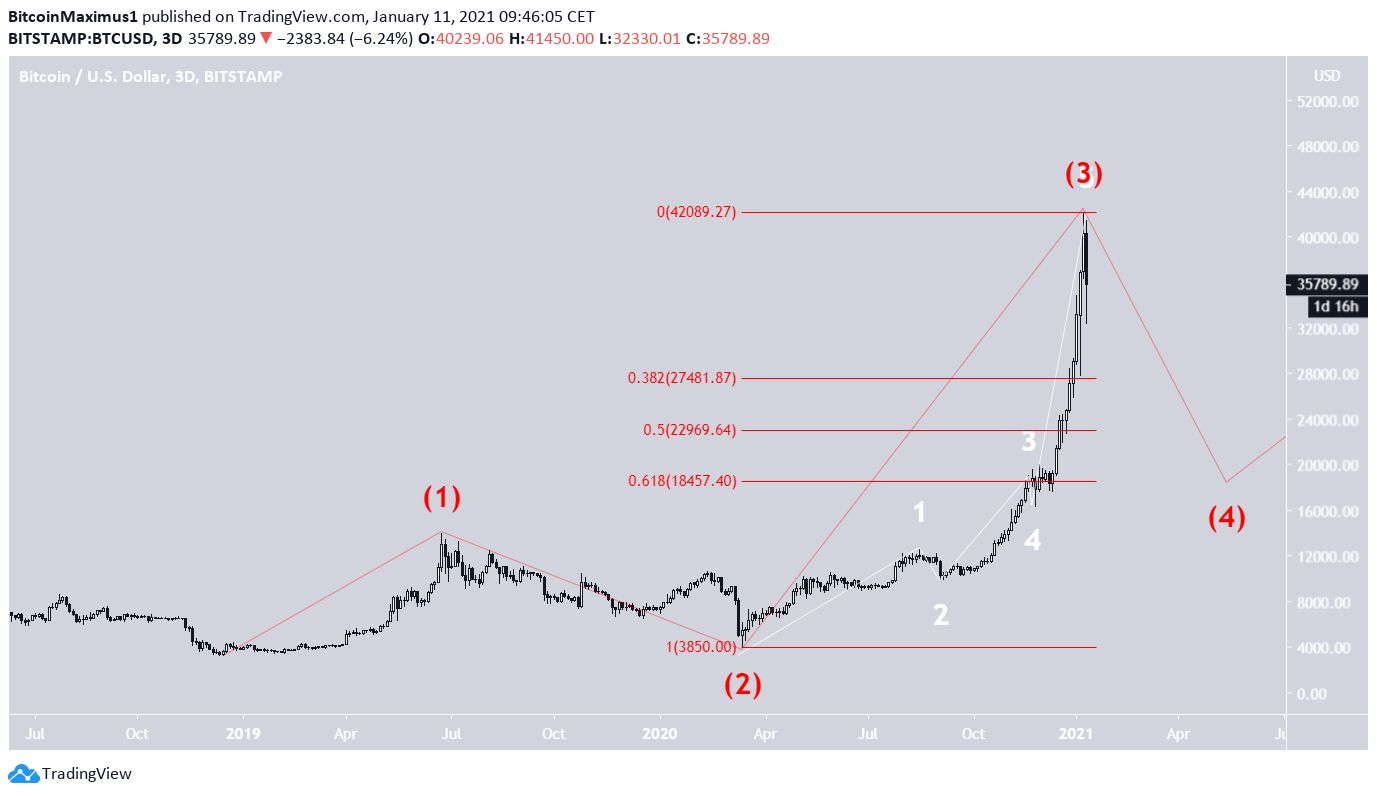
Furthermore, this decrease would also serve to complete a fourth wave pullback, making this a very likely target to be reached.
Alternate BTC Count
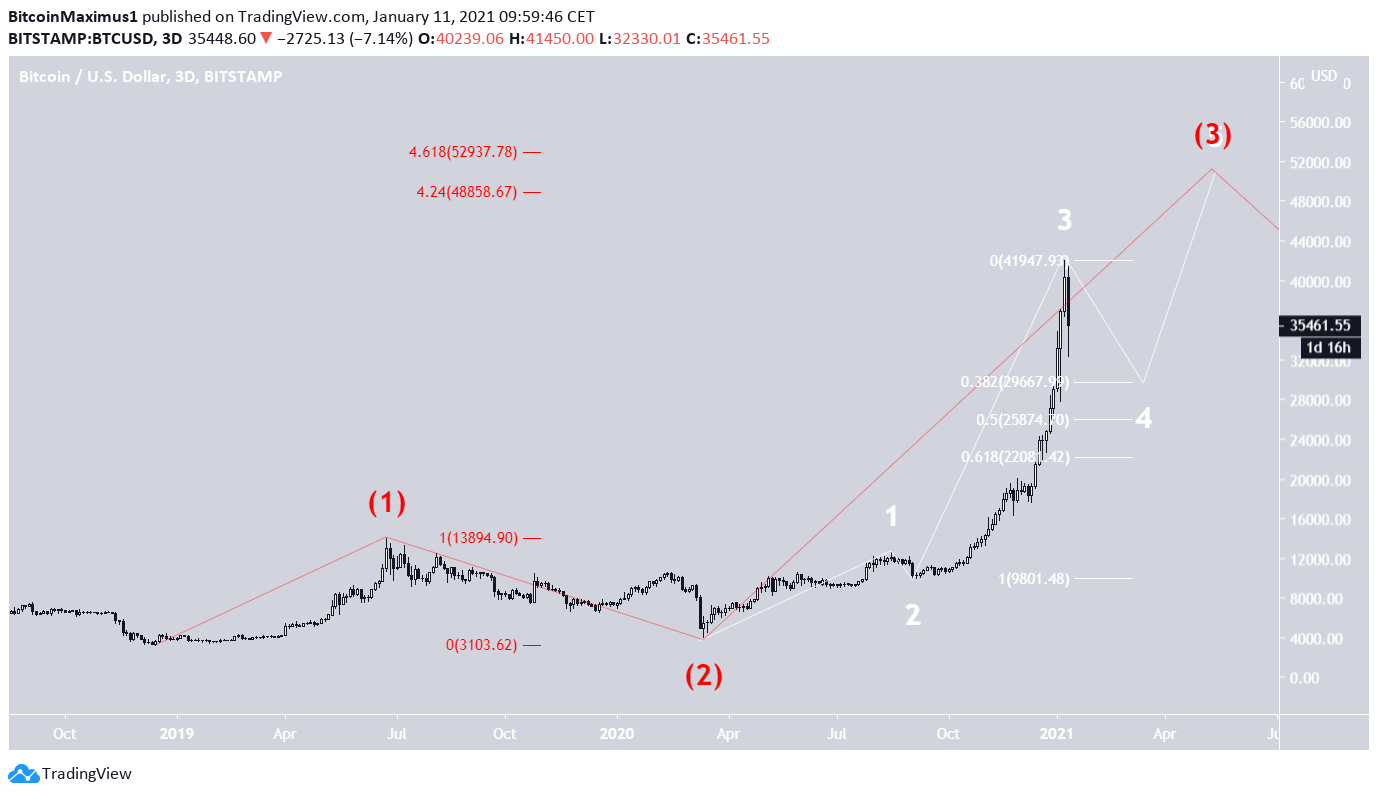
The alternate count would suggest that BTC has just completed wave 3 and begun wave 4 (white).
The three most likely targets for the bottom of wave 4 are:
- $29,667 – 0.382 Fib retracement
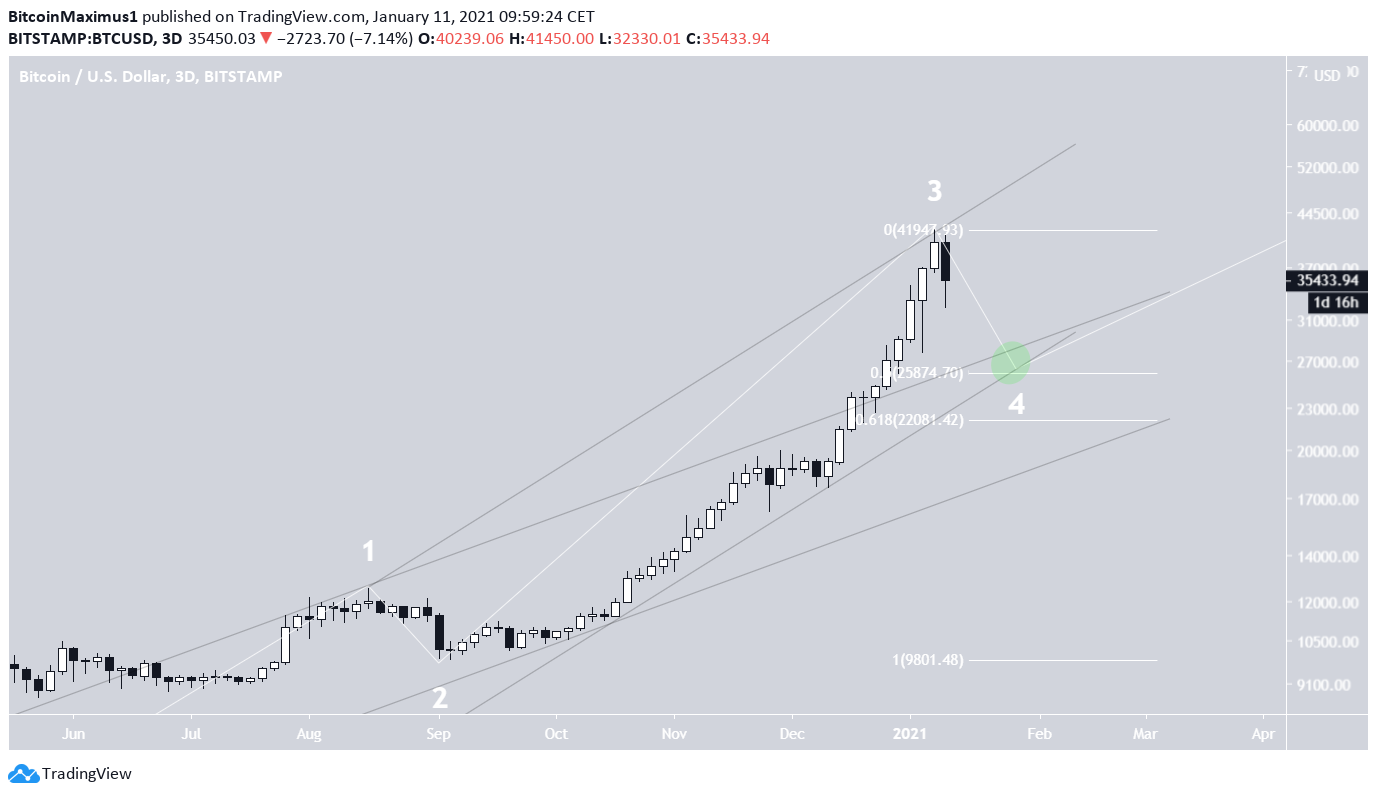
- $25,874 – 0.5 Fib retracement
- $22,081 – 0.618 Fib retracement
In this scenario, BTC would be expected to initiate another upward move and reach a high between $48,858-$52,937.
Using the same fourth wave pullback scenario, the most likely target for a bottom is the 0.5 Fib retracement level at $25,874.
Short-Term Movement
Cryptocurrency trader @CryptoTony_ outlined a BTC count, in which the price reaches a bottom near $35,450 and begins an upward move. However, this count has been invalidated since BTC already reached a lower low.
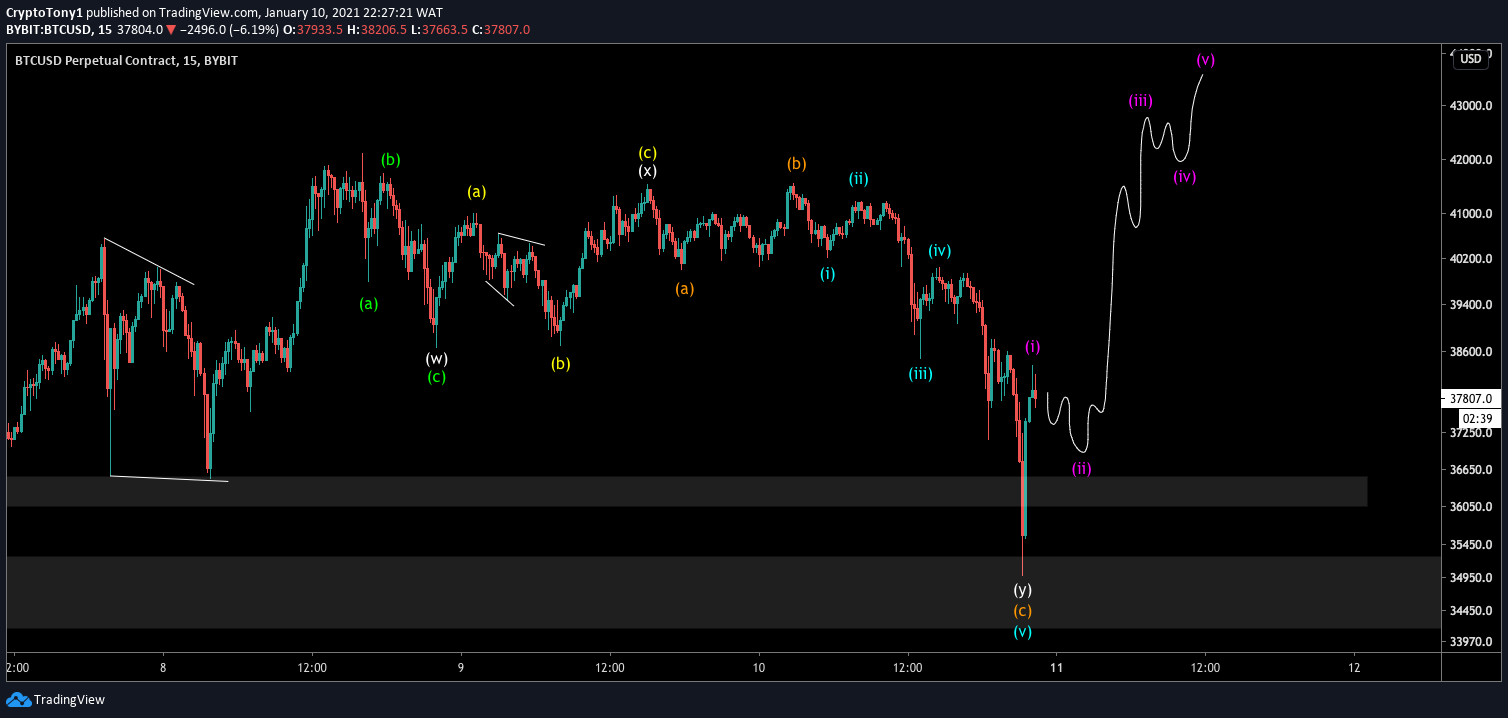
The movement since the Jan. 8 high does look like the beginning of a new bearish impulse (highlighted in red),
Despite the multiple long lower wicks, the movement looks bearish seeing as BTC has not managed to create a higher low.
The only alternative in which the upward move continues is if this is just minor sub-wave 1 of sub-wave 5 (orange).
However, if that were the case, BTC would go much higher. This would further extend the current rally, which is already overextended, making this possibility unlikely.

Conclusion
It’s possible that Bitcoin has completed a bullish trend that began in March and will now correct toward the targets between $18,451 and $27,480.
The alternate count suggests that a bottom near $25,000 will be reached while the primary count estimates that BTC will move lower toward $18,451.
For BeInCrypto’s latest Bitcoin (BTC) analysis, click here!
Disclaimer: Cryptocurrency trading carries a high level of risk and may not be suitable for all investors. The views expressed in this article do not reflect those of BeInCrypto.
The post Bitcoin (BTC) Wave Count Suggests a Top Has been Reached appeared first on BeInCrypto.


![Decentraland: Review & Beginner's Guide [current_date format=Y] 35 Decentraland: Review & Beginner's Guide](https://cryptheory.org/wp-content/uploads/2020/11/decentraland-02-gID_7-300x150.jpg)