Bitcoin Continues Ascent After Breaching $23,000
2 min readTable of Contents
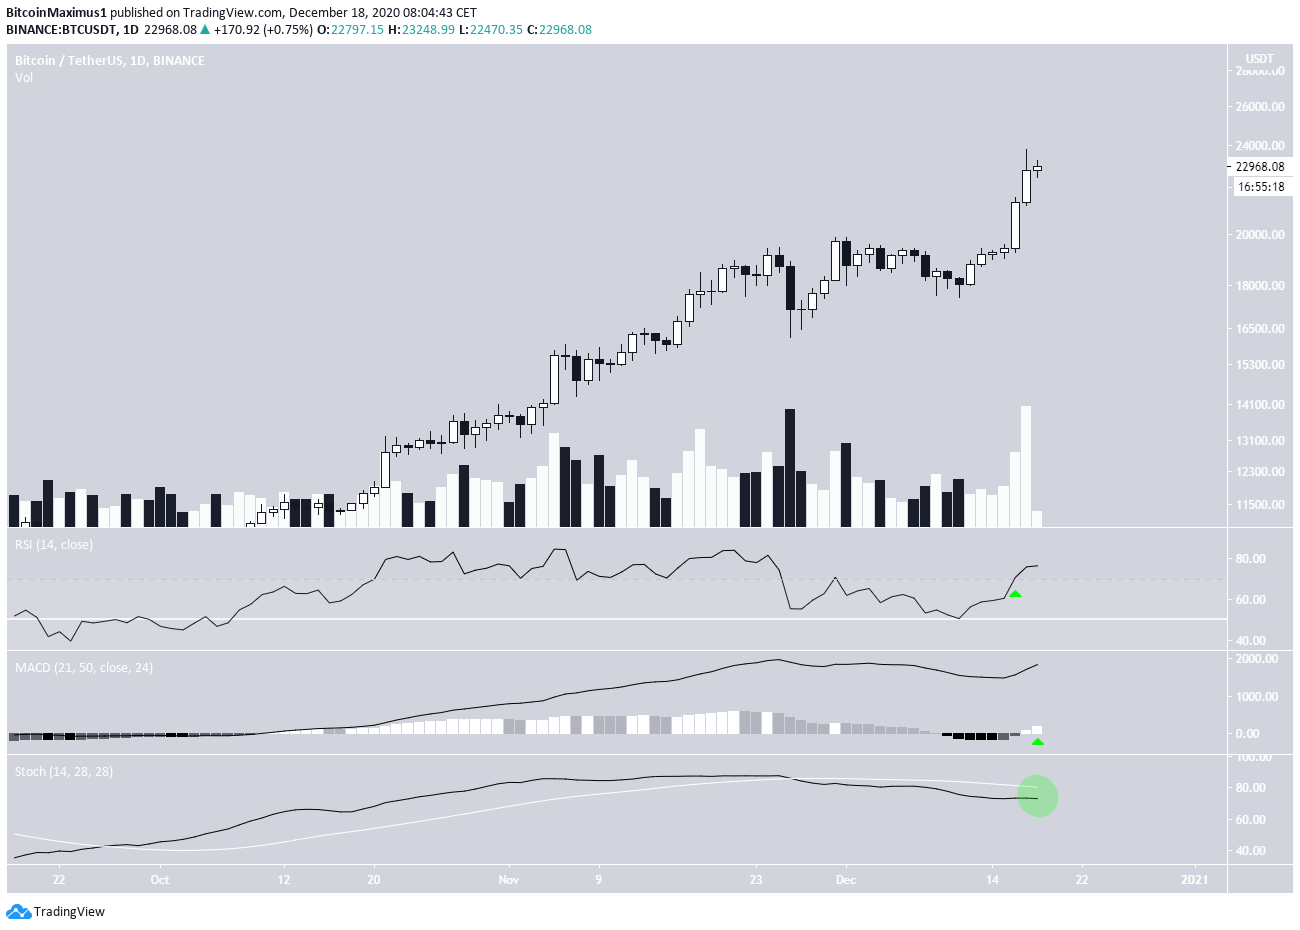
Bitcoin (BTC) has continued its ascent after finally cracking $20,000, reaching a high of $23,800 on Dec. 17.
Bitcoin is expected to continue increasing towards higher targets before an eventual correction.
Bitcoin Chugs Along
The BTC price has continued its upward move after breaking out above $19,500. It reached a high of $23,800 yesterday before creating a small upper wick and decreasing slightly back to $23,000.
Technical indicators in the daily time-frame are bullish. Besides the fact that yesterday’s movement transpired with significant volume, the RSI just crossed back above 70 and the MACD histogram is now positive. The bullish trend continuation would be confirmed by a bullish cross in the Stochastic oscillator.

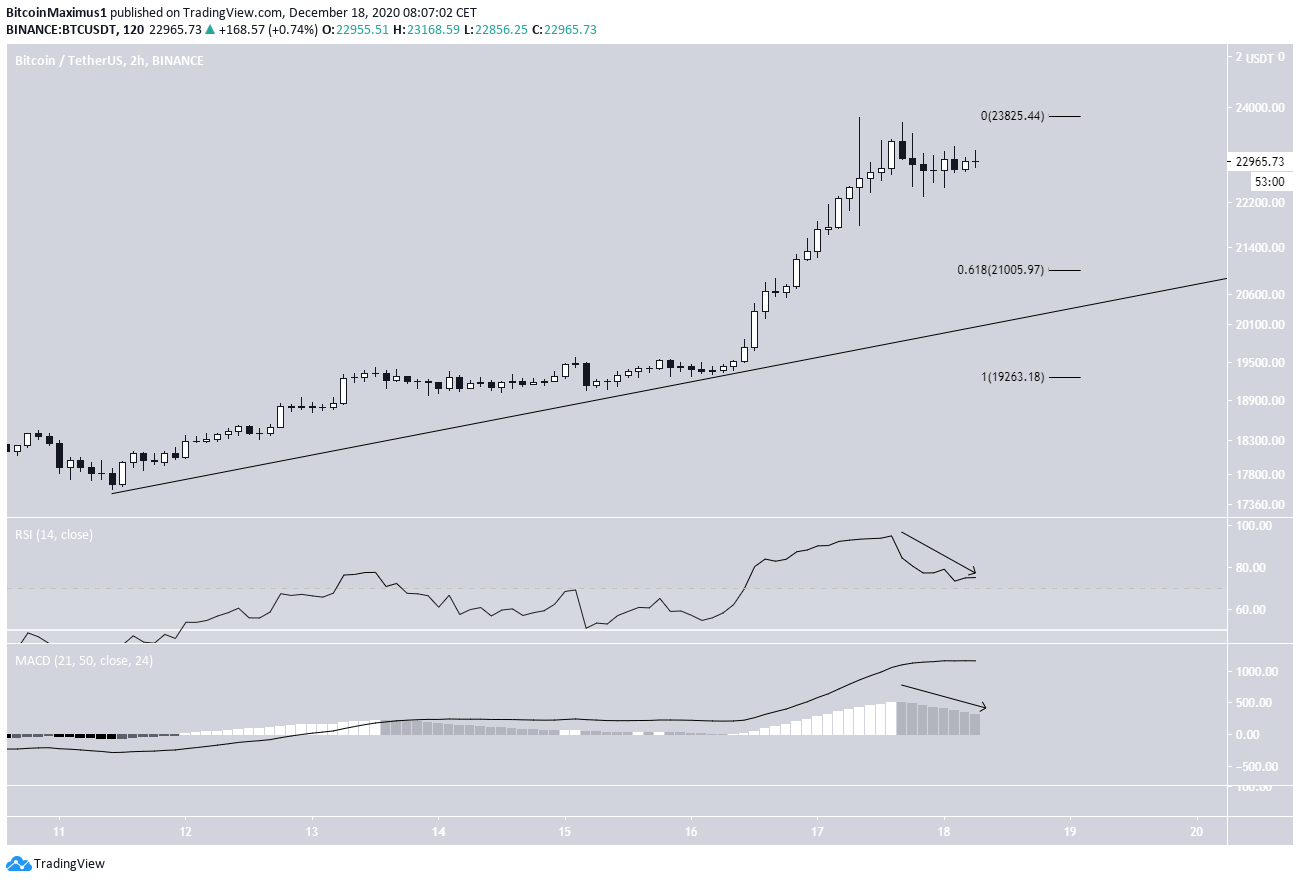
The two-hour time-frame shows that BTC is possibly following an ascending support line, and is considerably above it.
However, lower time-frames are showing some weakness, since both the RSI and MACD are moving downwards. The latter is already giving a reversal signal.
If BTC begins to decrease, the closest support area would be found at $21,000, the 0.618 Fib retracement level which also coincides with the ascending support line.

Wave Count
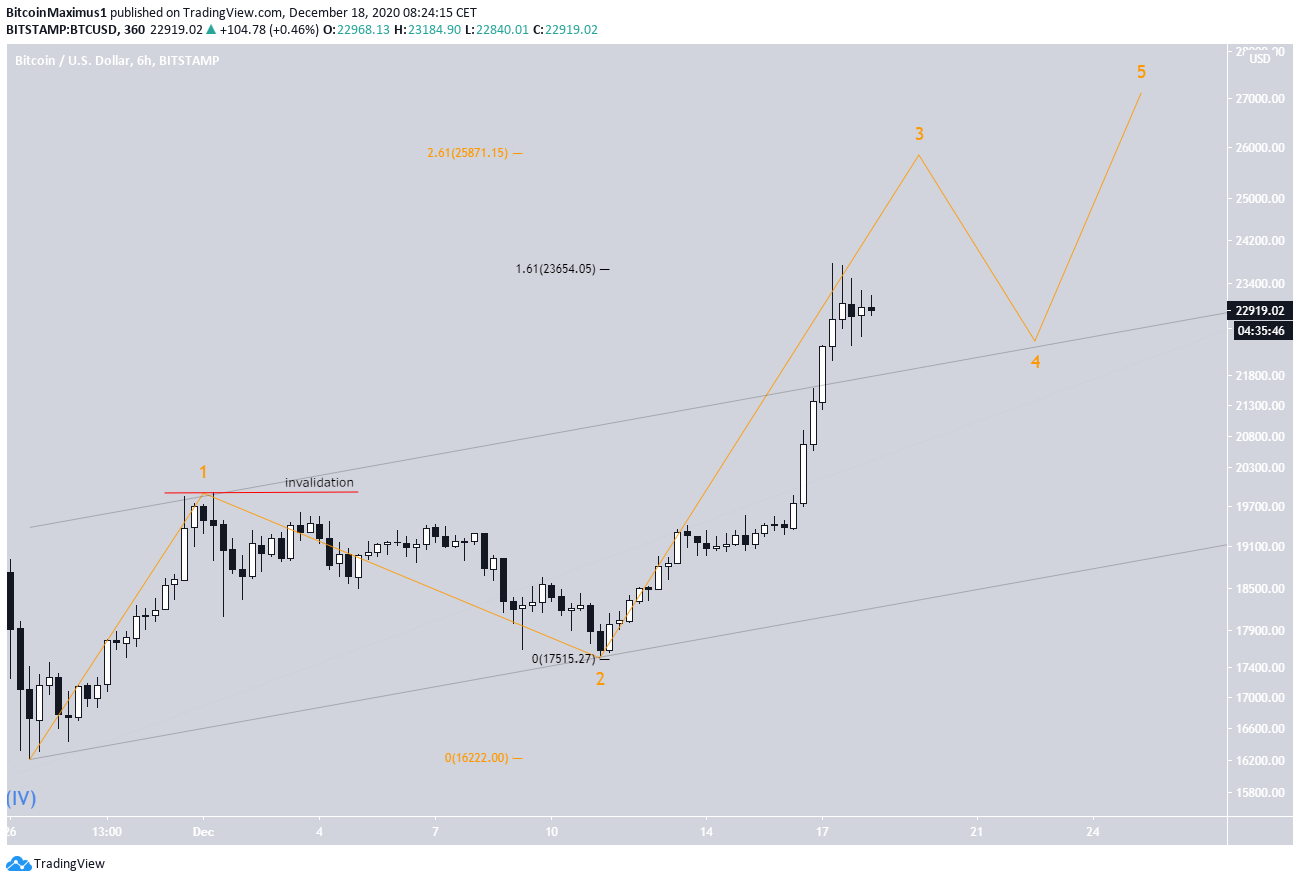
BeInCrypto’s wave count article from Tuesday stated that BTC is in a long-term cycle wave 5 which is expected to take it near $26,000.
The wave count for this cycle is given in orange in the chart below. If correct, BTC is in wave 3, which was confirmed by a breakout from the parallel channel connecting waves 1 and 2.
There are two likely targets for the top of sub-wave 3:
- $25,871; which is found by the 2.61 Fib extension of wave 1 (orange).
- $23,654; which would give waves 1:3 a 1:1.61 ratio, the most common ratio between the two waves (black).
If the latter is correct, then BTC has already completed wave 3 and has now begun wave 4.

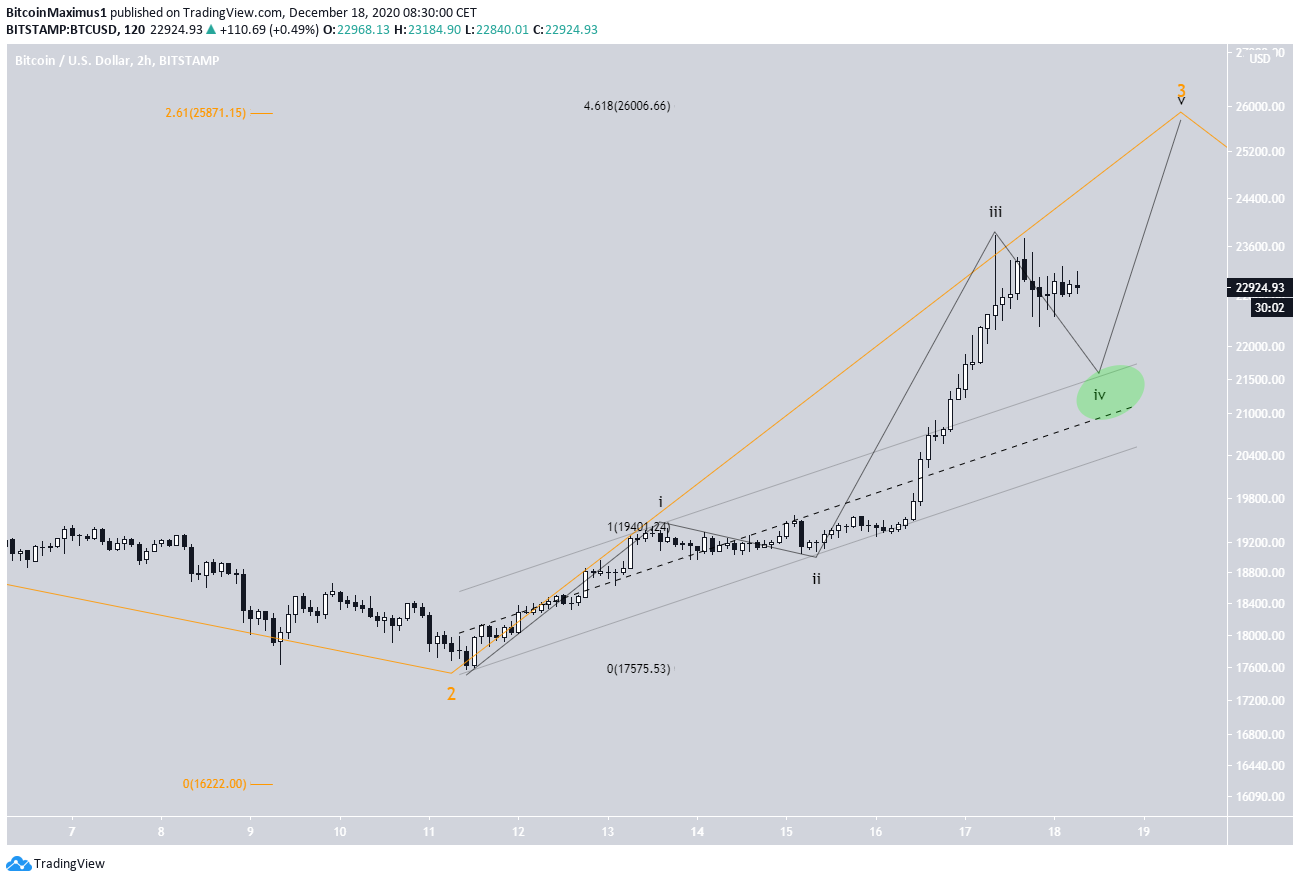
The sub-wave count for wave 3 (black) suggests that wave 3 is not finished, since we can only count two upward moves inside it instead of three. Therefore, BTC is expected to undergo another increase before a potential correction.
BTC could decrease all the way to $21,000-$21,500 (green circle) to complete sub-wave 4 before moving higher.
In addition, using the 4.61 Fib extension of sub-wave 1 gives us a target of $26,000 for the top of wave 3, coinciding with the target from the previous section.

Conclusion
The Bitcoin price is expected to increase toward $26,000. It’s possible that a short-term correction back to $21,500 occurs prior to another upward move.
For BeInCrypto’s previous Bitcoin (BTC) analysis, click here!
Disclaimer: Cryptocurrency trading carries a high level of risk and may not be suitable for all investors. The views expressed in this article do not reflect those of BeInCrypto.
The post Bitcoin Continues Ascent After Breaching $23,000 appeared first on BeInCrypto.


![Decentraland: Review & Beginner's Guide [current_date format=Y] 29 Decentraland: Review & Beginner's Guide](https://cryptheory.org/wp-content/uploads/2020/11/decentraland-02-gID_7-300x150.jpg)