Bitcoin Continues Consolidating Above $36,000
2 min readTable of Contents
The Bitcoin (BTC) price has been increasing since Jan. 12, and is currently consolidating above $36,000 inside a symmetrical triangle.
Bitcoin is expected to find resistance at $37,700. A breakout above $40,112 would suggest that BTC is still in a bullish impulse instead of being in a corrective phase.
Bitcoin Continues its Ascent
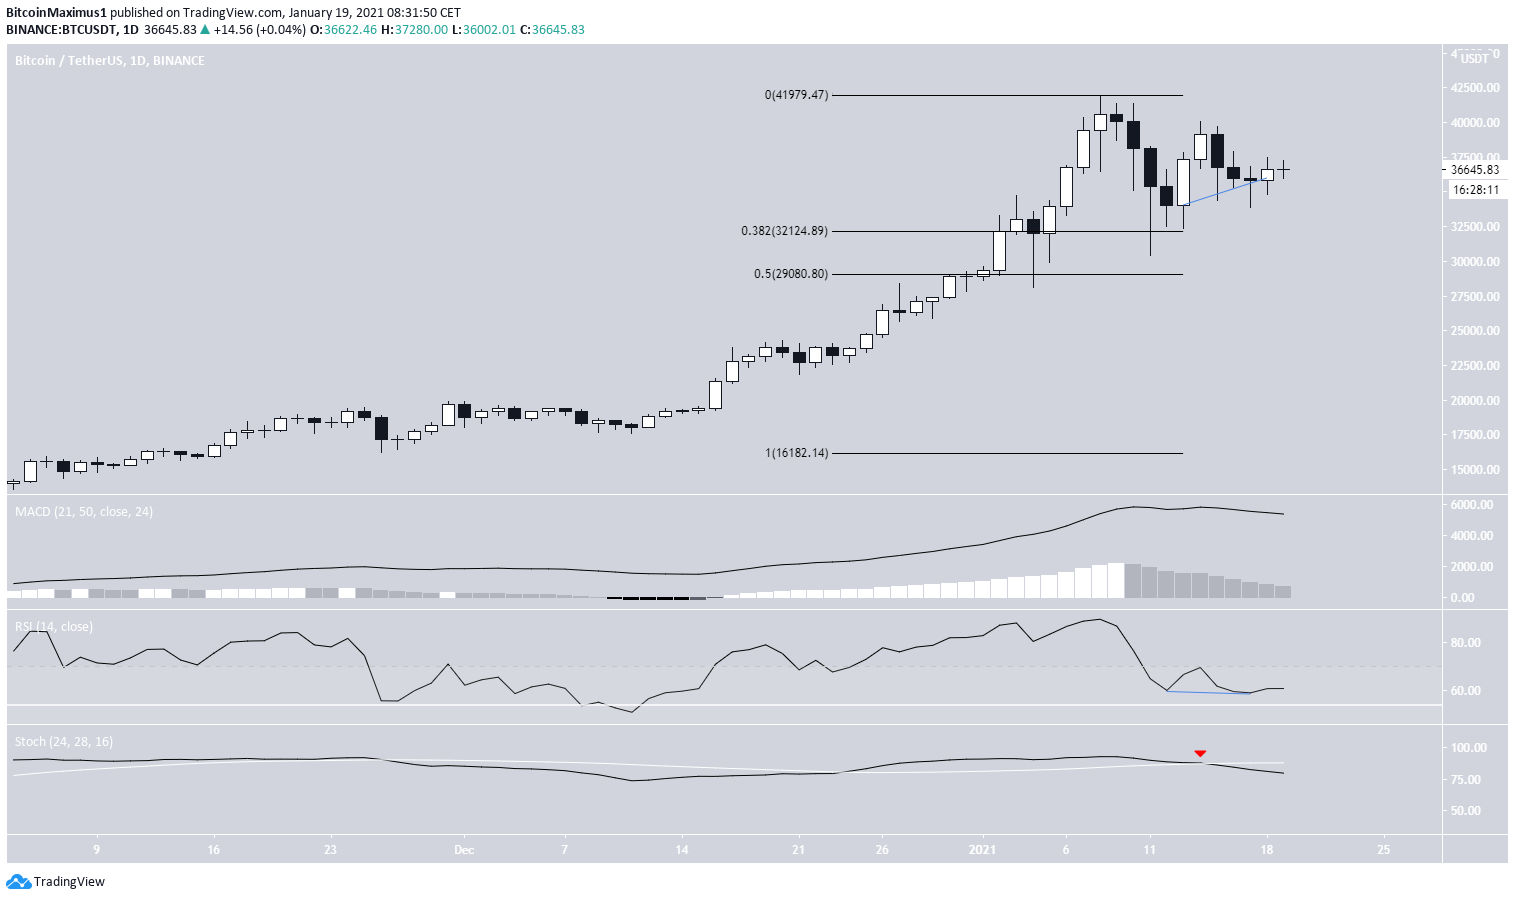
Bitcoin has been increasing since bouncing at the 0.382 Fib retracement support level at $32,124 on Jan. 11. The increase has been relatively gradual and choppy, more akin to a corrective pattern than a bullish impulse.
Despite the hidden bullish divergence in the RSI, the rest of the technical indicators from the daily time-frame are bearish. The Stochastic oscillator has made a bearish cross and the MACD has almost turned negative.
If BTC were to break down, the next closest support area would be found at $29,080 (0.5 Fib retracement).

Symmetrical Triangle
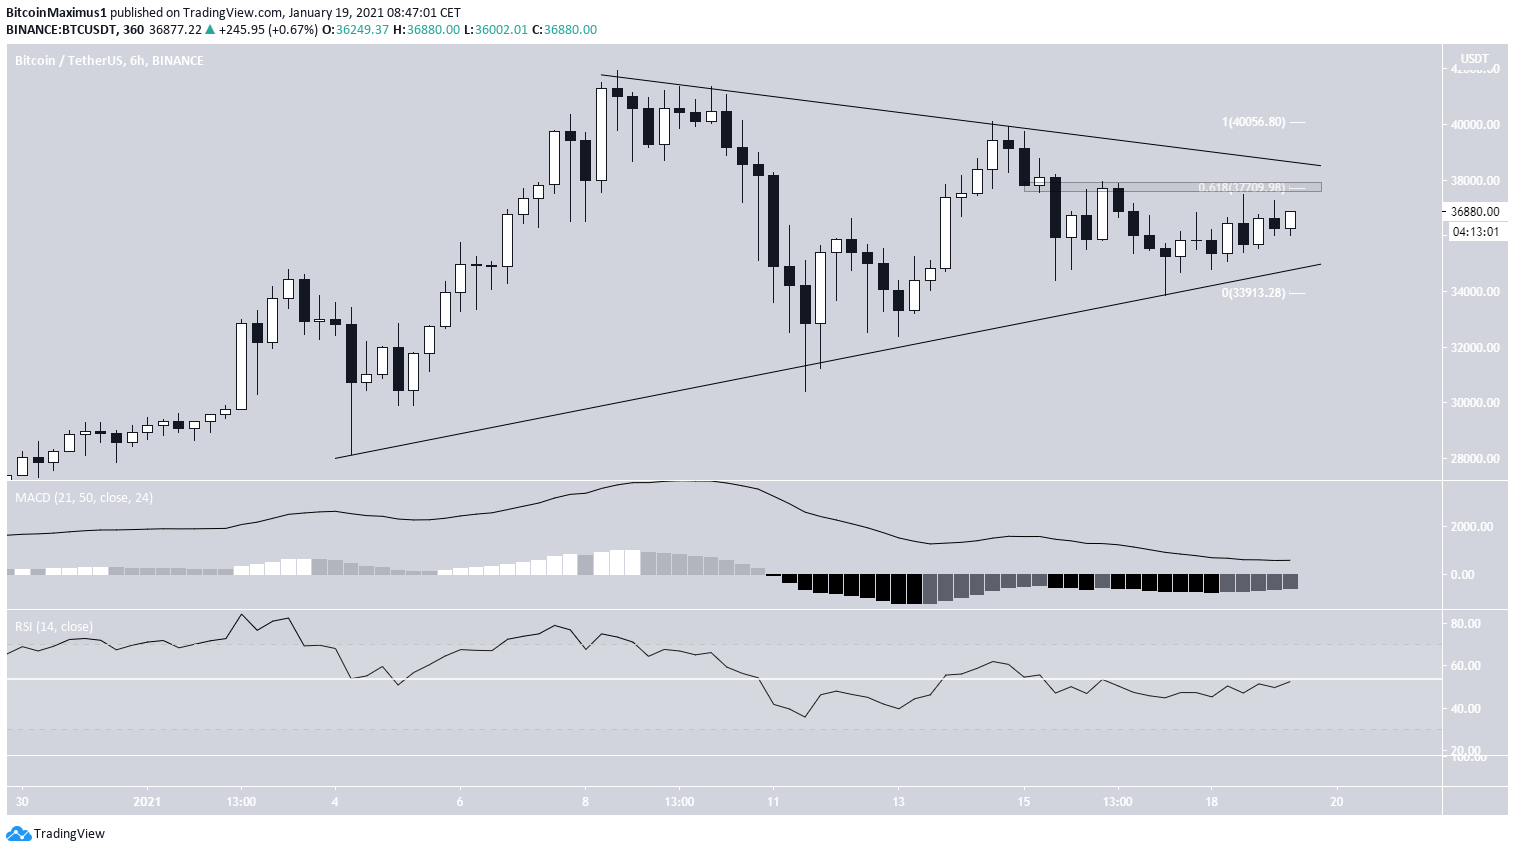
The six-hour chart shows that BTC has been trading inside a symmetrical triangle since Jan. 4. The point of convergence between support and resistance is approaching, so a decisive move is expected to occur.
There is strong resistance at $37,709. This level is the 0.618 Fib retracement level, a horizontal resistance area, and also coincides with the descending resistance line from the triangle.
Technical indicators in the short-term are bullish, but because of the bearishness from higher time-frames, we cannot confidently predict a breakout.

BTC Wave Count
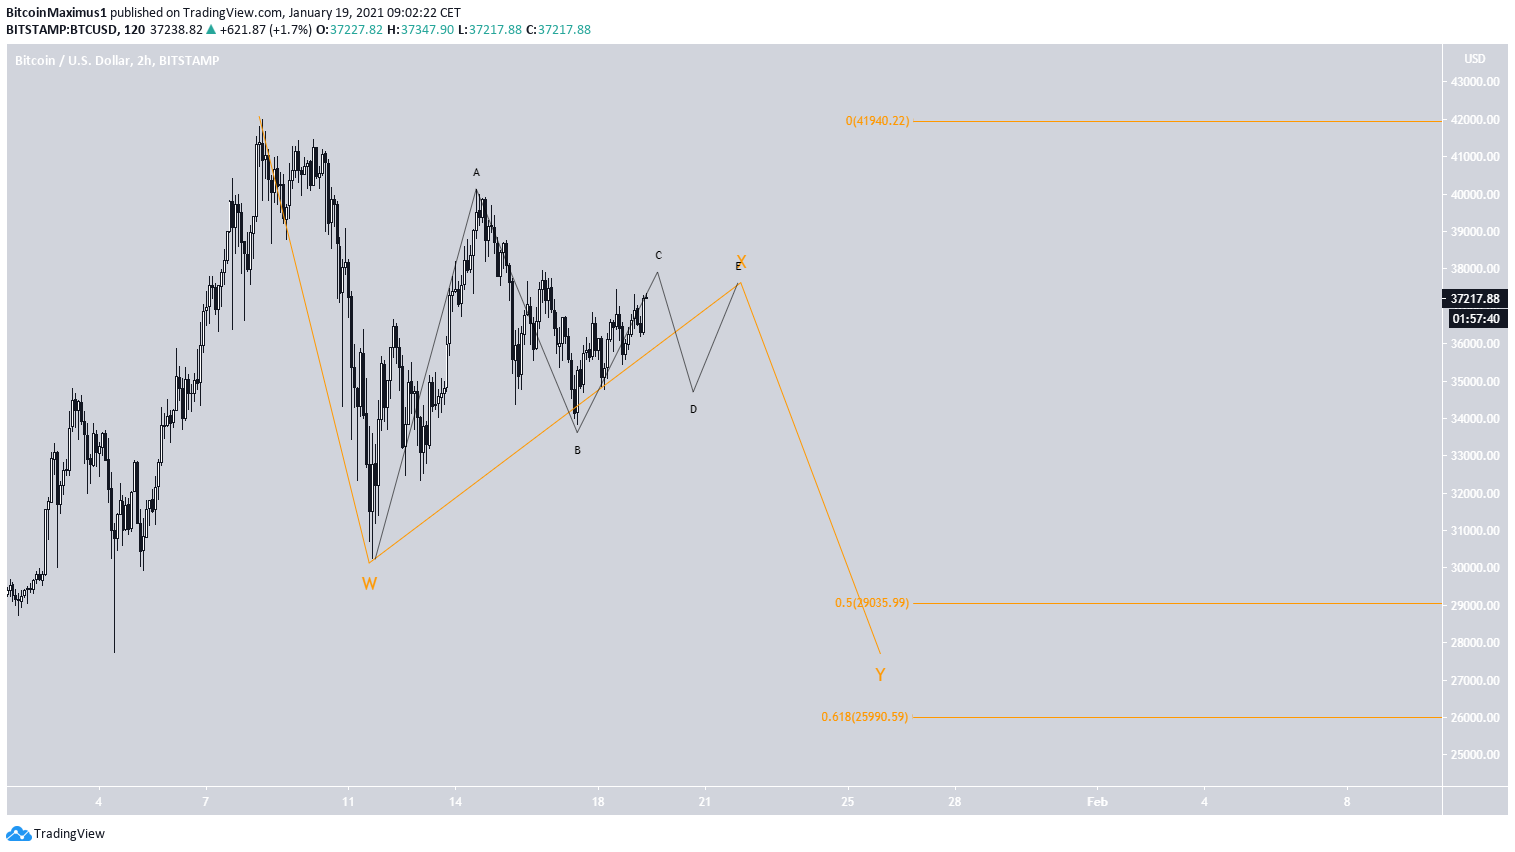
The wave count suggests that BTC is trading inside a complex W-X-Y correction (shown in orange below), in which the X wave is a triangle. This also fits with the longer-term count, which suggests that BTC is correcting from the upward movement beginning in September 2020.
A breakdown from the triangle would likely take BTC to the aforementioned 0.5 Fib retracement support at $29,000, and possibly even the 0.618 Fib at $26,000.
The sub-wave count is given in black A decrease below the B sub-wave low at $33,822 would confirm that this is the correct count.

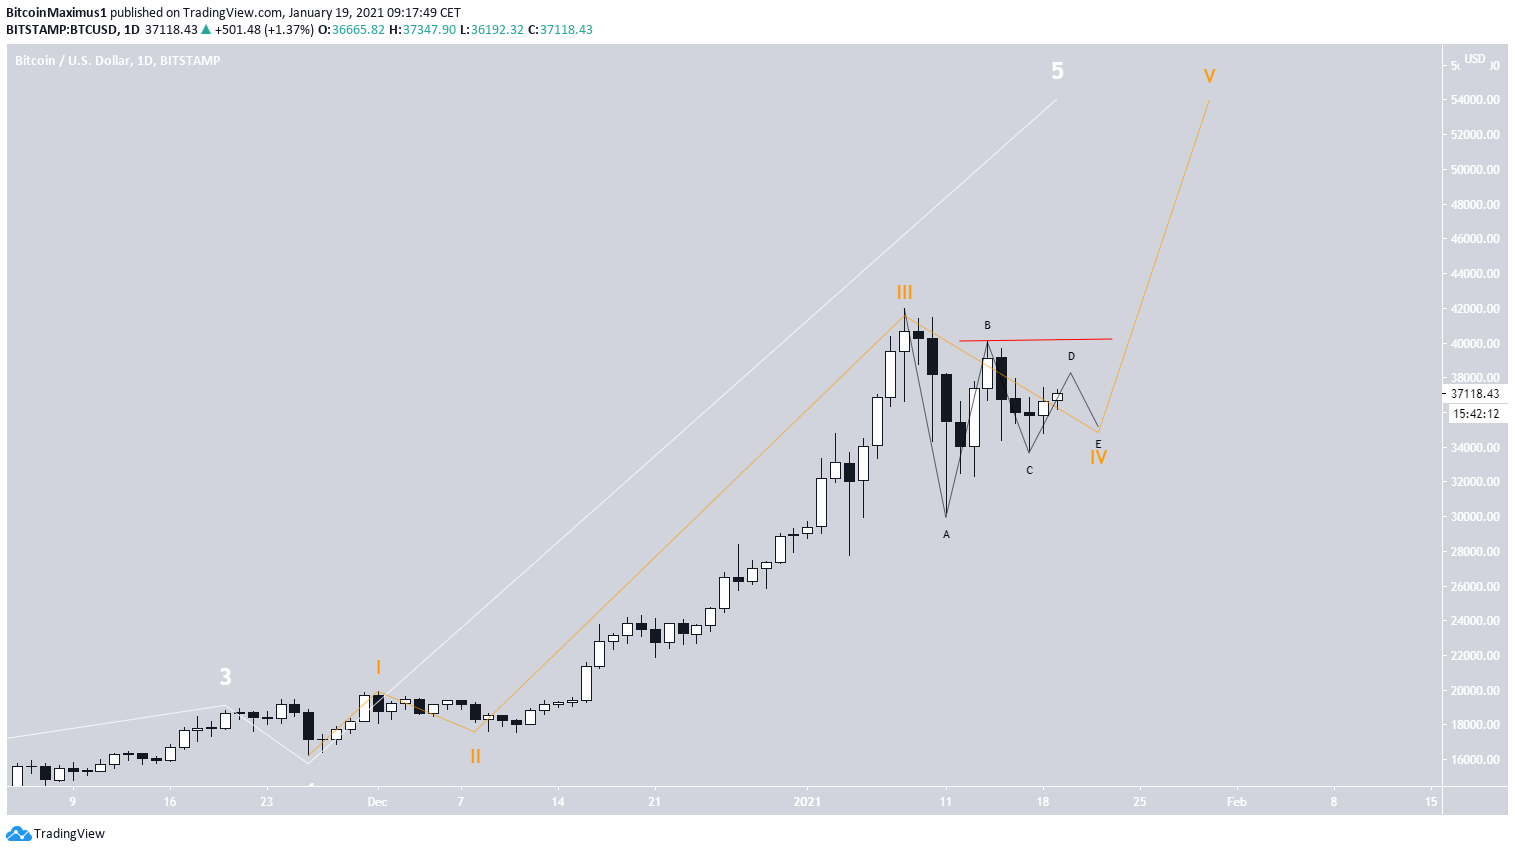
Since this is almost definitely a triangle, the only other possibility would be this being the fourth wave, which could break upwards and take BTC toward $50,000.
However, this does not fit with the longer-term count, Unless BTC manages to break above the B sub-wave high of $40,112, this scenario is unlikely.

Conclusion
Bitcoin is expected to gradually increase to $37,700. A breakout above $40,112 would suggest that BTC is still in a bullish impulse while a decrease below $33,822 would confirm that the trend is bearish.
For BeInCrypto’s latest Bitcoin (BTC) analysis, click here!
Disclaimer: Cryptocurrency trading carries a high level of risk and may not be suitable for all investors. The views expressed in this article do not reflect those of BeInCrypto.
The post Bitcoin Continues Consolidating Above $36,000 appeared first on BeInCrypto.


![Decentraland: Review & Beginner's Guide [current_date format=Y] 29 Decentraland: Review & Beginner's Guide](https://cryptheory.org/wp-content/uploads/2020/11/decentraland-02-gID_7-300x150.jpg)