Bitcoin Fails to Close Above $34,000 Resistance
2 min readTable of Contents
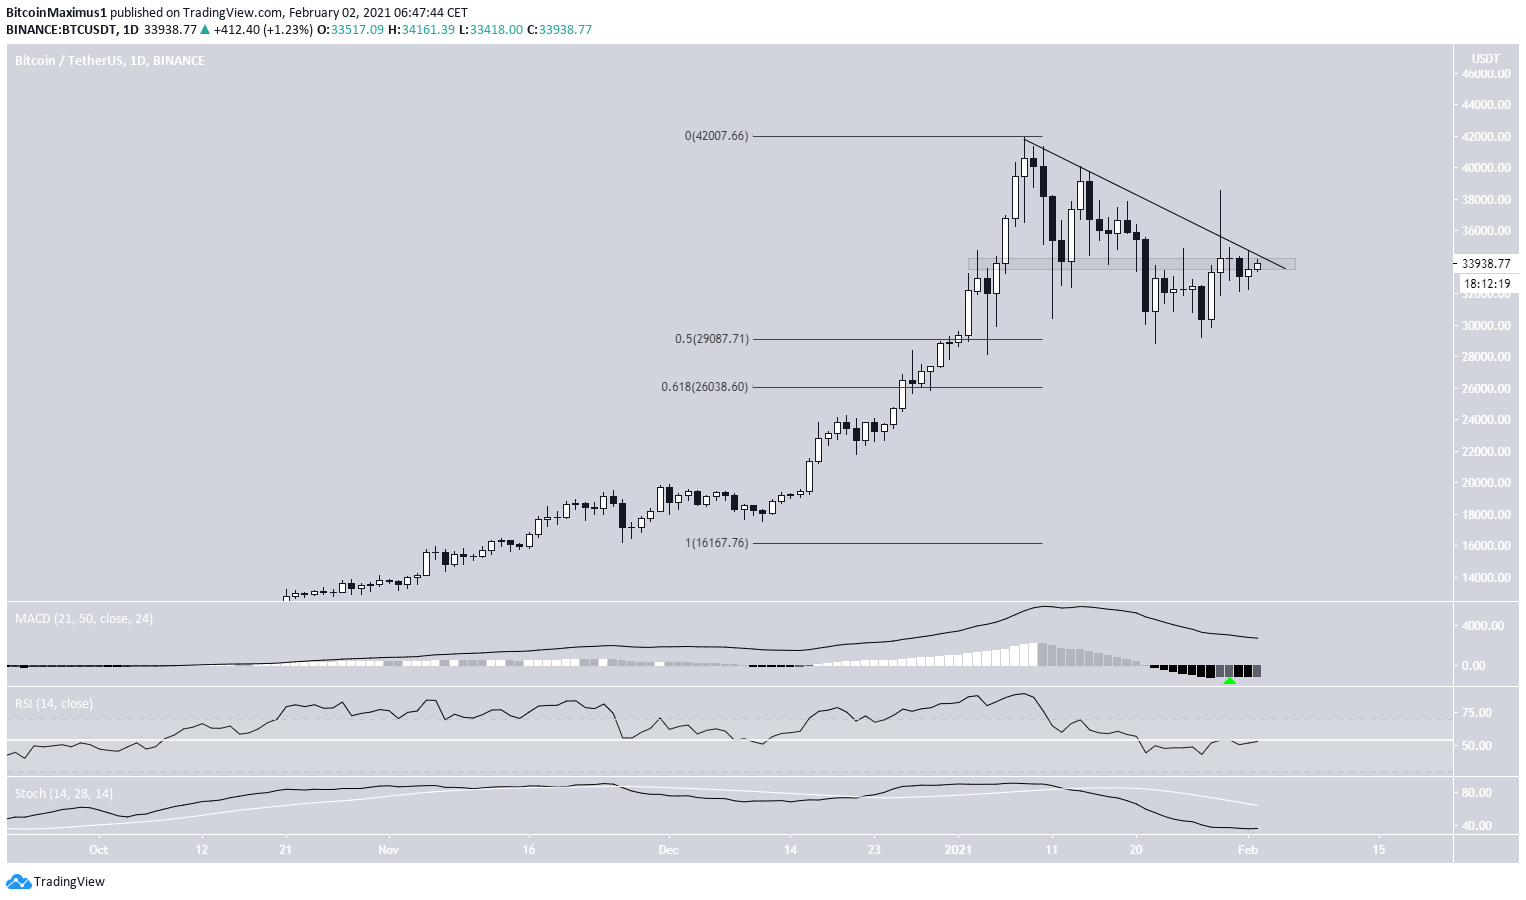
The Bitcoin (BTC) price consolidated on Feb. 1, but is still trading below the $34,000 resistance area and a descending resistance line.
It’s likely that Bitcoin is still in a corrective structure and will eventually resume its downward movement.
Bitcoin Struggles with Resistance
On Feb. 1, BTC traded above and below its opening price but failed to initiate an upward movement of any significance.
BTC is still trading below a descending resistance line that has been in place since the all-time high price of Jan. 8.
Technical indicators are still bearish.
While the MACD has made an attempt at initiating a bullish reversal (shown with the green arrow below), it was promptly pushed down. The RSI is below 50 and the Stochastic oscillator is also decreasing.
The closest support area is found at $29,000. Below that there is another support level at $26,000.

Short-Term Resistance
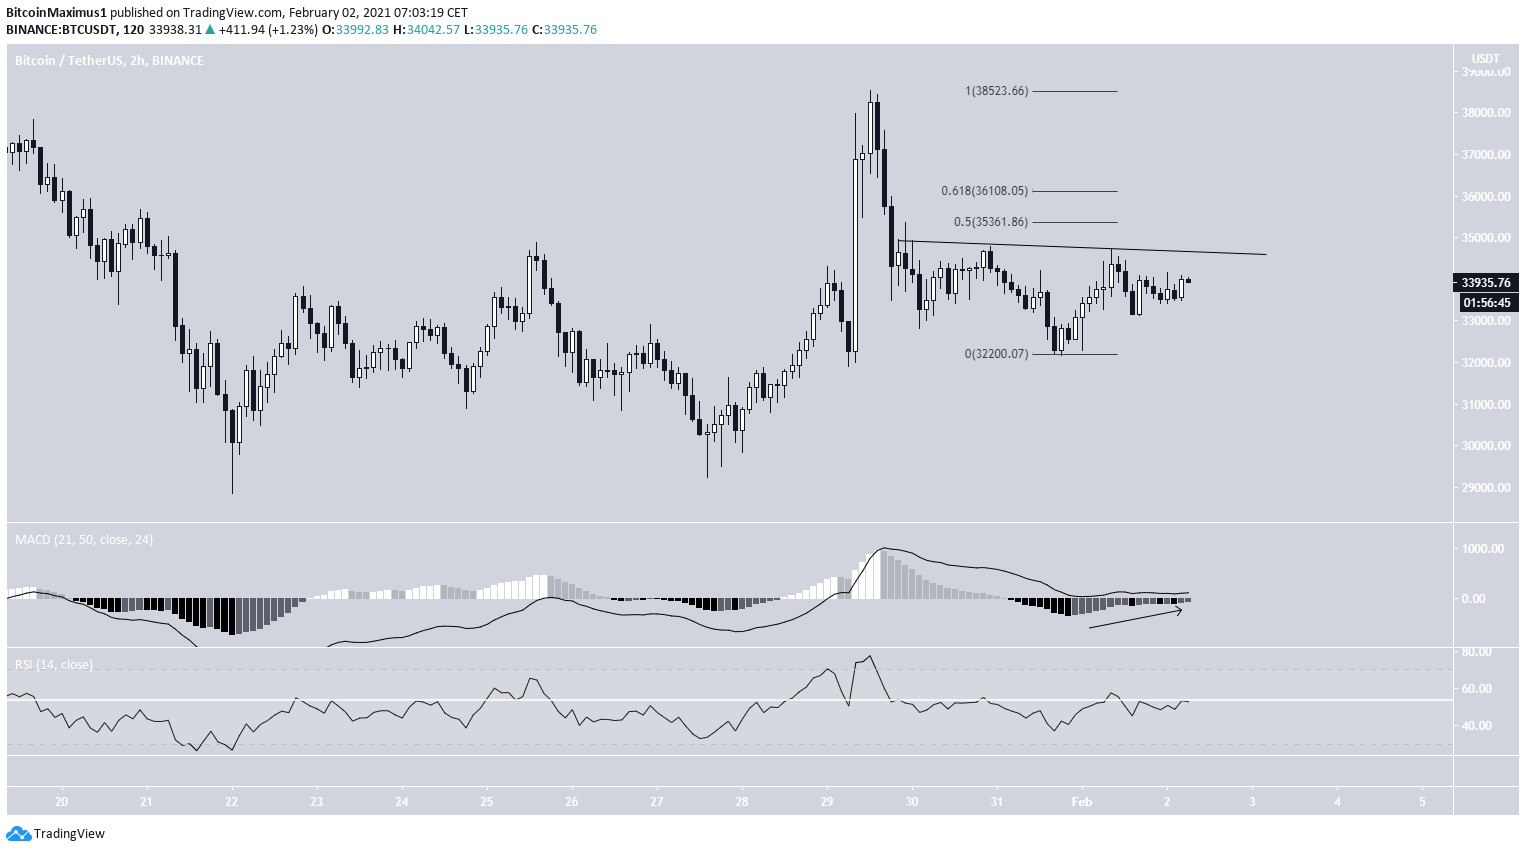
The two-hour chart shows another descending resistance line that BTC has been following over the past two days.
While the MACD has gradually begun to turn bullish and the RSI is increasing, it seems that BTC is retracing rather than beginning a new upward move.
Even if BTC were to break out from the resistance line, there are other resistances at $35,350 and $36,108 (0.5 and 0.618 Fib retracement levels).
Unless BTC manages to reclaim the 0.618 Fib retracement resistance at $36,100, it is likely that the current increase is corrective.

Wave Count
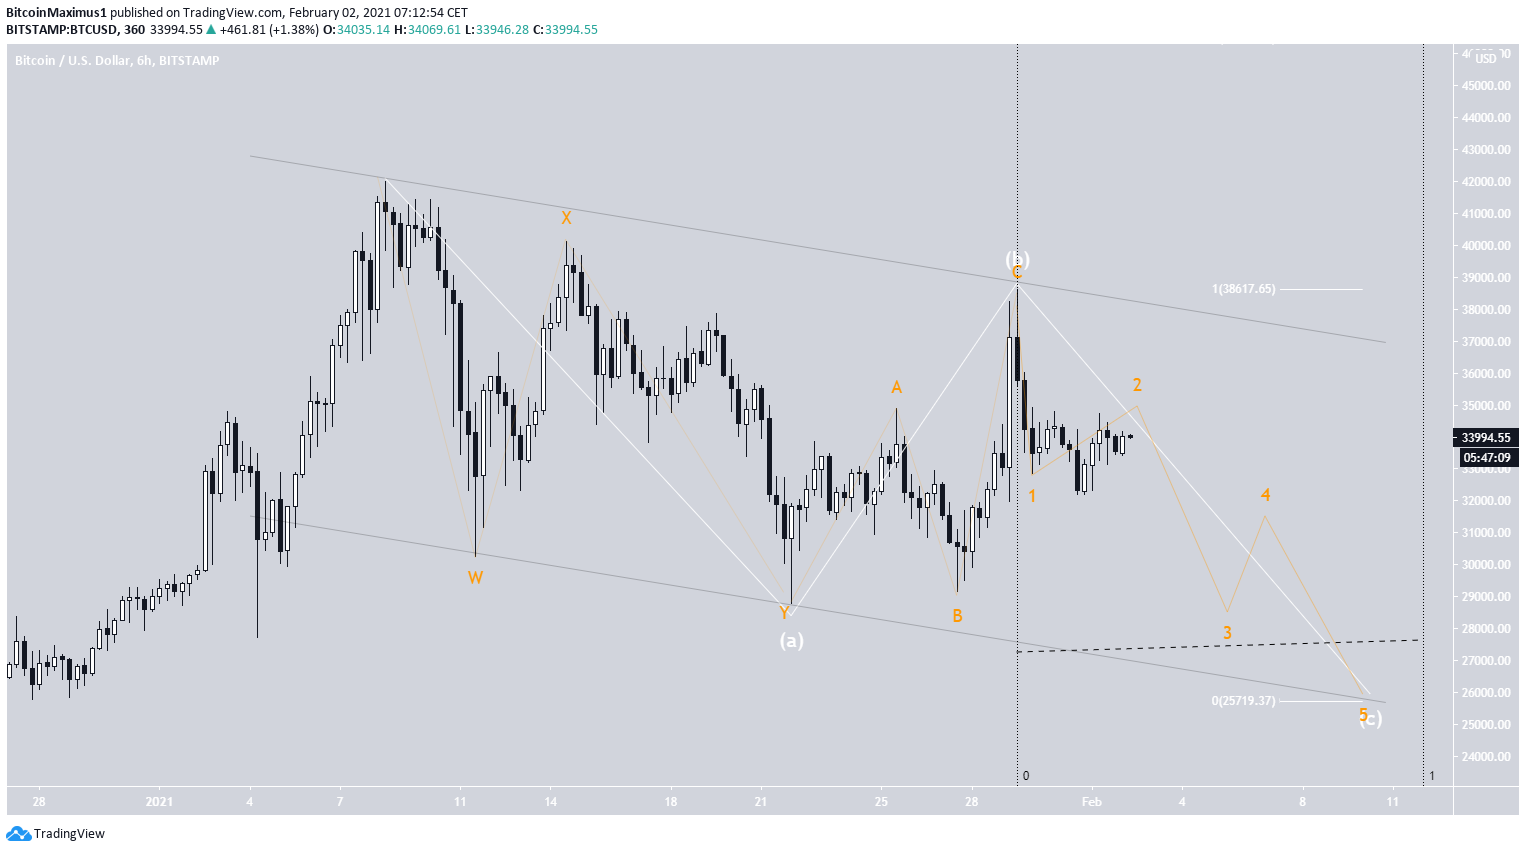
The wave count suggests that BTC is in the C wave of an A-B-C corrective structure (shown in white below).
If waves A:C have a 1:1 ratio —common in such corrections — BTC would reach a low of $25,719. This coincides with the support line of a potential descending parallel channel and the 0.5 Fib retracement level support outlined in the first section.
If waves A:C take the same amount of time, BTC would reach a low on Feb. 11.
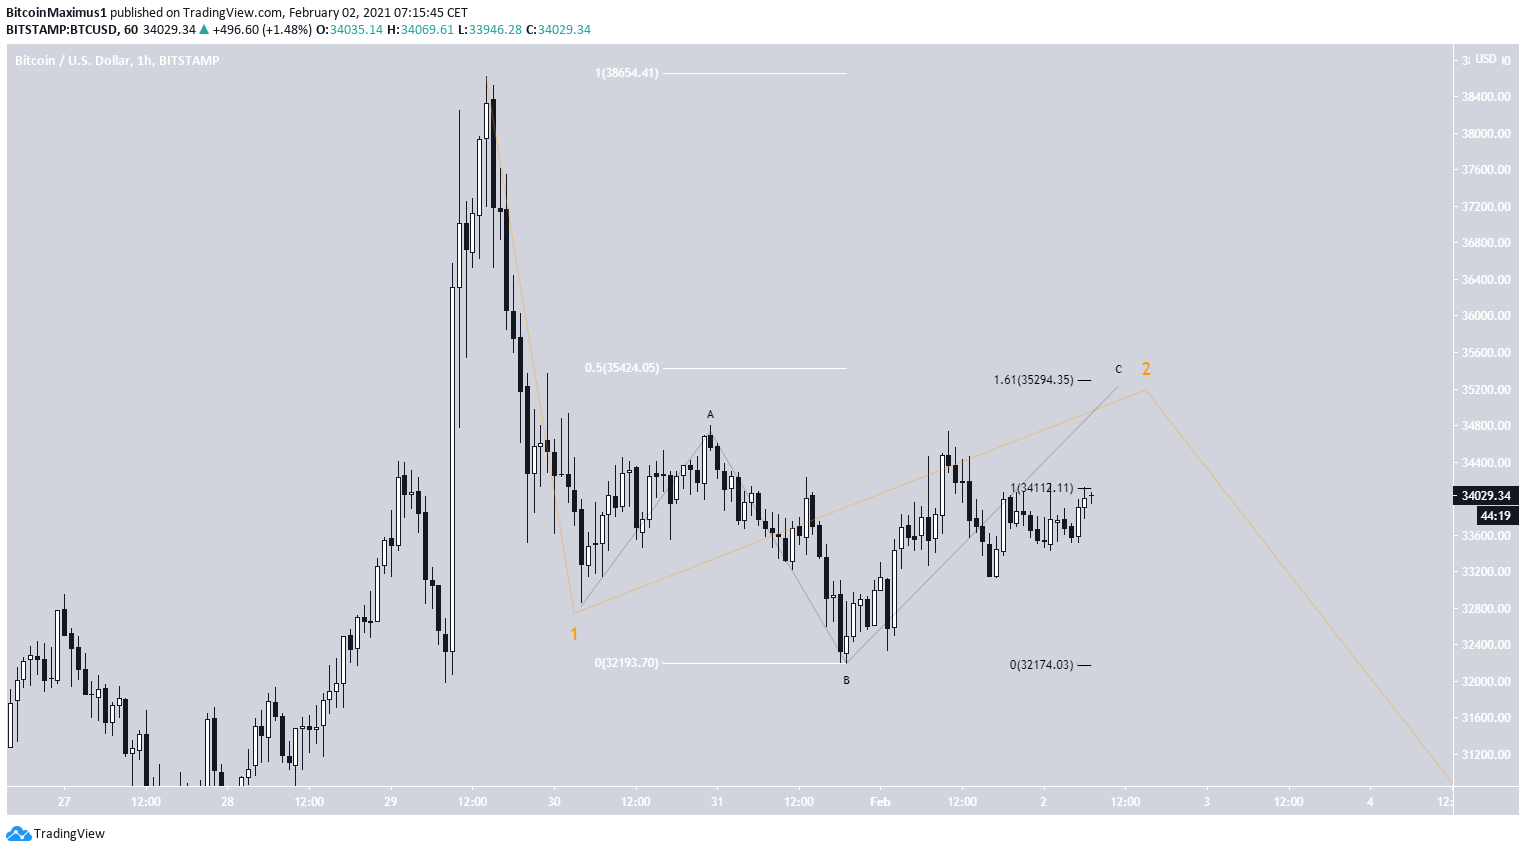
The sub-wave count is given in orange and BTC is in sub-wave 2.

A closer look shows that BTC has possibly one more upward move left towards $35,300 before resuming its downward movement.

Conclusion
Bitcoin is likely in the final leg of a corrective structure that will eventually take it toward $26,000.
For BeInCrypto’s previous Bitcoin (BTC) analysis, click here
The post Bitcoin Fails to Close Above $34,000 Resistance appeared first on BeInCrypto.


![Decentraland: Review & Beginner's Guide [current_date format=Y] 29 Decentraland: Review & Beginner's Guide](https://cryptheory.org/wp-content/uploads/2020/11/decentraland-02-gID_7-300x150.jpg)