BTC (BTC) Defends Long-Term Support Level
2 min readBTC (BTC) decreased slightly during the week of July 7-12, trading in a range between $35,293 and $32,077.
It has broken out from a short-term descending parallel channel and is now trading inside an identical pattern in the medium-term.
BTC defends long-term support
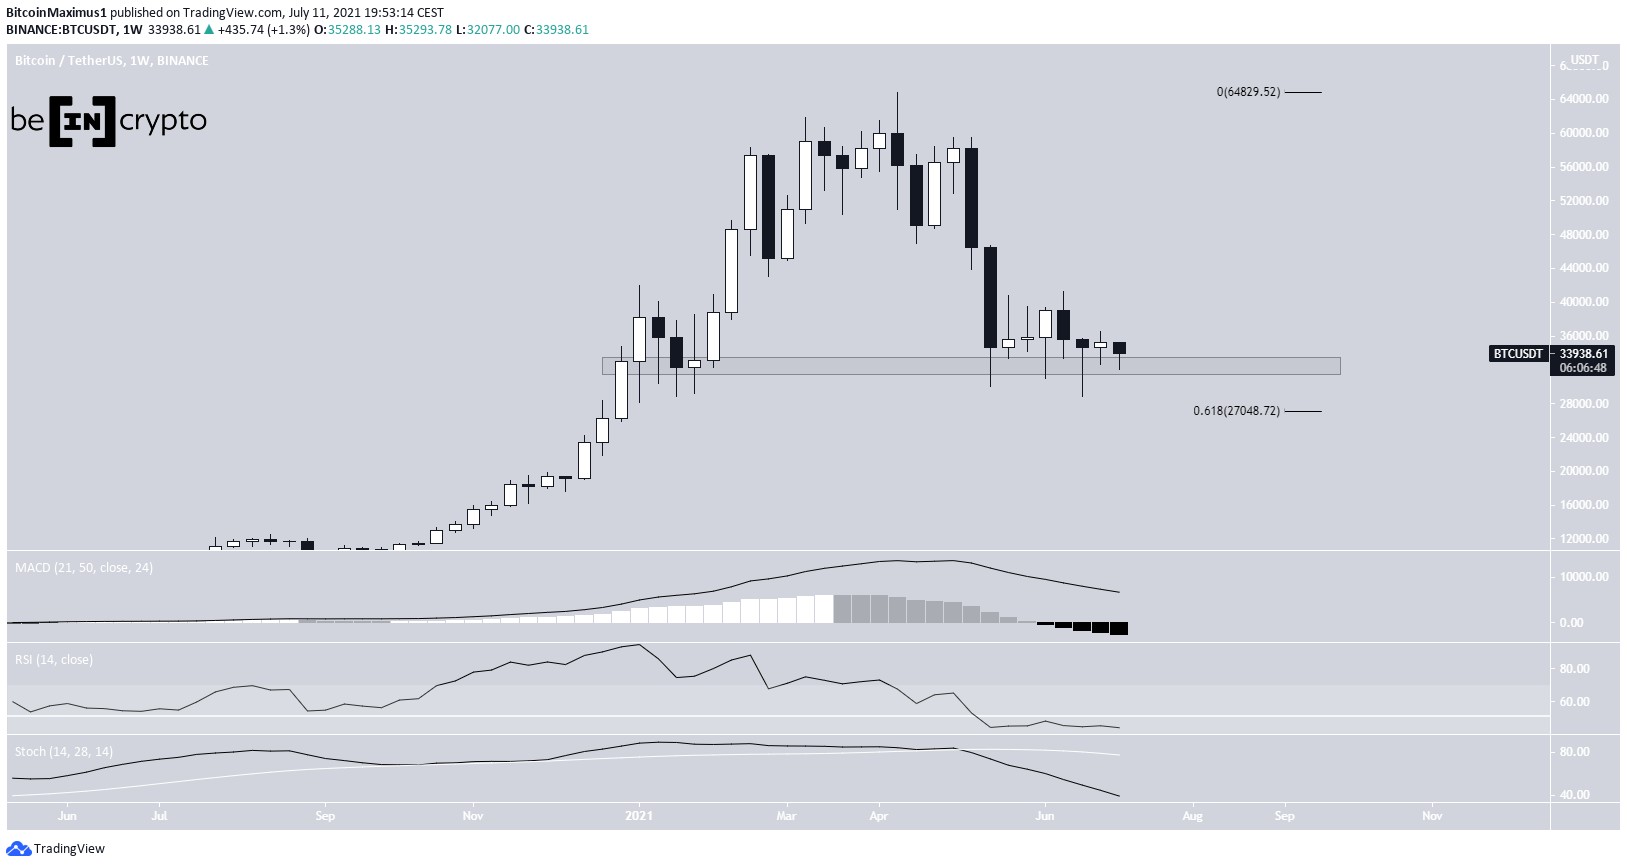
BTC decreased slightly during the week of July 7-12. It proceeded to reach a low of $32,077 before rebounding slightly and closing at $34,258.
It has been trading above the $32,400 horizontal support area since May 19. While BTC created several long lower wicks below this area, it has not managed to reach a close below it. Therefore, the support area is still intact.
Despite this occurrence, technical indicators are bearish. The MACD is negative and decreasing, the RSI has fallen below 50, and the Stochastic oscillator has made a bearish cross.
The 0.618 Fib retracement support level is located at $27,050.

Trading range
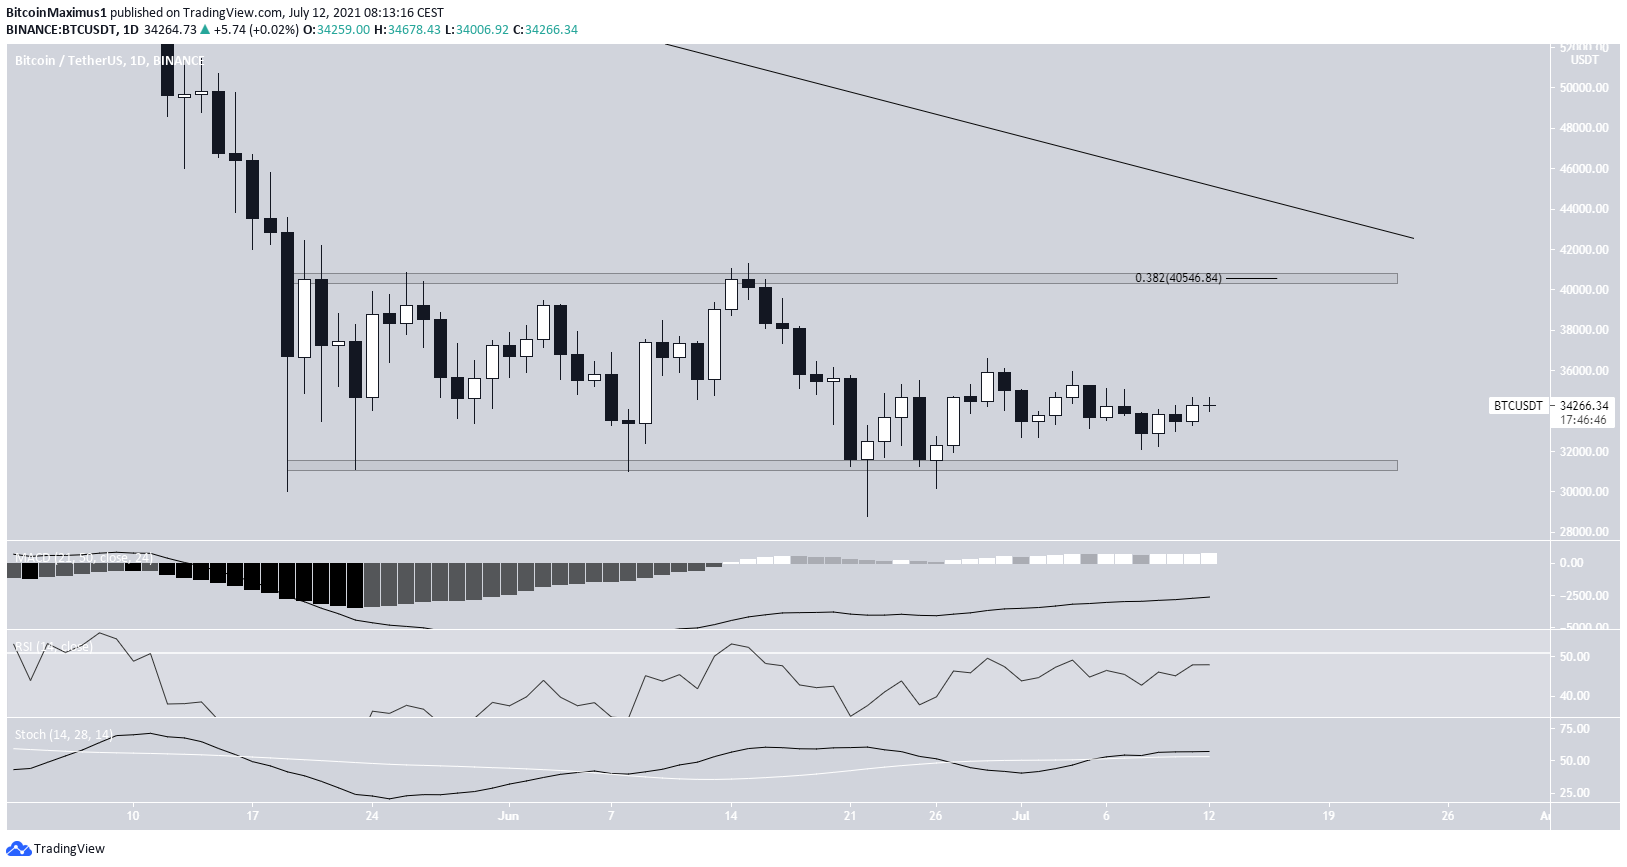
The daily chart shows that BTC has been trading in a range between $31,300 and $40,550 since May 19. It bounced from the support line of the range on June 22 (green icon), created a higher low on June 26, and has been moving upwards since.
However, BTC is still trading close to the middle of the range. In addition to this, technical indicators are relatively neutral. The MACD is increasing but is not yet positive, the RSI is still below 50, and while the Stochastic oscillator has made a bullish cross, it has barely moved upwards.
Until BTC breaks out or down from this range, the trend cannot be clearly determined.

Short-term movement
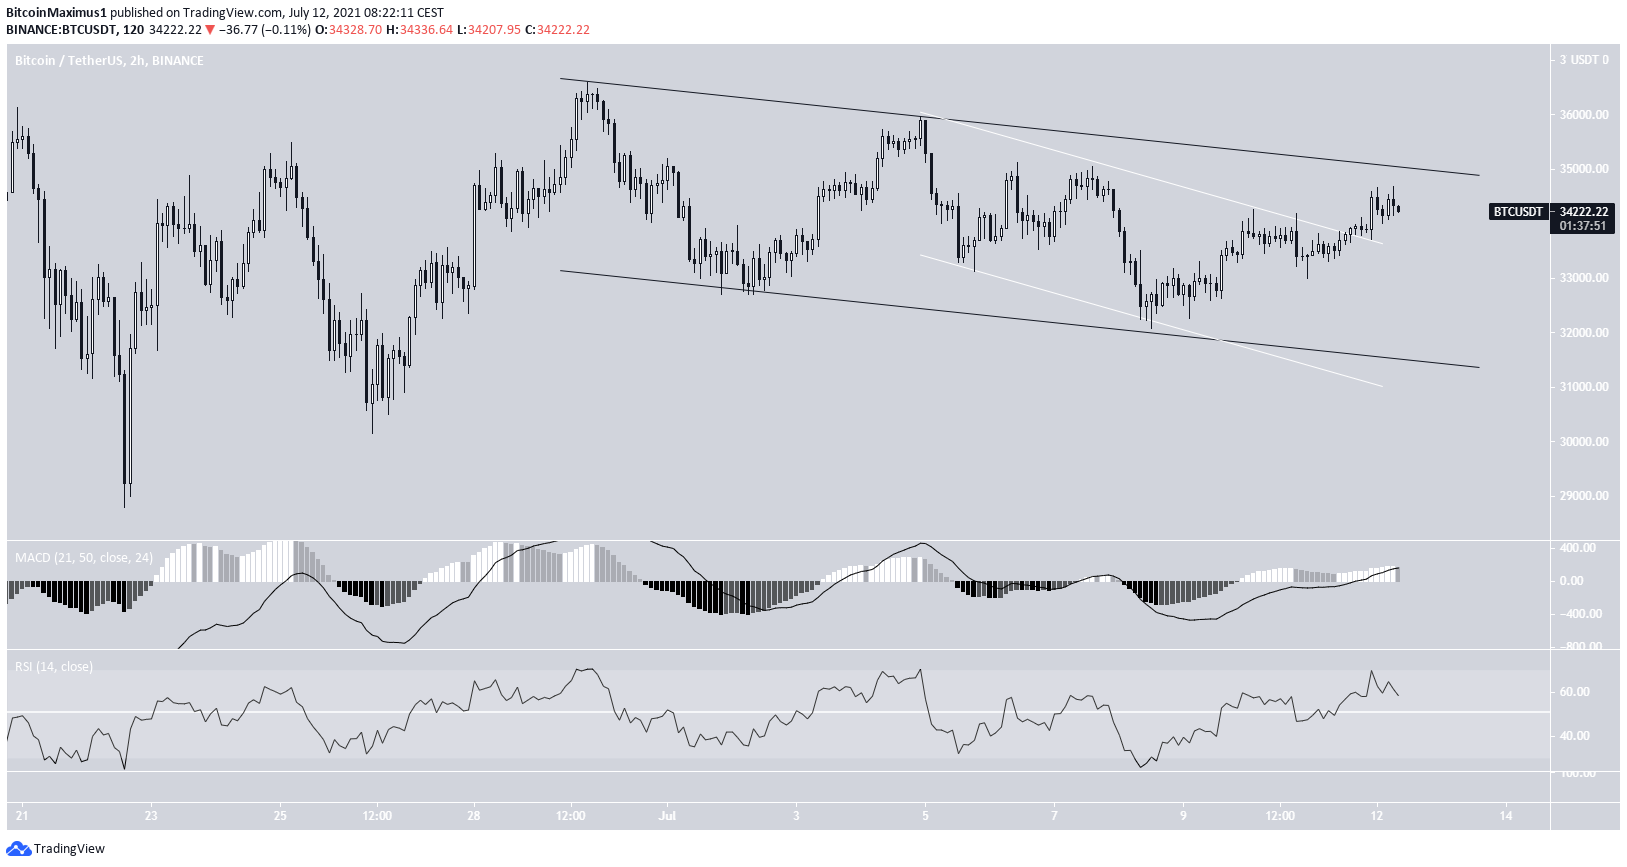
The two-hour chart shows that BTC is trading inside a descending parallel channel (black) since June 29.
While inside the pattern, it has broken out from a shorter-term channel (white).
Both the RSI and MACD are bullish and increasing. Therefore, a breakout from the longer-term channel would be likely.

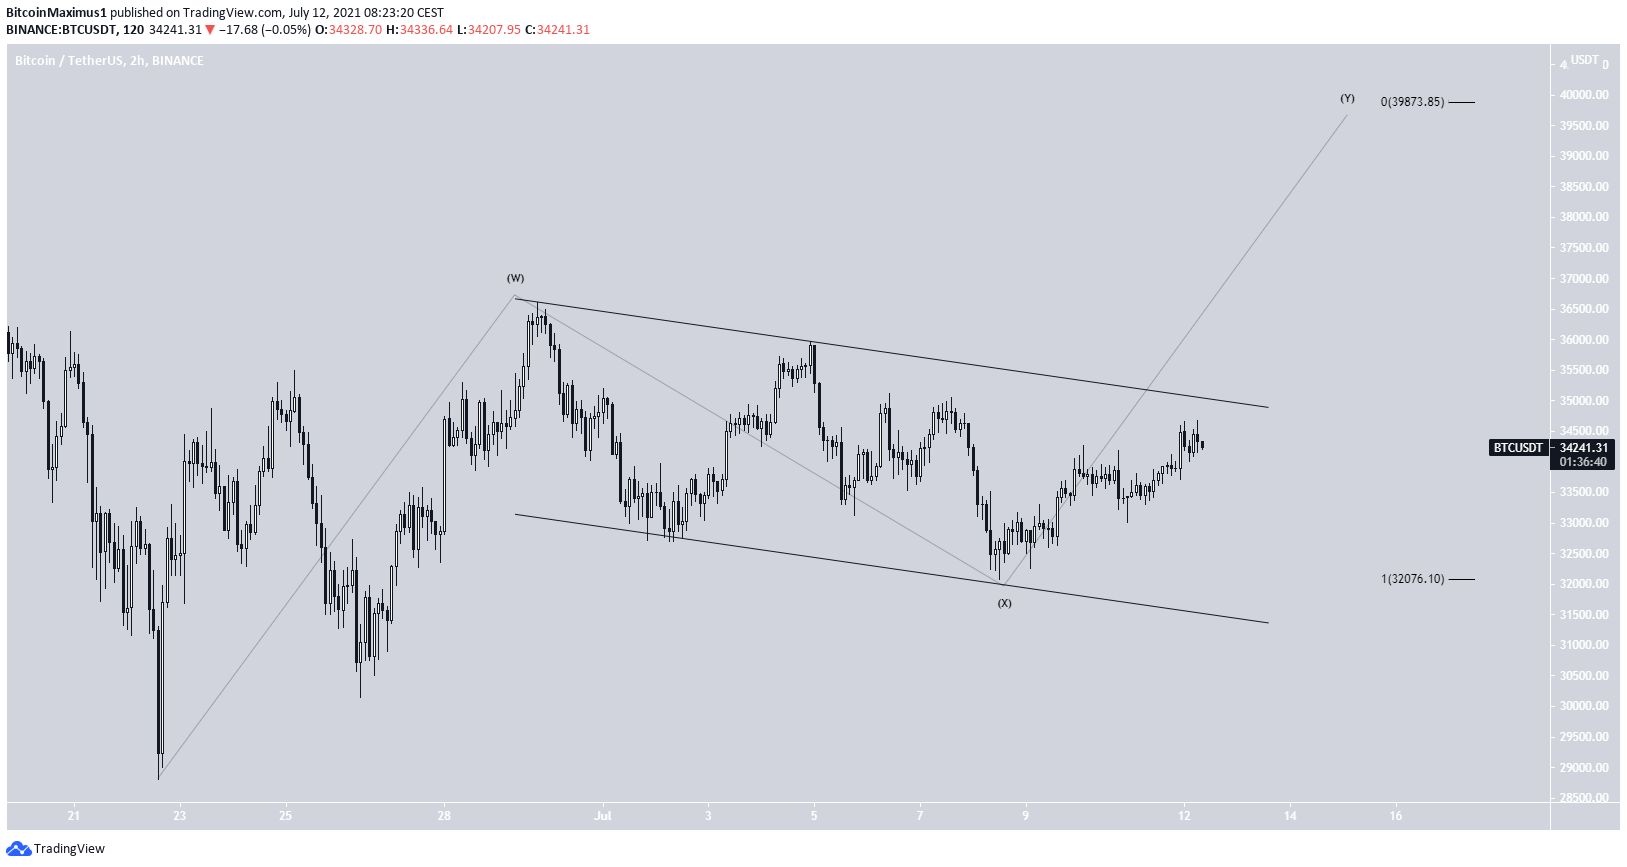
The wave count suggests that this is a complex W-X-Y corrective structure. If so, BTC is currently in the Y wave.
Giving waves W:Y a 1:1 ratio would lead to a high near $40,000, very close to the top of the range outlined in the daily time-frame.

For BeInCrypto’s previous BTC (BTC) analysis, click here.
The post BTC (BTC) Defends Long-Term Support Level appeared first on BeInCrypto.


![Decentraland: Review & Beginner's Guide [current_date format=Y] 29 Decentraland: Review & Beginner's Guide](https://cryptheory.org/wp-content/uploads/2020/11/decentraland-02-gID_7-300x150.jpg)