bZx Protocol (BZRX) Attempts to Regain Footing After Hitting Local High
2 min readTable of Contents
The bZx Protocol (BZRX) price has been decreasing since reaching a high of $0.84 on Feb. 13.
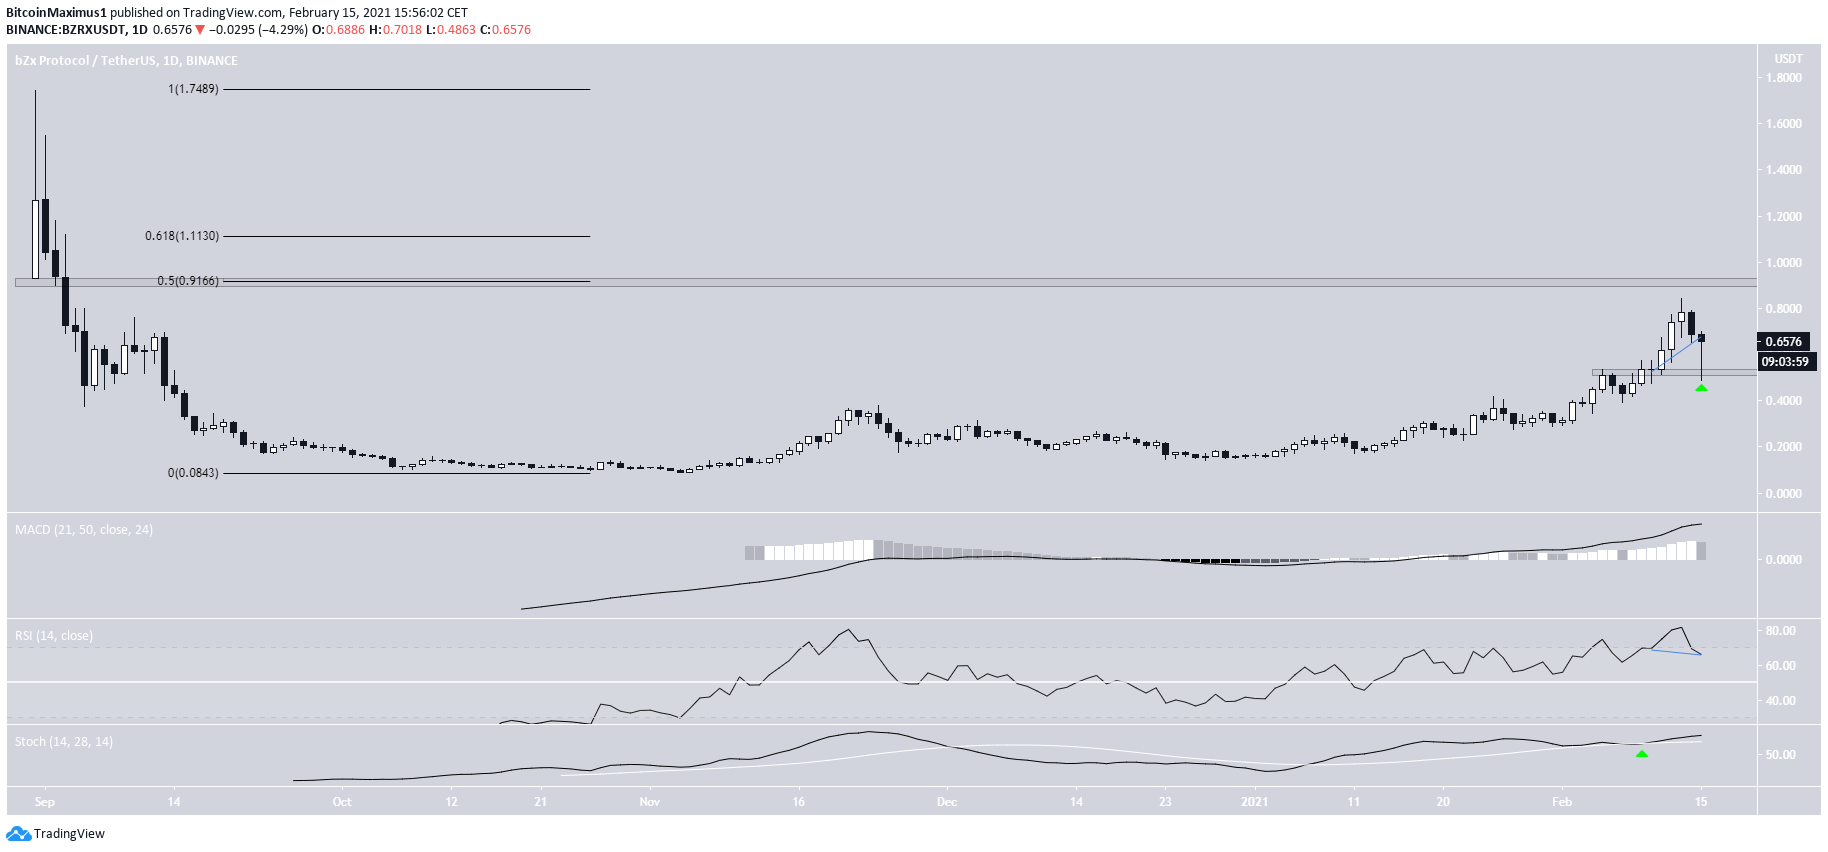
The dip was stopped short once bZx Protocol reached the $0.52 support area.
BZRX is expected to continue increasing towards the closest resistance area at $0.915 and possibly higher.
bZx Protocol Approaches Resistance
BZRX has been increasing since reaching an all-time low price of $0.088 on Nov. 5, 2020. The price action continued until a high of $0.84 was reached on Feb. 13. At this point, BZRX dropped sharply.
The dip served to validate the $0.52 area as support and created a long lower wick in the process (green arrow).
Technical indicators are bullish, supporting the continuation of the upward movement. In addition, the RSI has generated a hidden bullish divergence and the Stochastic oscillator has just made a bullish cross.
If BZRX continues increasing, the closest resistance area would be found at $0.915. The area is the 0.5 Fib retracement level and a horizontal resistance level. So, if BZRX were to clear it and the 0.618 Fib retracement at $1.11, it would likely accelerate towards the all-time high price of $1.74.

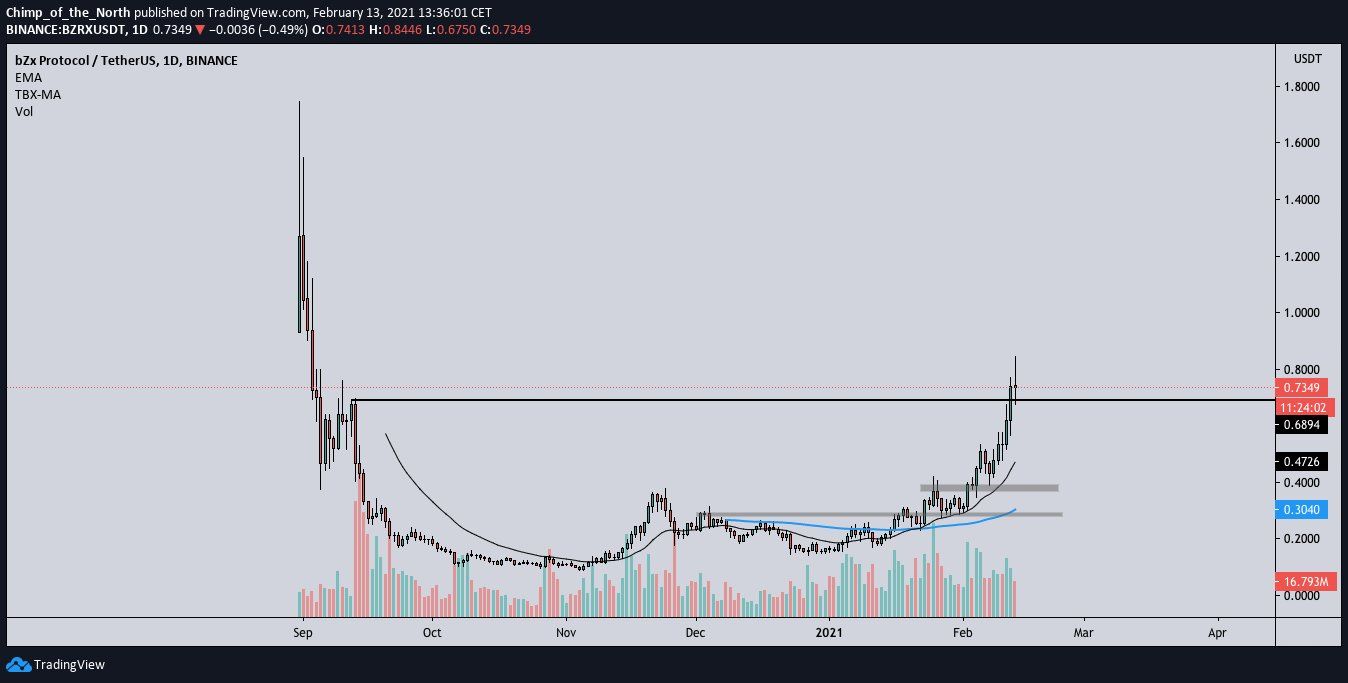
Cryptocurrency trader @CryptoChimpanz outlined a BZRX chart, stating that it looks very bullish since it has reclaimed the $0.70 resistance area.

Since the tweet, BZRX has fallen back below this resistance area. It likely needs to clear the $0.915 resistance area for the rate of increase to truly accelerate.
Wave Count
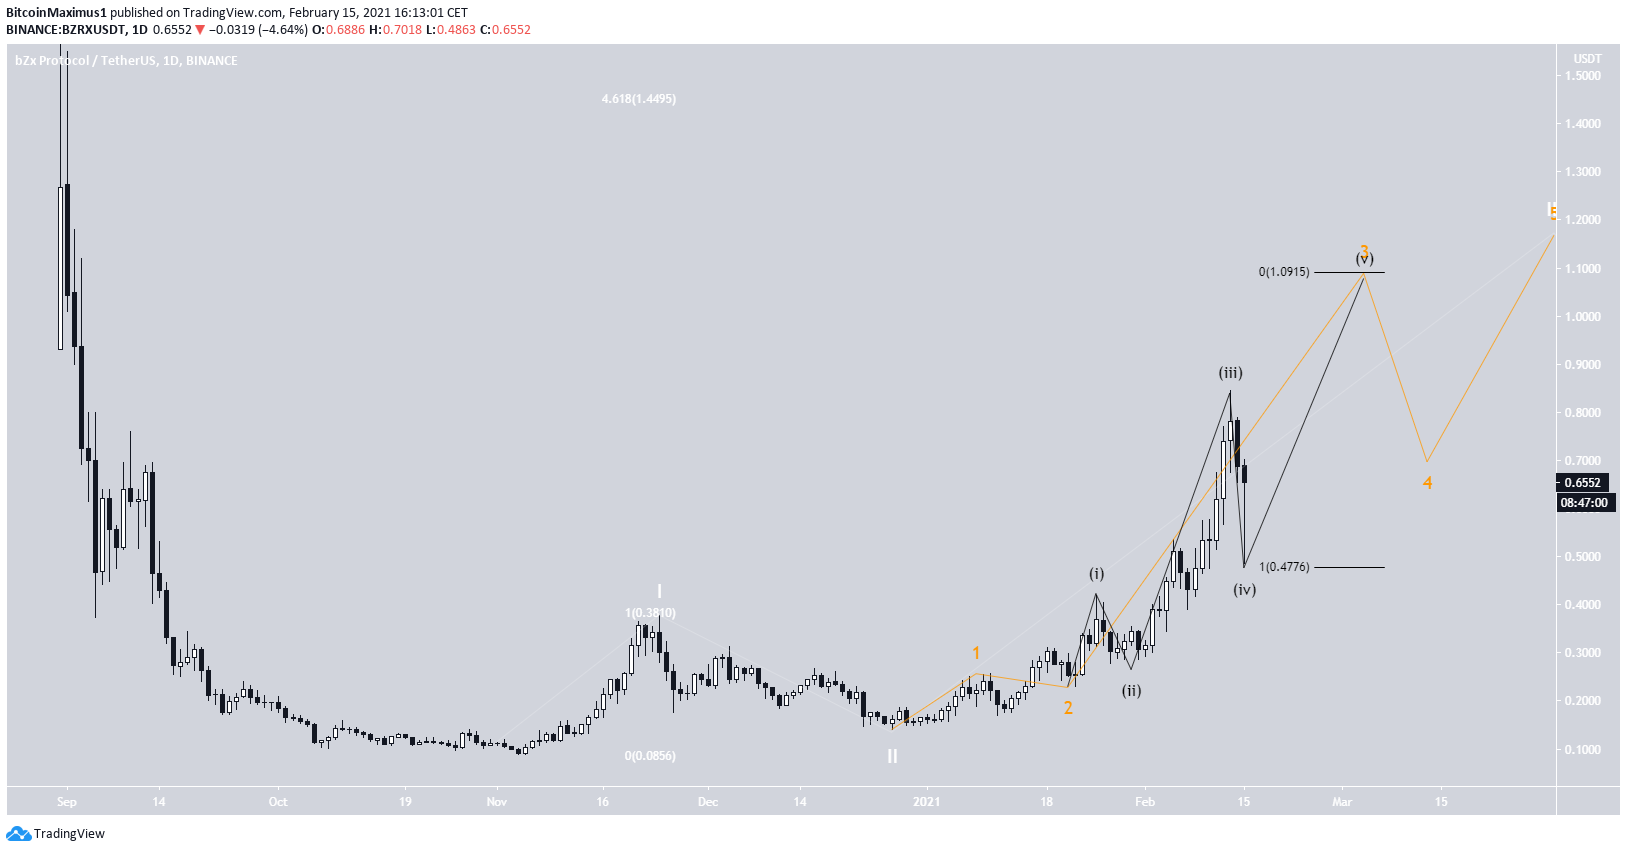
The wave count suggests that BZRX is in sub-wave five (black) of a bullish impulse (orange) that began in December 2020.
The most likely target for the top of the short-term upward move is found at $1.09. This target also coinciding with the previously outlined resistance at $1.11.
Afterward, a possible target for the top of the entire impulse is found at $1.44.

BZRX/BTC
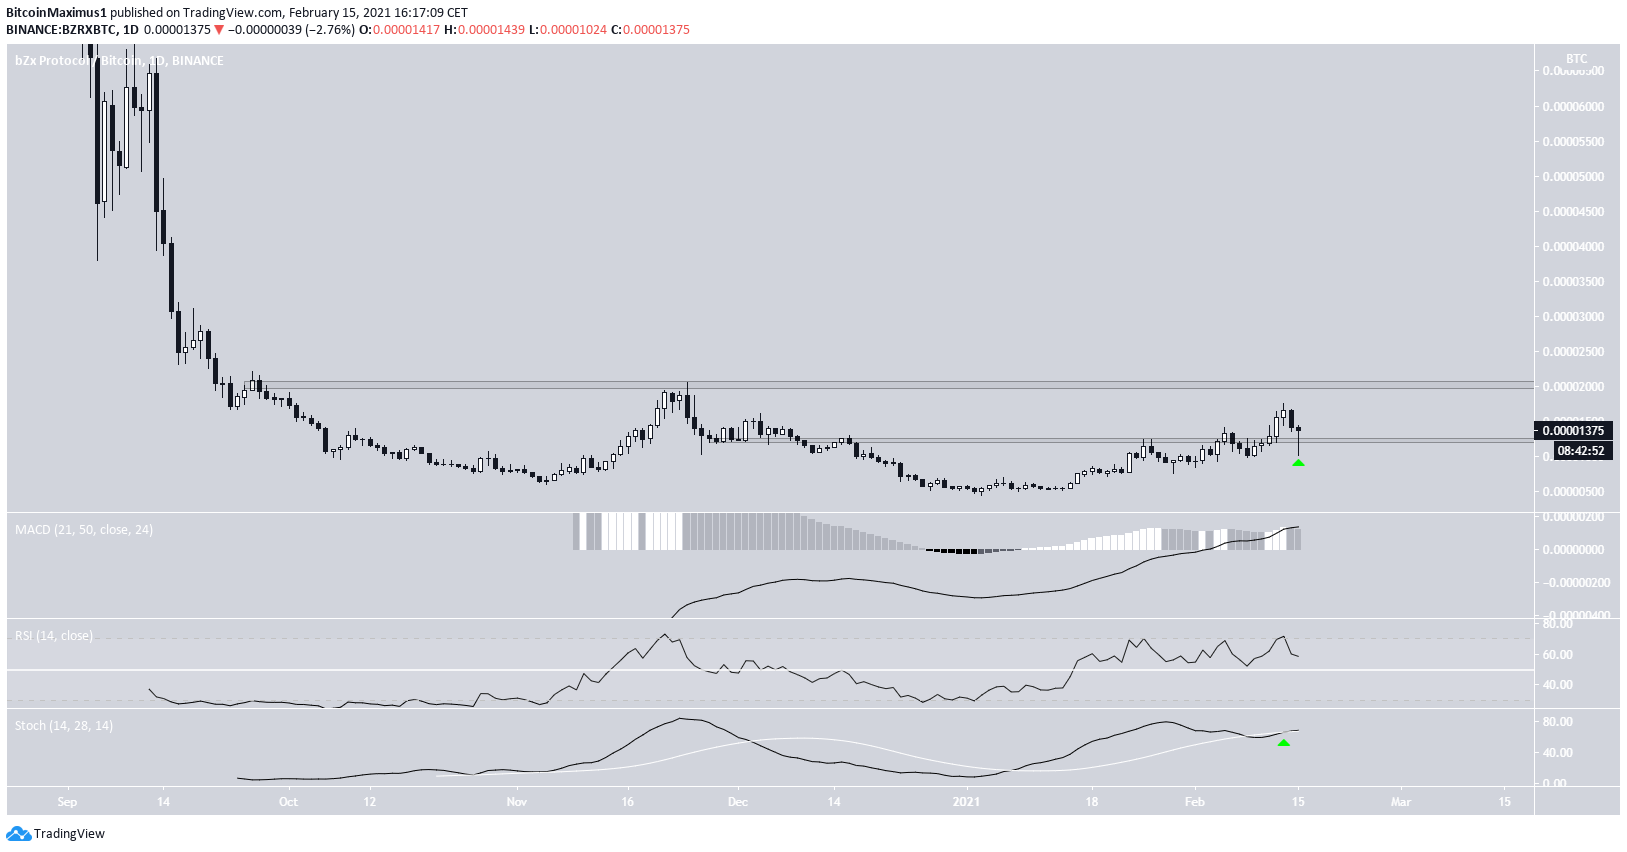
The BZRX/BTC chart shows a similar bounce at the 1,240 satoshi support area, which left a long lower wick.
The Stochastic oscillator has made a bullish cross, supporting the continuation of the upward movement.
If BZRX continues increasing, the next likely resistance area is found at 2,100 satoshis — a level that hasn’t been broken since October 2020.
If BZRX manages to clear it, it would be expected to increase at an accelerated rate.

Conclusion
The trends for BZRX/USD and BZRX/BTC appear to be bullish. Both are expected to increase towards their closest resistance areas at $0.91 and 2,100 satoshis respectively.
For BeInCrypto’s latest Bitcoin (BTC) analysis, click here
The post bZx Protocol (BZRX) Attempts to Regain Footing After Hitting Local High appeared first on BeInCrypto.


![Decentraland: Review & Beginner's Guide [current_date format=Y] 29 Decentraland: Review & Beginner's Guide](https://cryptheory.org/wp-content/uploads/2020/11/decentraland-02-gID_7-300x150.jpg)