Five Biggest Altcoin Gainer Showcase — June 14-21
2 min readTable of Contents
BeInCrypto breaks down the five biggest altcoin movers and shakers from the previous week. Will their momentum continue?
The five altcoins top altcoins of last week were:
- Amp (AMP): 26.83%
- Quant (QNT): 22.04%
- Waves (WAVES): 14.17%
- SHIBA INU (SHIB): 11.50%
- Theta Fuel (TFUEL): 8.07%
AMP
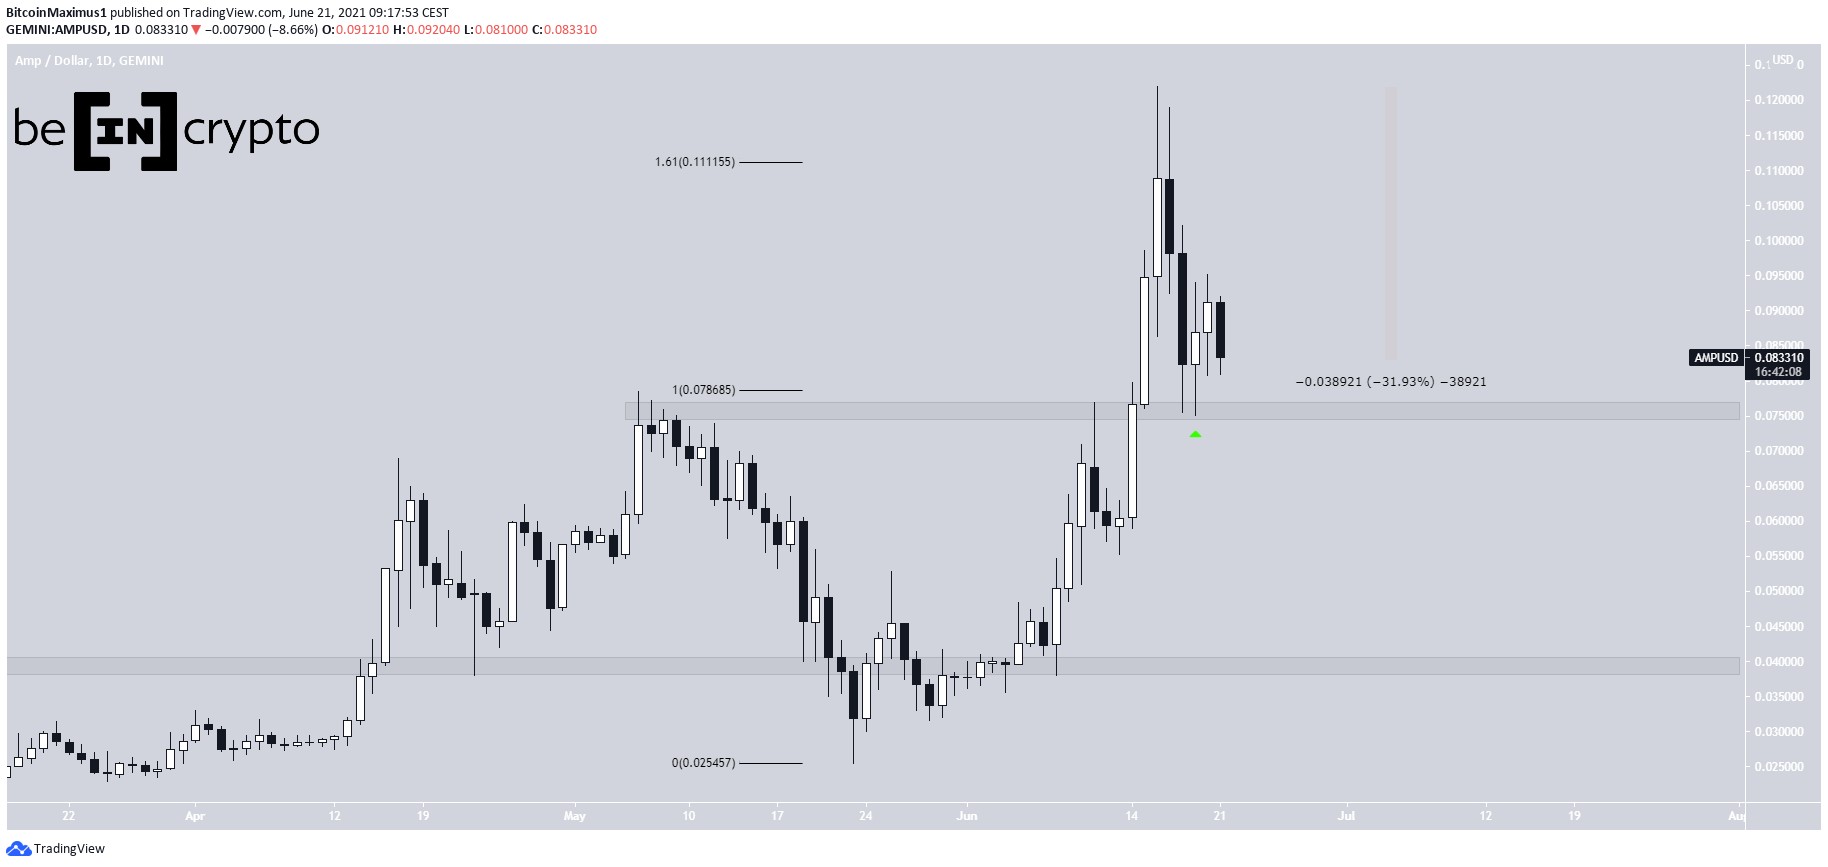
AMP has been moving upwards since May 23 when it reached a low of $0.023. After an unsuccessful attempt at moving above the $0.075 resistance area, it broke out on June 14.
On June 16, AMP reached a new all-time high of $0.121, just above the $0.11 Fib external retracement level.
The token has now returned to the $0.075 area once again., It appears to be validating the level as support. So far, it has fallen by 32% relative to the previous highs.
Nevertheless, the trend can be considered bullish as long as AMP is trading above this level.
QNT
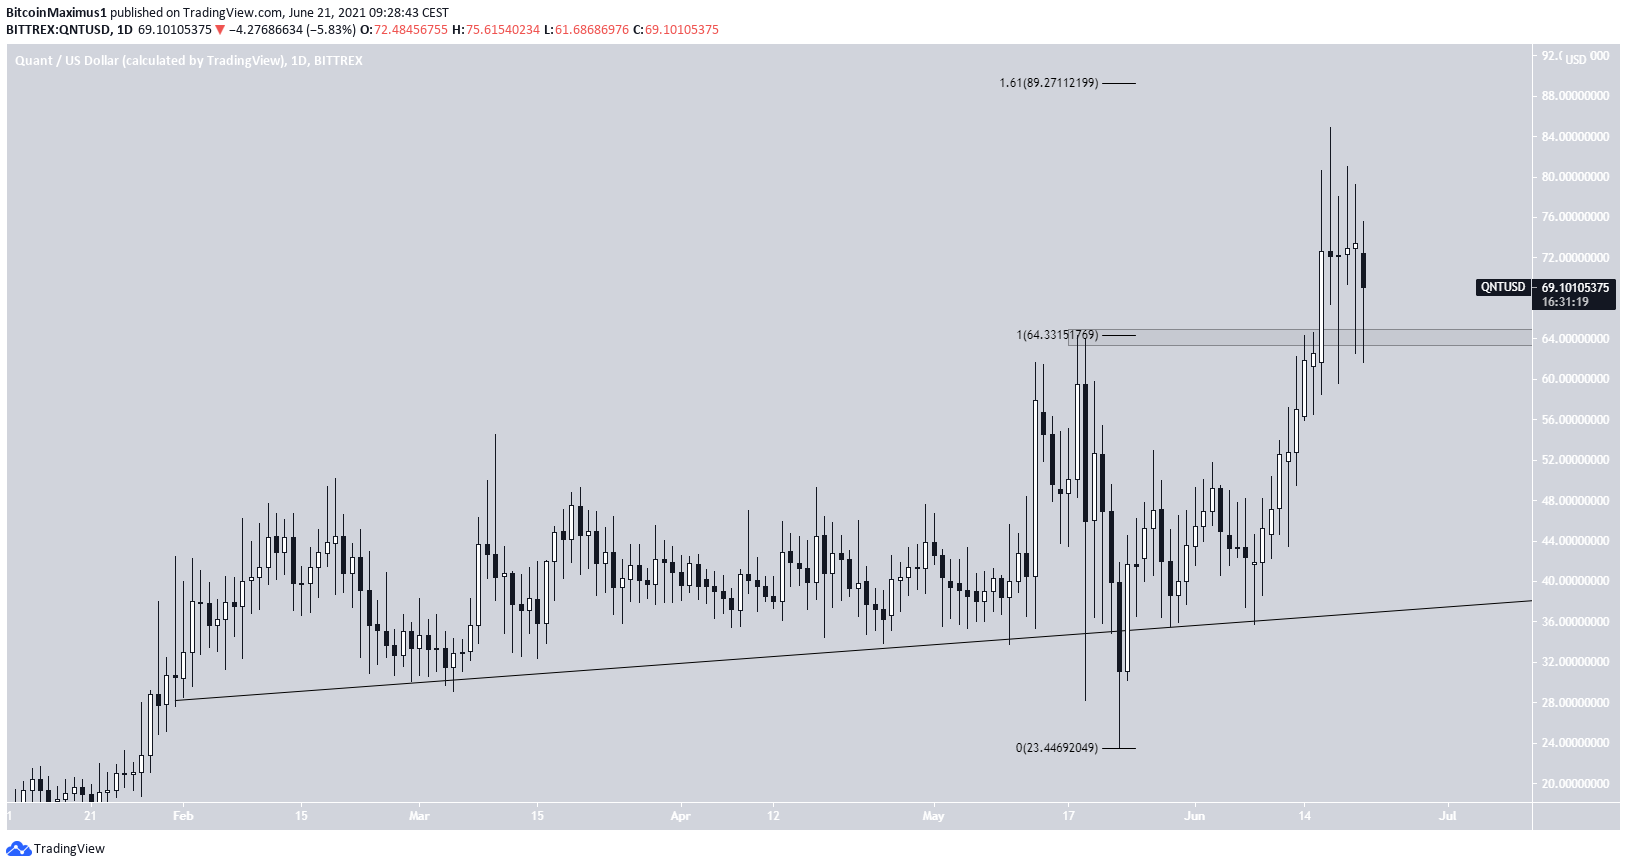
QNT has been moving upwards since May 23, when it rebounded off of a long-term ascending support line.
The upward movement continued until June 17, when QNT reached a new all-time high of $84.92. It barely failed to reach the 1.61 external Fib retracement level before falling.
QNT has been moving upwards since and has reached the previous all-time high resistance area of $64.
Similar to AMP, the trend can be considered bullish as long as the token is trading above this level.
WAVES
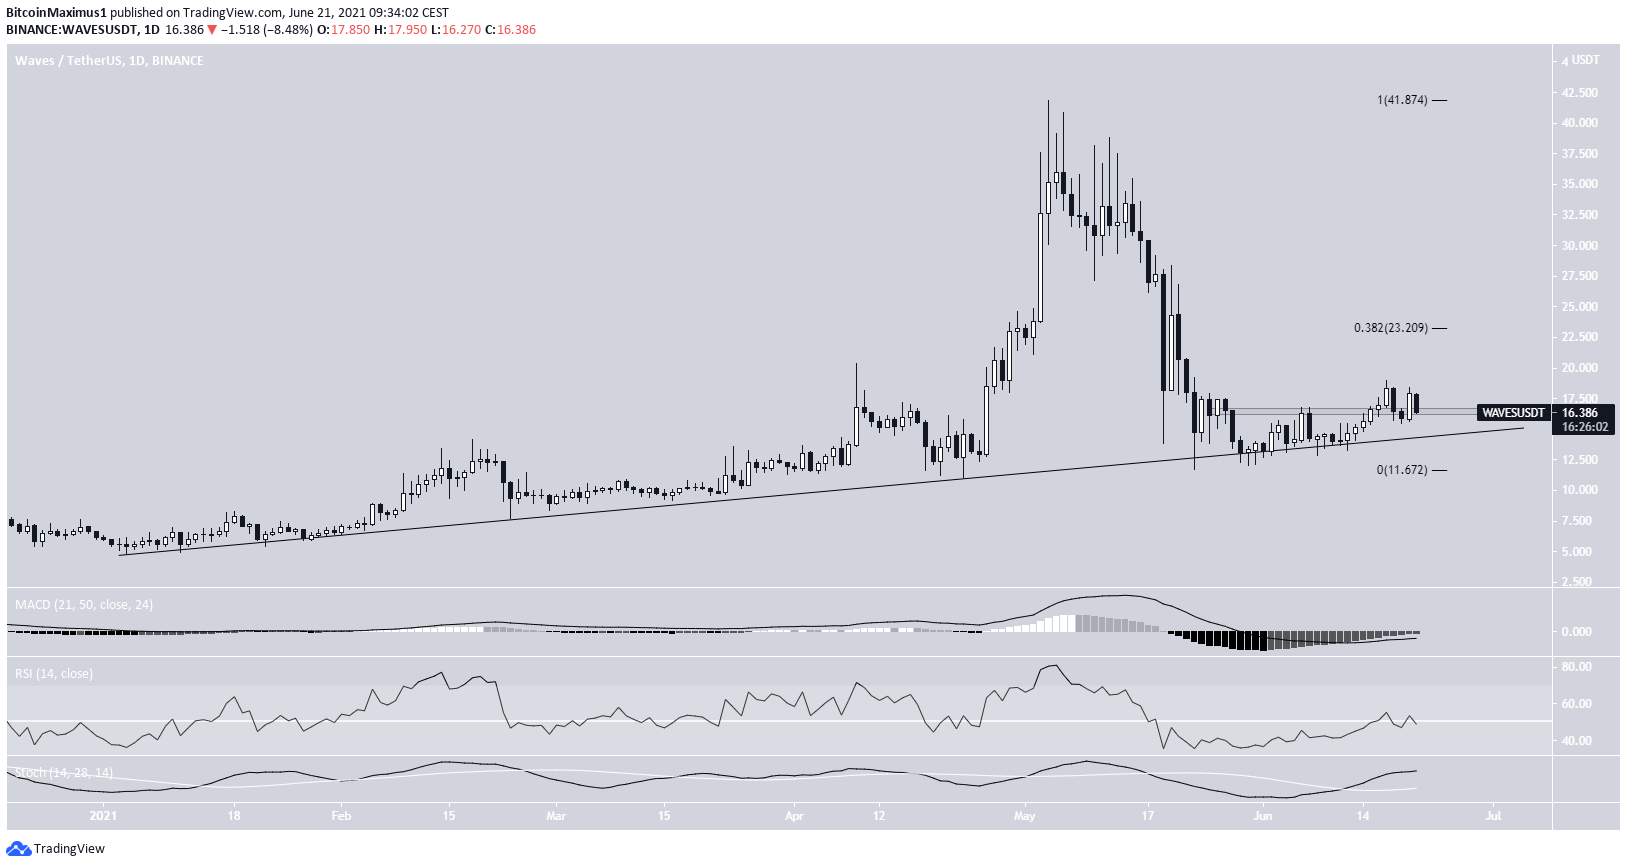
On June 12, WAVES bounced from an ascending support line that has been in place since the beginning of the year.
It proceeded to reach a high of $18.97 before falling.
Technical indicators are showing some bullish signs but not enough to confirm a bullish reversal.
Despite this, the bullish structure remains intact as long as WAVES is following this ascending support line.
The closest resistance area is at $23.20.
SHIB
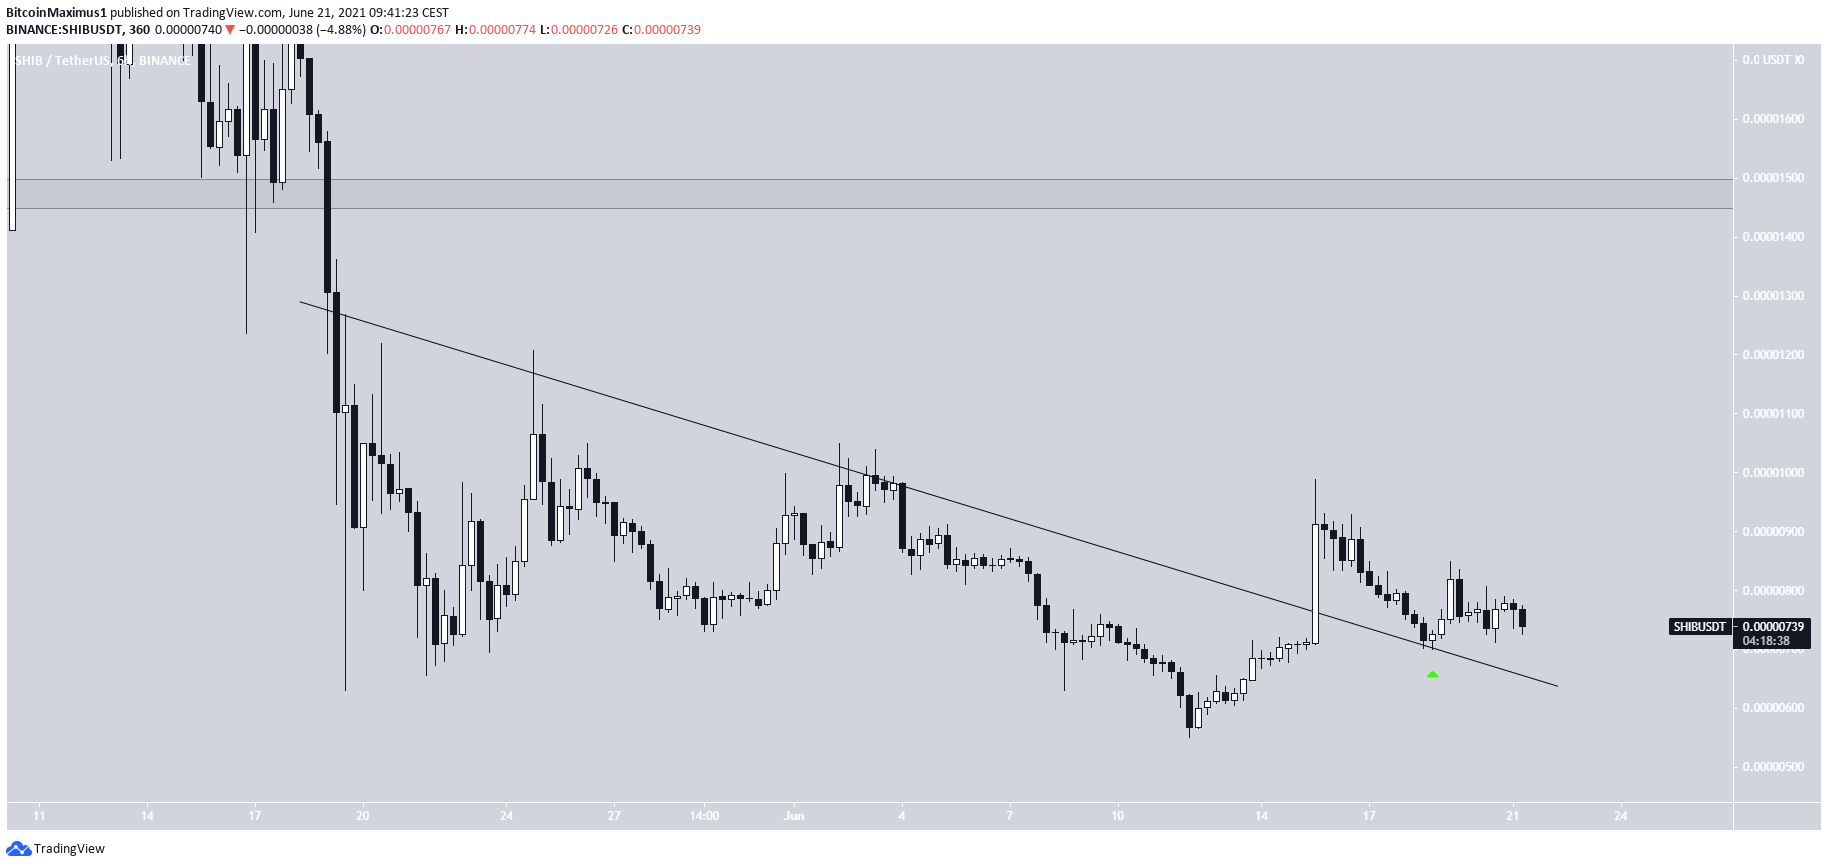
SHIB has been moving upwards since June 12, when it reached a low of $0.000055. It broke out from a descending resistance line three days later.
On June 18, it validated the line as support (green icon).
However, the bounce has been weak and there are no clear bullish reversal signs in place.
A breakdown below the line would likely take SHIB towards a new all-time low while the closest resistance is found at $0.00015.
TFUEL
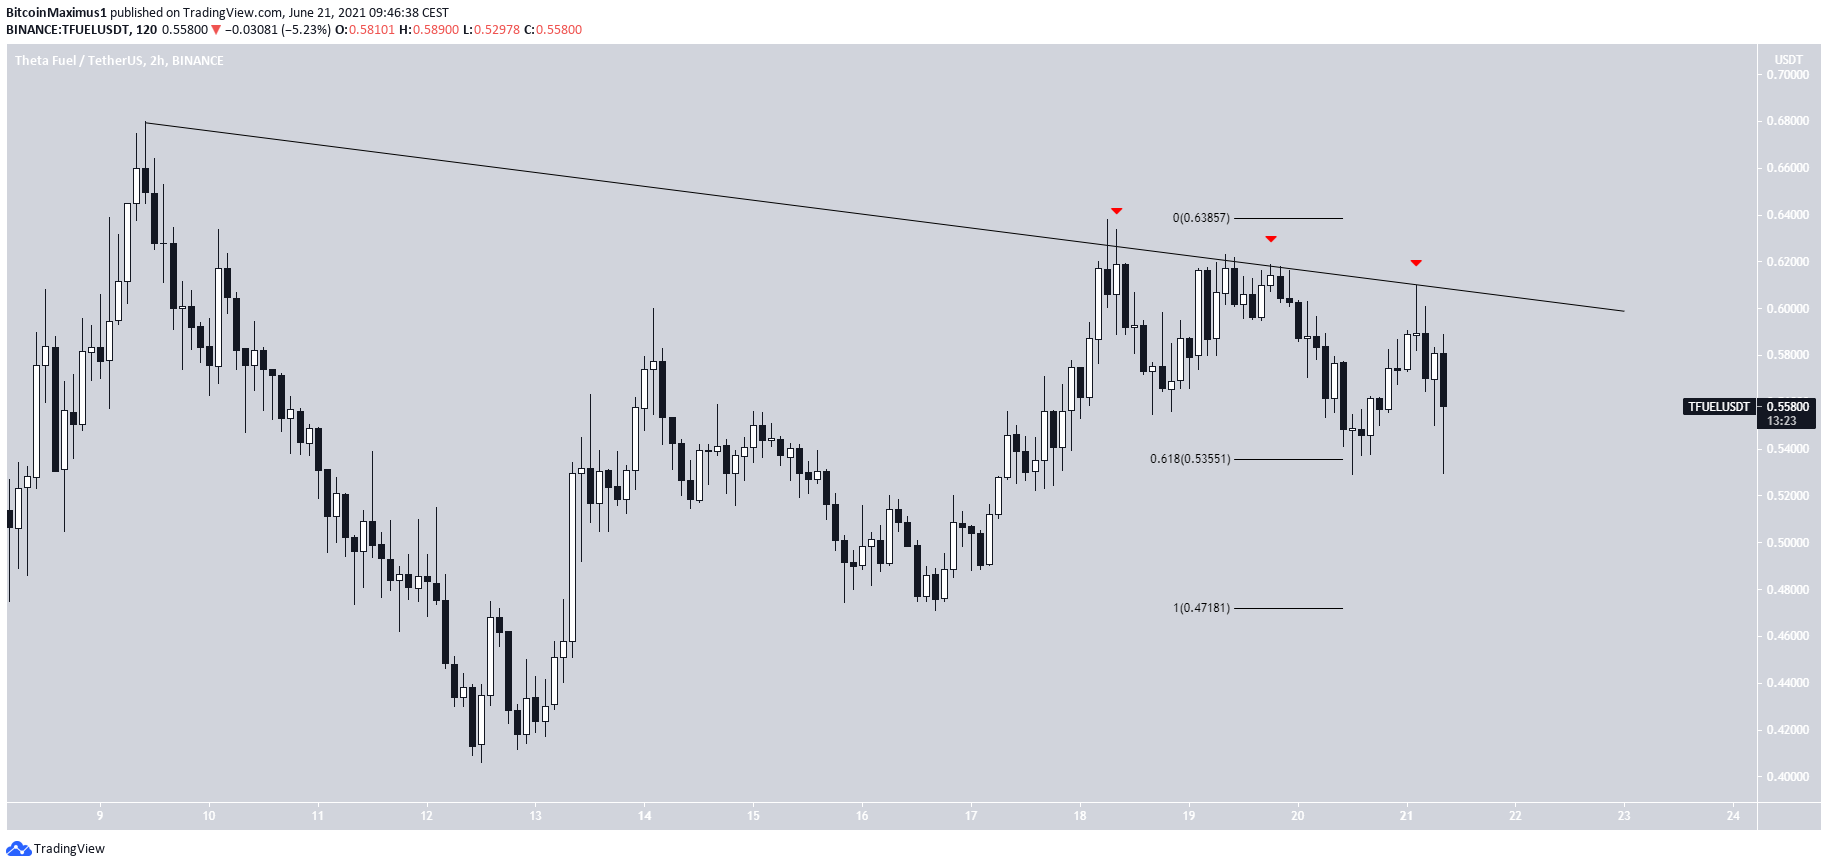
TFUEL has been moving downwards since reaching a new all-time high price of $0.679 on June 9. Throughout the decrease, it has been following a descending resistance line.
The token has been rejected by this line multiple times, most recently on June 21.
The closest support level is found at $0.53. This is the 0.618 Fib retracement support level when measuring the most recent portion of the upward movement.
If TFUEL breaks down, the next support level would be found at $0.47.
For BeInCrypto’s latest BTC (BTC) analysis, click here.
The post Five Biggest Altcoin Gainer Showcase — June 14-21 appeared first on BeInCrypto.


![Decentraland: Review & Beginner's Guide [current_date format=Y] 32 Decentraland: Review & Beginner's Guide](https://cryptheory.org/wp-content/uploads/2020/11/decentraland-02-gID_7-300x150.jpg)