KAVA, BAT, AVAX Recover, With Strong Bounces
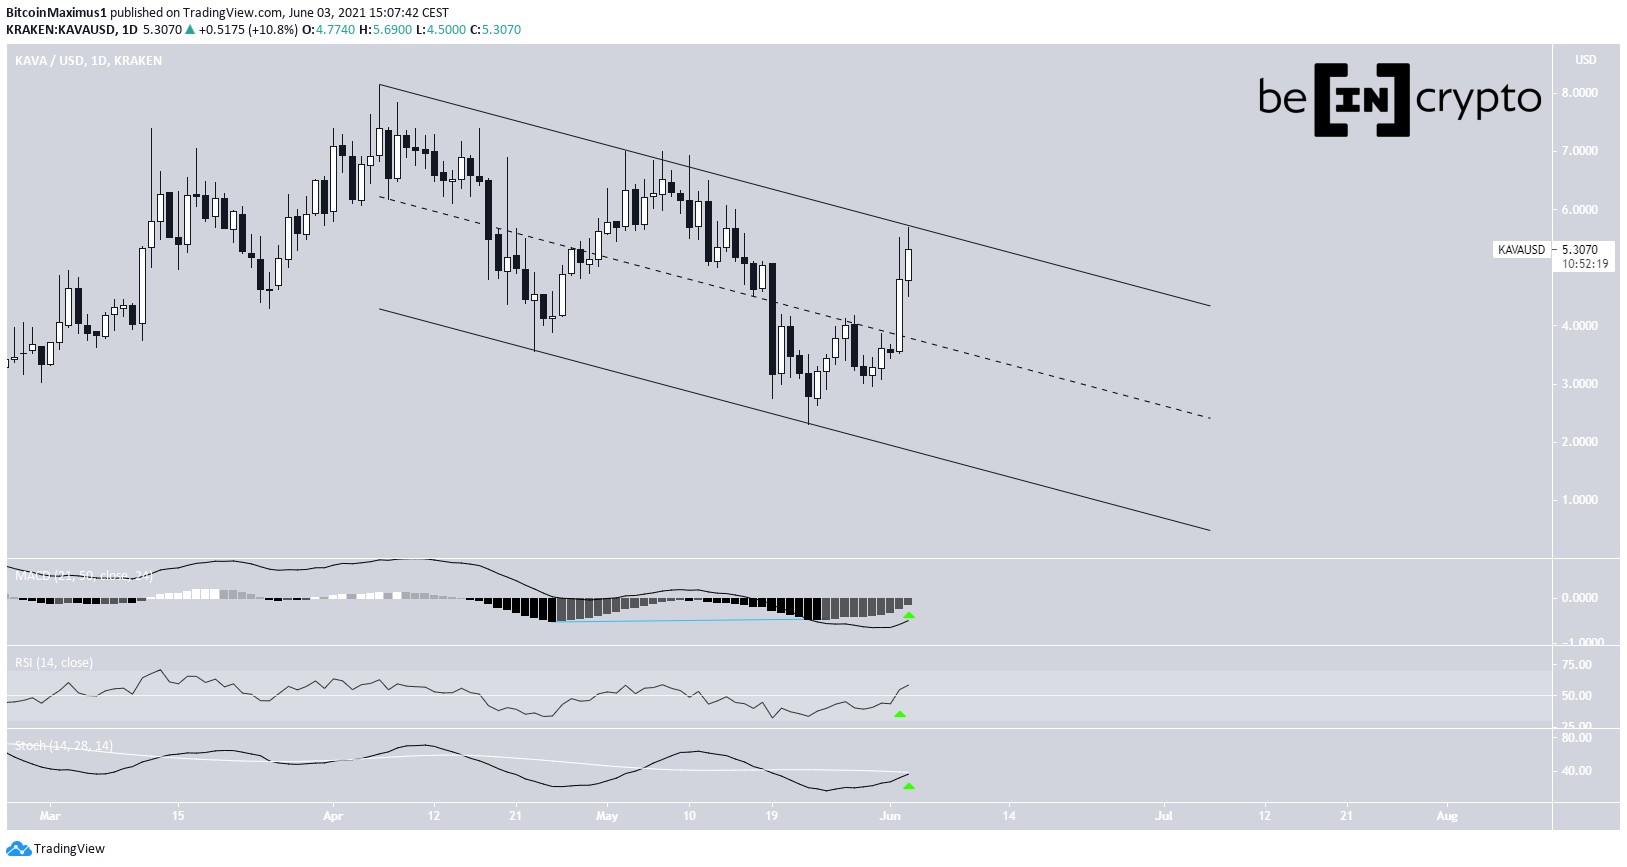
3 min readKava.io (KAVA) has been increasing since bouncing at the support line of a descending parallel channel on May 23.
After initially deviating below it, Basic Attention Token (BAT) has reclaimed the $0.65 support area.
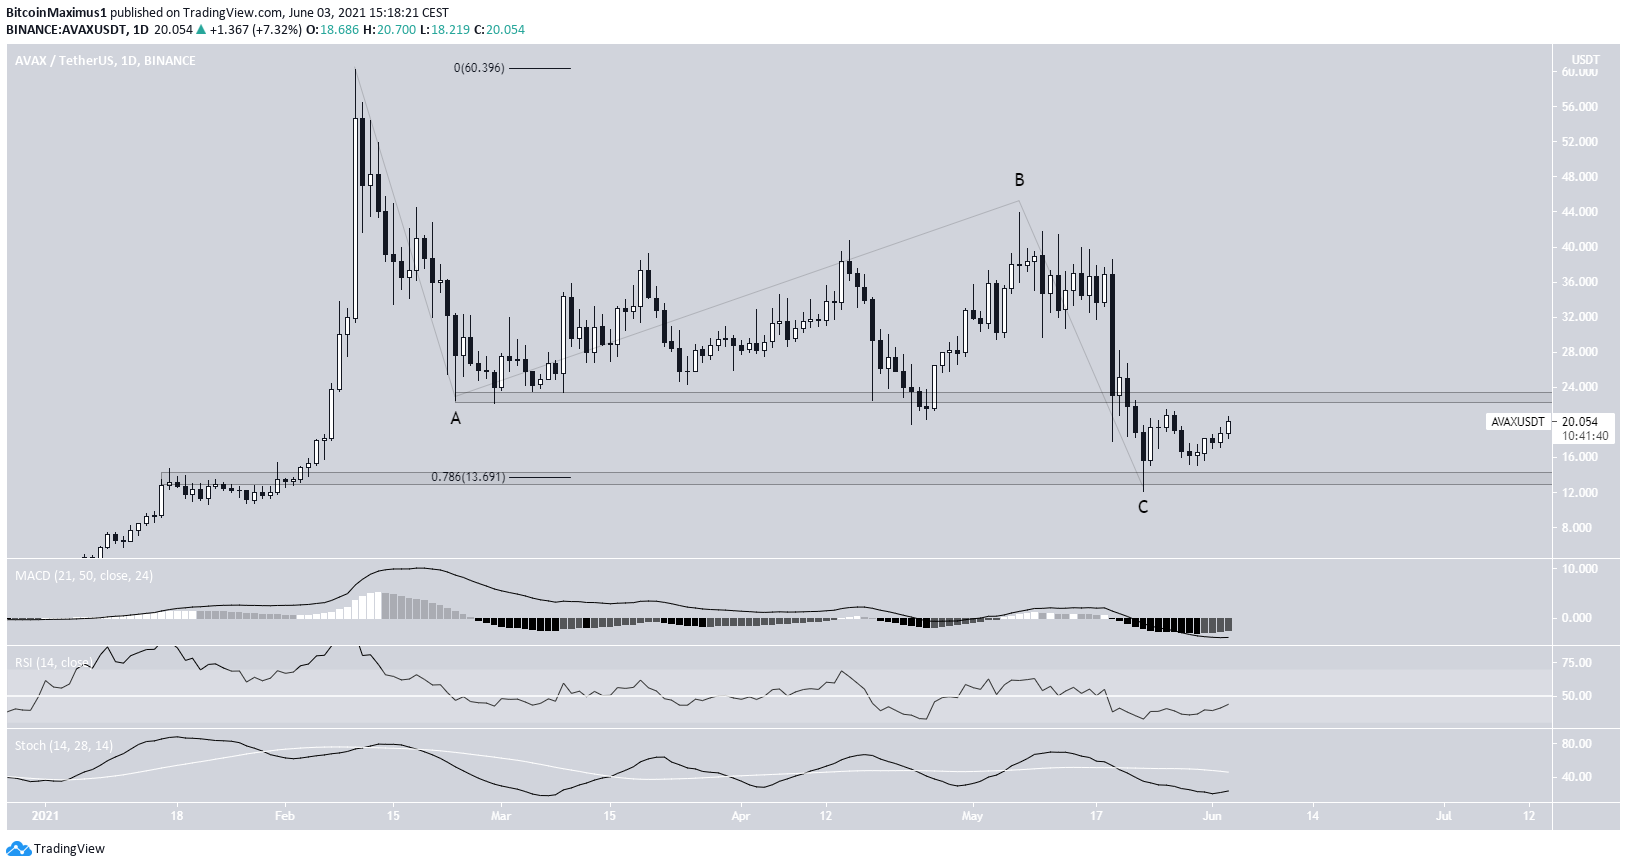
Avalanche (AVAX) has potentially completed its correction with a bounce at the $13.70 support area.
KAVA
Since April 6, KAVA has been trading inside a descending parallel channel. At the time, it had reached an all-time high price of $8.13. Until now, it has made two breakout attempts, both unsuccessful.
However, it has been increasing at an accelerated rate since bouncing at the support line of the channel on May 23. In turn, it is now making another breakout attempt.
The bounce was preceded by significant bullish divergence in the MACD histogram. Furthermore, the RSI has crossed above 50 and the Stochastic oscillator has made a bullish cross (green icons).
Therefore, a breakout from the channel is expected.
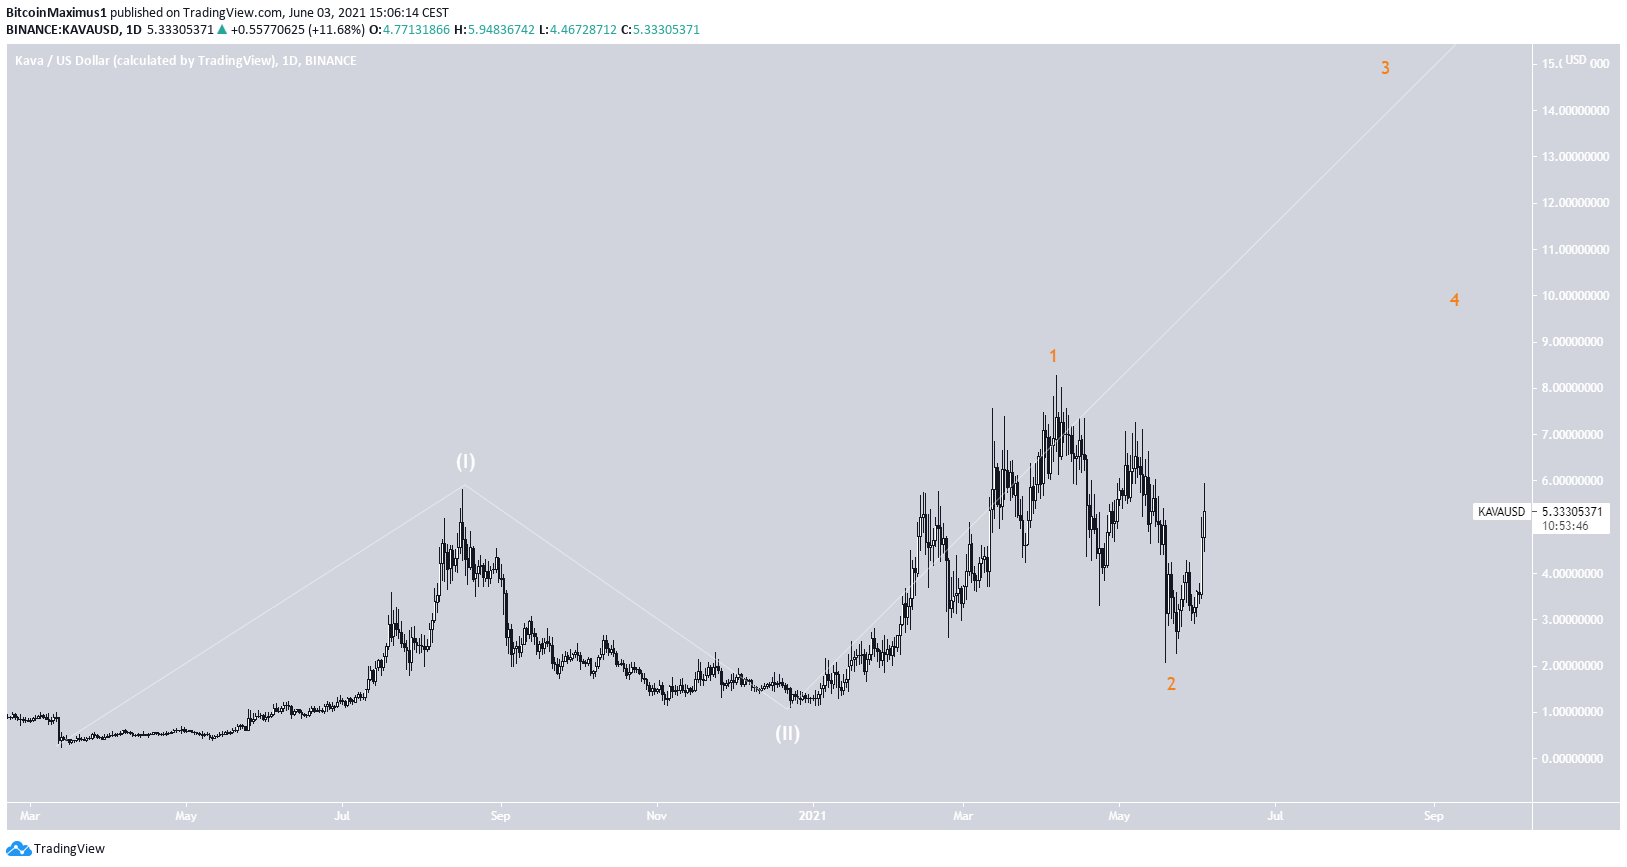
The wave count indicates that KAVA could be trading inside an immense 1-2/1-2 wave formation. If correct, the move would eventually take it well into double digits.
A decrease above the May 23 low of $2.30 would invalidate this possibility.
Highlights
- KAVA is trading inside a descending parallel channel.
- It has potentially completed a 1-2/1-2 wave formation.
BAT
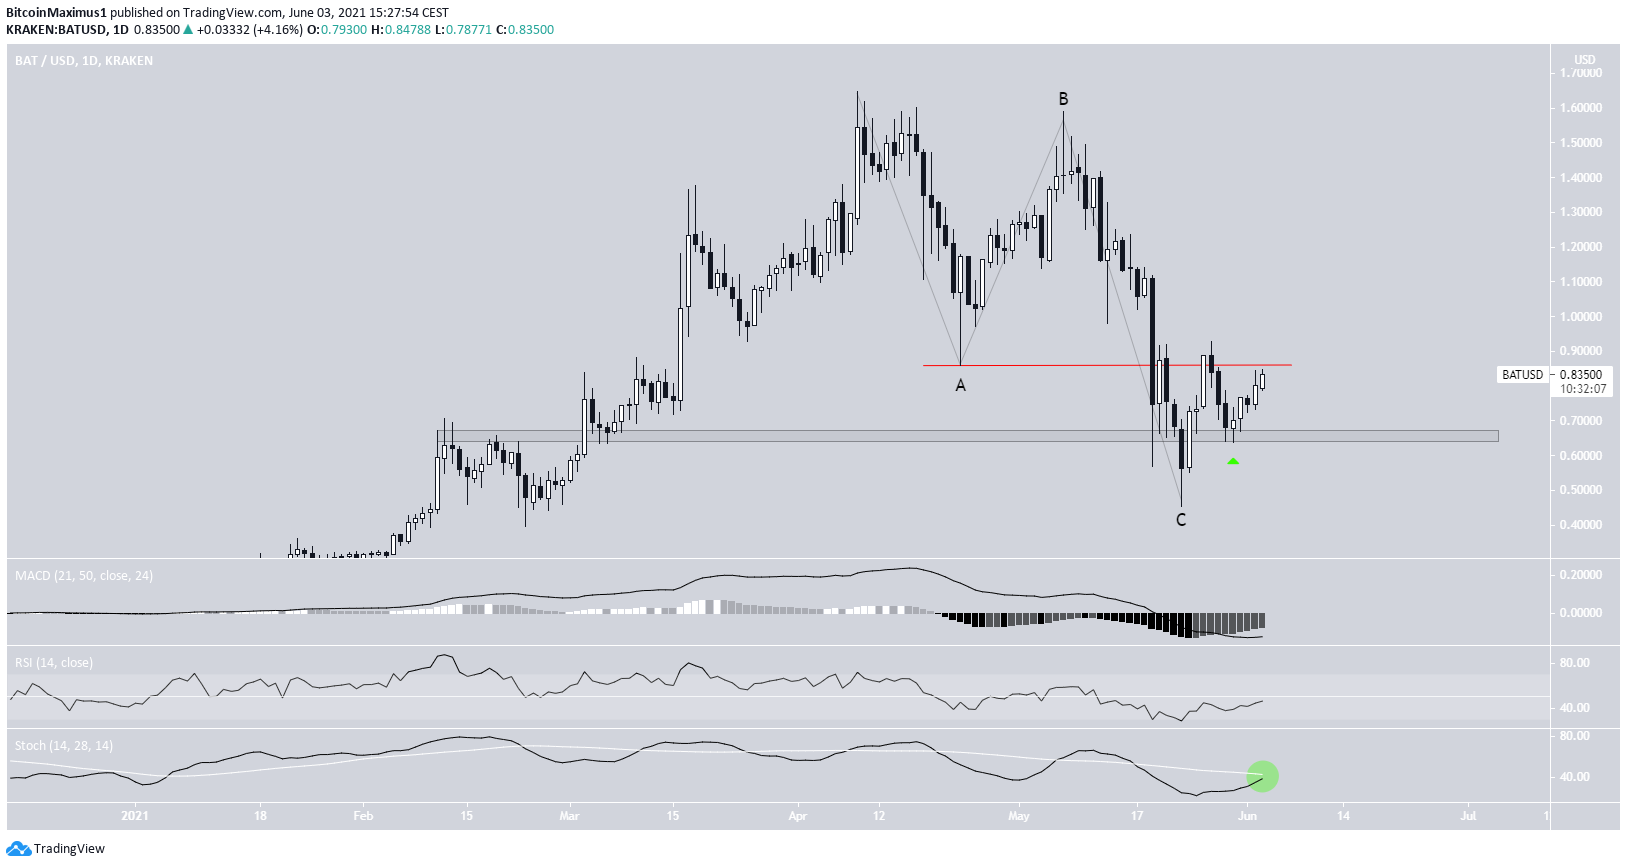
BAT has been decreasing since April 9, when it reached a high of $1.64. The decrease continued until May 24, when a low of $0.454 was reached.
While the low initially caused a breakdown below the long-term $0.65 support level, the area was reclaimed shortly afterwards and validated as support (green icon).
Technical indicators are providing some bullish signs, such as the impending bullish cross in the Stochastic oscillator (green circle). However, they have yet to confirm the bullish trend reversal.
Nevertheless, the increase above the April 23 low of $0.85 (red line) confirms that this is not a bearish impulse, rather it is a corrective structure.
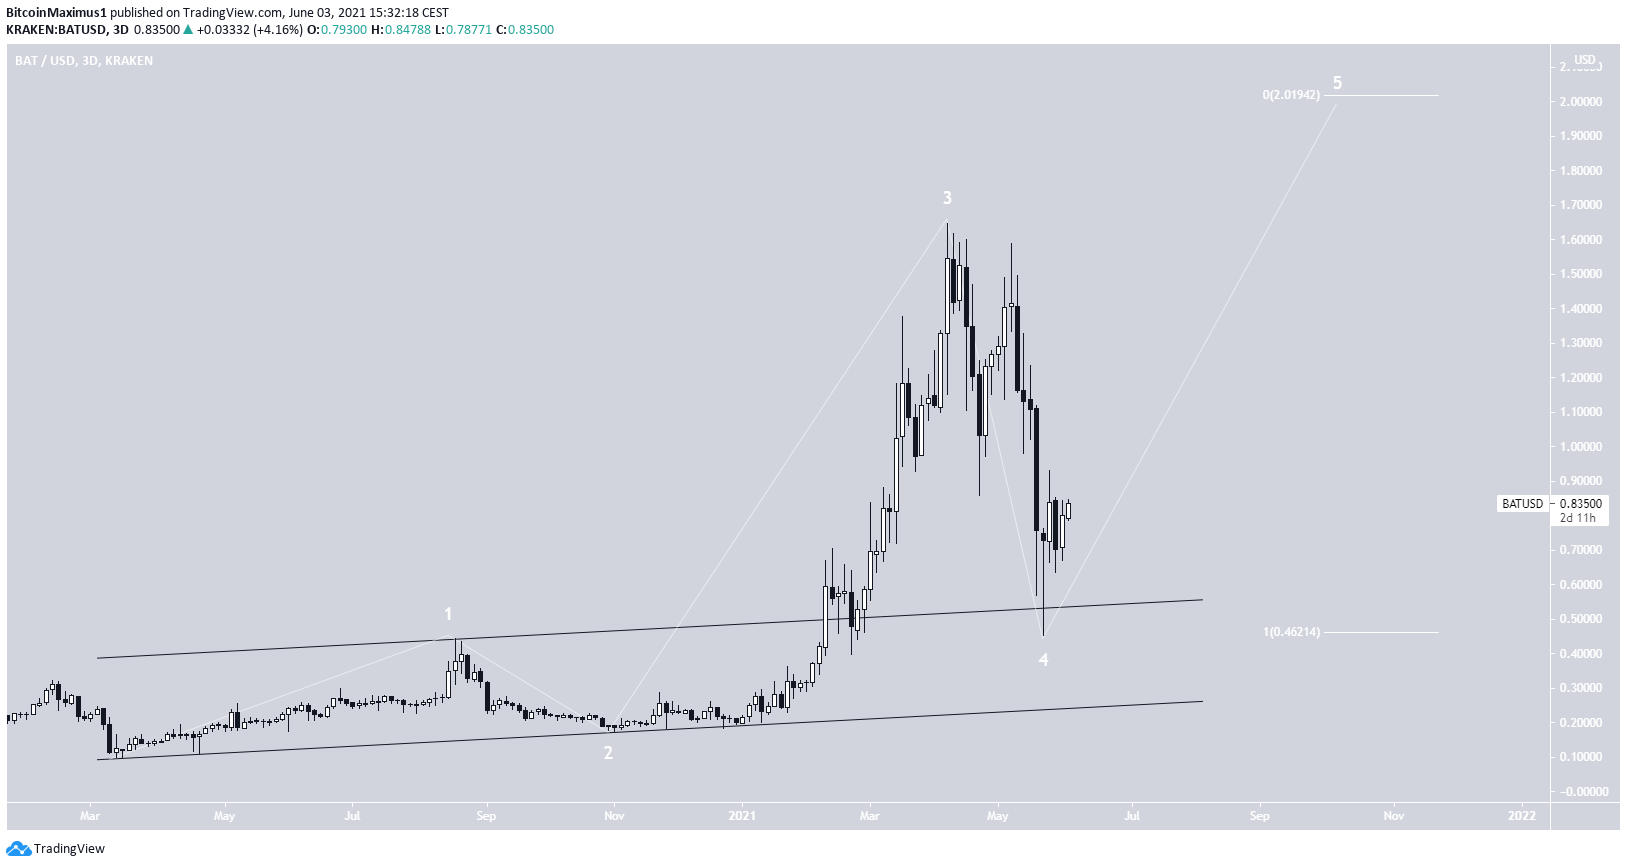
The wave count suggests that the decrease was a fourth wave pullback. The bullish impulse is still valid since the May 23 low barely missed the wave one high at $0.44.
A potential target for the top of the entire movement is at $2. It is found by projecting the length of waves 1-3.
Highlights
- BAT has reclaimed the $0.65 support area.
- It might have begun wave five of a bullish impulse.
AVAX
AVAX has been moving downwards since Feb. 10, when it reached an all-time high price of $60.3.
After bouncing on Feb. 16, AVAX created a lower high on May 7, before moving downwards once more. This led to a low of $12.08 on May 23. The token has been moving upwards since.
The low served to validate the $13.70 area as support. The area previously acted as resistance and is the 0.786 Fib retracement support level.
Furthermore, the decrease from the aforementioned all-time high looks like a completed A-B-C corrective structure. Despite this, technical indicators are still bearish. This is especially evident by the negative MACD and the fact that the RSI is below 50.
A reclaim of the $23 resistance area would confirm that the correction is complete.
Highlights
- AVAX has bounced at the $13.70 support area.
- It has potentially completed an A-B-C corrective structure.
For BeInCrypto’s latest BTC (BTC) analysis, click here.
The post KAVA, BAT, AVAX Recover, With Strong Bounces appeared first on BeInCrypto.


![Decentraland: Review & Beginner's Guide [current_date format=Y] 32 Decentraland: Review & Beginner's Guide](https://cryptheory.org/wp-content/uploads/2020/11/decentraland-02-gID_7-300x150.jpg)