On-Chain Analysis: NUPL Analysis of BTC & ETH
2 min readIn this article, BeInCrypto will take a look at on-chain indicators for BTC (BTC) and ETH (ETH).
Net Unrealized Profit/Loss (NUPL) will be analyzed and compared to the previous bullish cycles, in order to determine if the long-term trend is still bullish.
BTC
NUPL is used to calculate profits or losses resulting from the circulating supply of a token. This is done by measuring the difference between realized profits and realized losses.
Negative values suggest that realized losses are higher, while the opposite is true for positive values.
Historically, values above 0.75 has been a sign of euphoria (blue), predicting market tops relatively accurately. Conversely, values below 0.25 (red) have been a sign of capitulation and have transpired close to bottoms.
The highest ever NUPL value for BTC has been 0.878, reached in 2011. The 2021 high had a value of 0.738.
If this was the top, it would mark the only time in recorded history that NUPL did not cross above 0.75 at least once before the beginning of the bear market.
NUPL has now fallen below 50, as evidenced by the yellow line.
Historically, switches from the green to yellow lines have marked the beginning of bear markets. The only exception has been July 2013 (black circle), when BTC reversed after two months and proceeded to reach a new all-time high price.
However, in both the 2013 and 2017 bull runs, NUPL had been above 0.50 for roughly one year before a bear market began.
Since it moved above 50 in Oct. 2020, it has been above 50 for only six months. Going by previous history, the bull market would be expected to end some time in Oct. 2021.

ETH
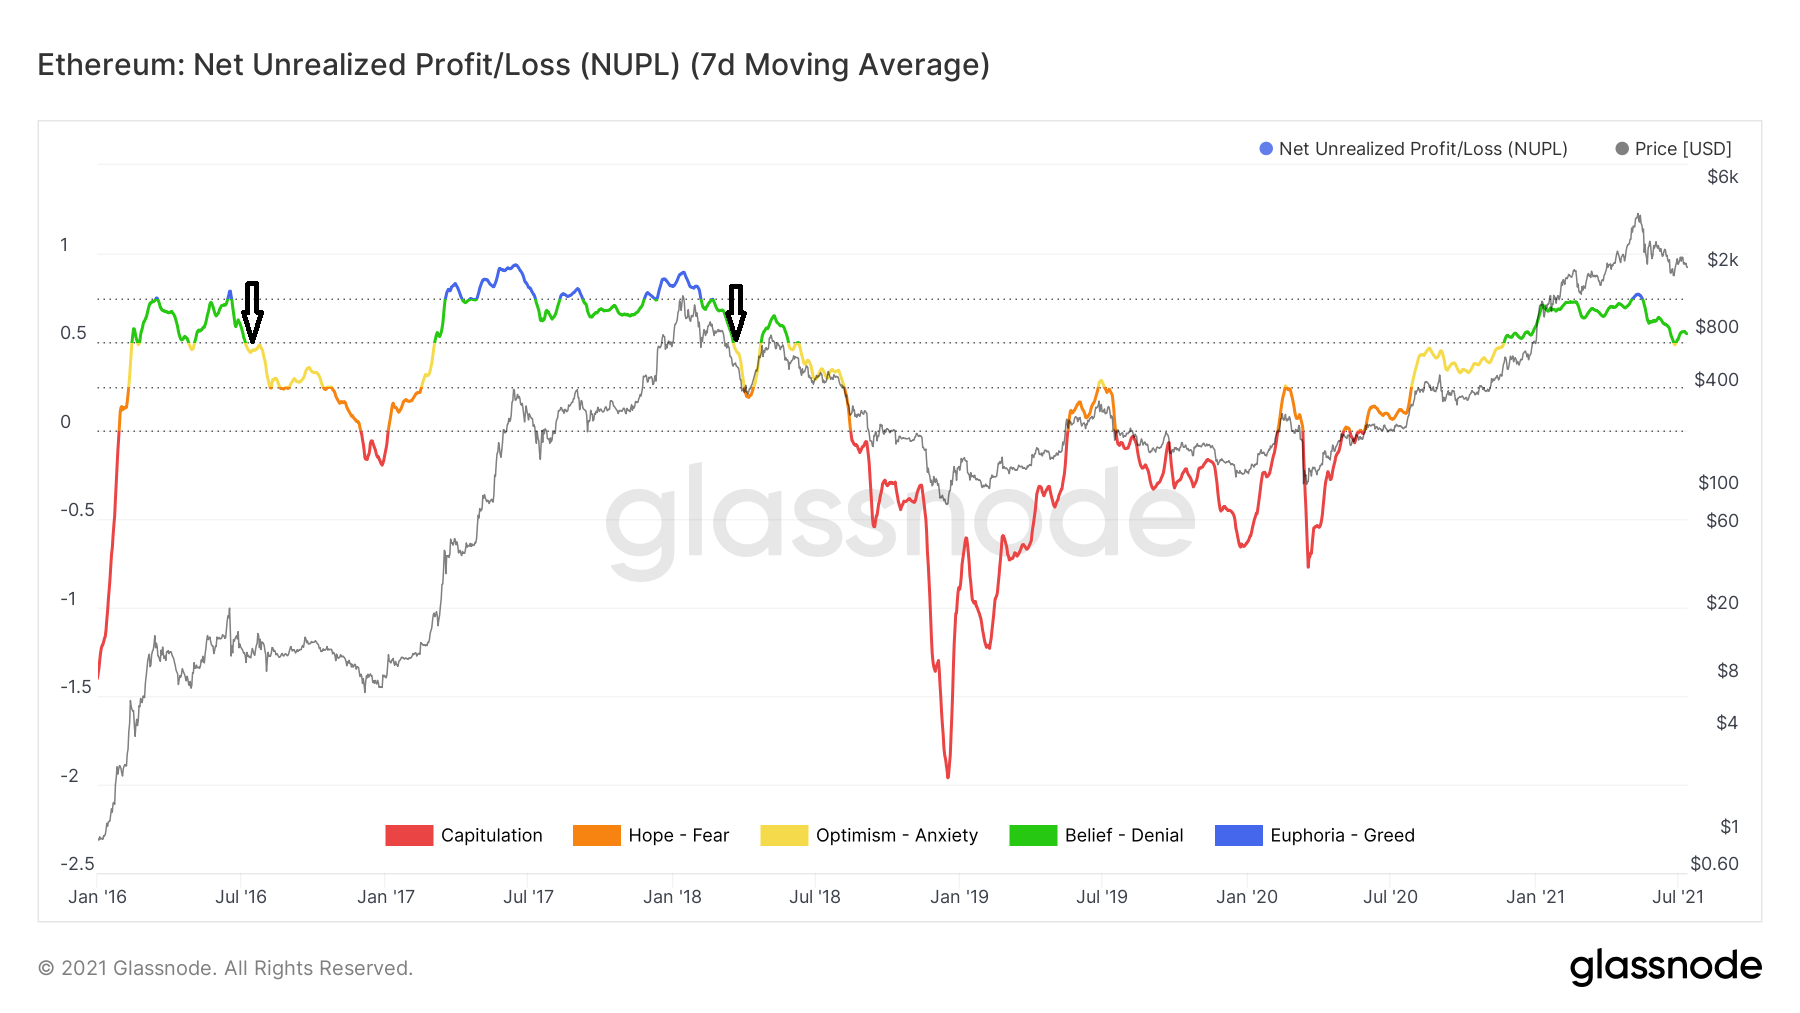
The highest ever NUPL value reached for ETH has been 0.934. It was reached in Jan. 2017.
Unlike BTC, ETH reached a value above 0.75 in the current bull run, doing so on May 2021. However, it has yet to fall below 0.5.
In the 2016 and 2017 bull runs, a switch from blue to green and then yellow (black arrow) has marked the beginning of the bear market both times.
Therefore, a NUPL switch to yellow (<0.5) could indicate that the current bull run has ended.

For BeInCrypto’s latest BTC (BTC) analysis, click here.
The post On-Chain Analysis: NUPL Analysis of BTC & ETH appeared first on BeInCrypto.


![Decentraland: Review & Beginner's Guide [current_date format=Y] 23 Decentraland: Review & Beginner's Guide](https://cryptheory.org/wp-content/uploads/2020/11/decentraland-02-gID_7-300x150.jpg)