THETA Zones In on Setting a New All-Time High
3 min readTable of Contents
Theta Token (THETA) has briefly reached two new all-time highs since Sept. 30, before pulling back.
Technical indicators and the price movement suggest that THETA will be successful in breaking out yet again to reach a new all-time high.
THETA All-Time High Region
The THETA price reached a new all-time high of $0.807 on Sept. 30. After a considerable decrease, the price began another upward move and reached a new all-time high of $0.811 on Dec. 9. However, another slight drop followed leaving a long upper wick in place.
Technical indicators are mixed, leaning on bullish. The RSI has possibly generated a bearish divergence, but it is still unconfirmed. While the MACD has lost strength, it is still moving upwards as is the Stochastic oscillator.
A look at lower time-frames is required in order to determine where the price will likely head to next. If THETA were to decrease, the closest support area would be found at $0.58.
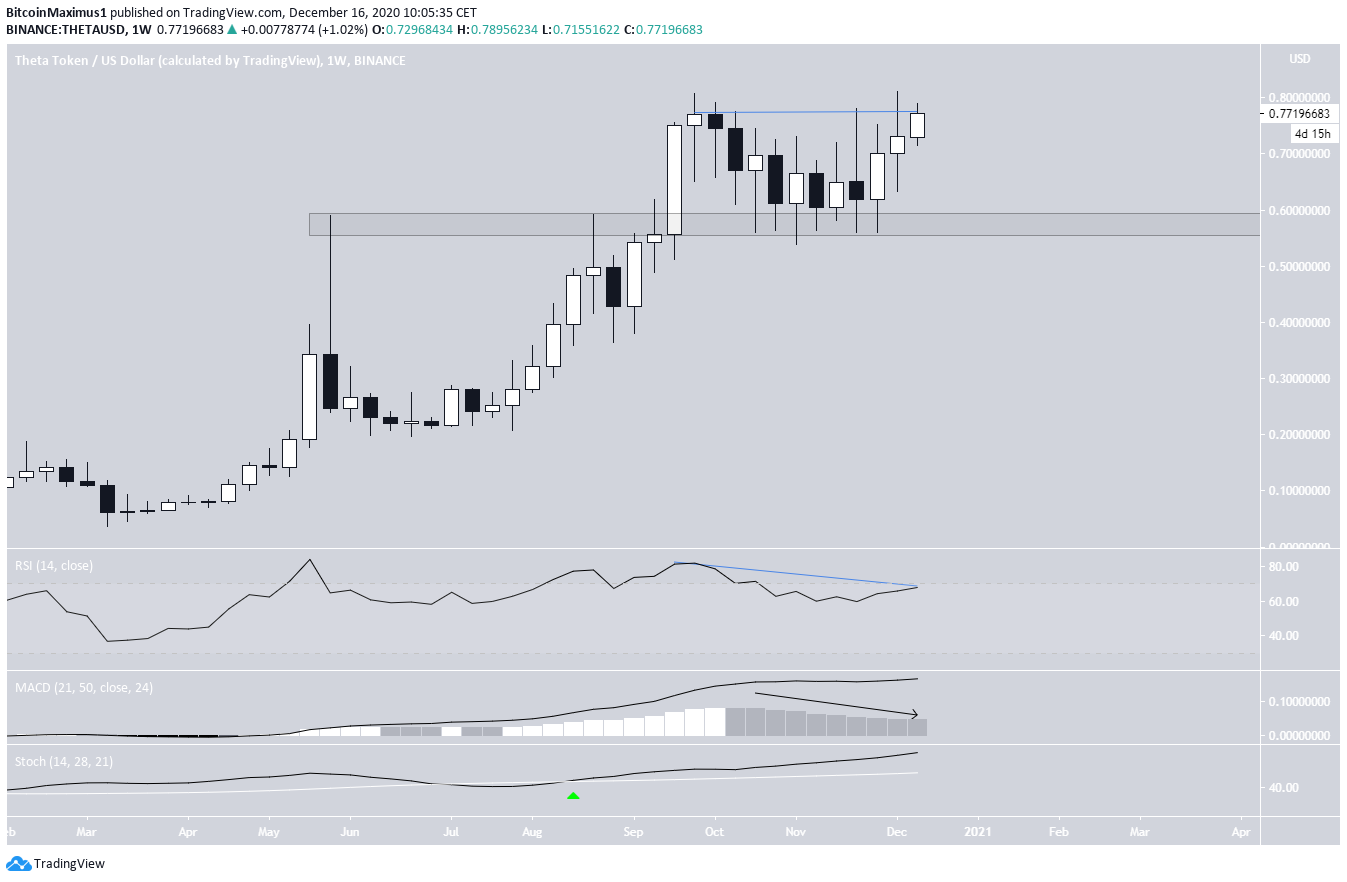
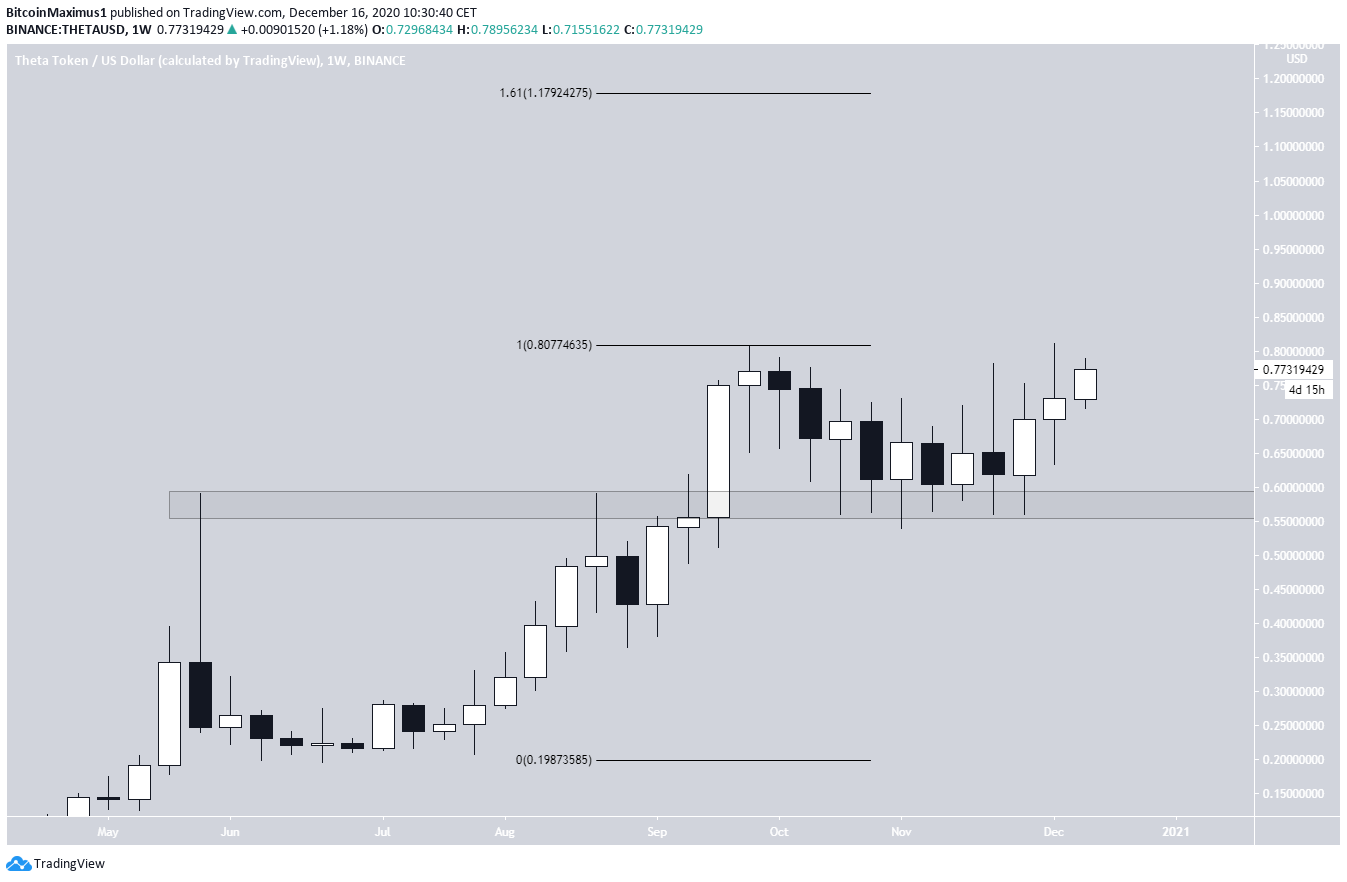
Since a breakout would take THETA into price discovery mode, the use of Fib extensions is required in order to determine the next likely high.
The 1.61 Fib extension of the most recent upward move puts this resistance at $1.18.
Future Movement
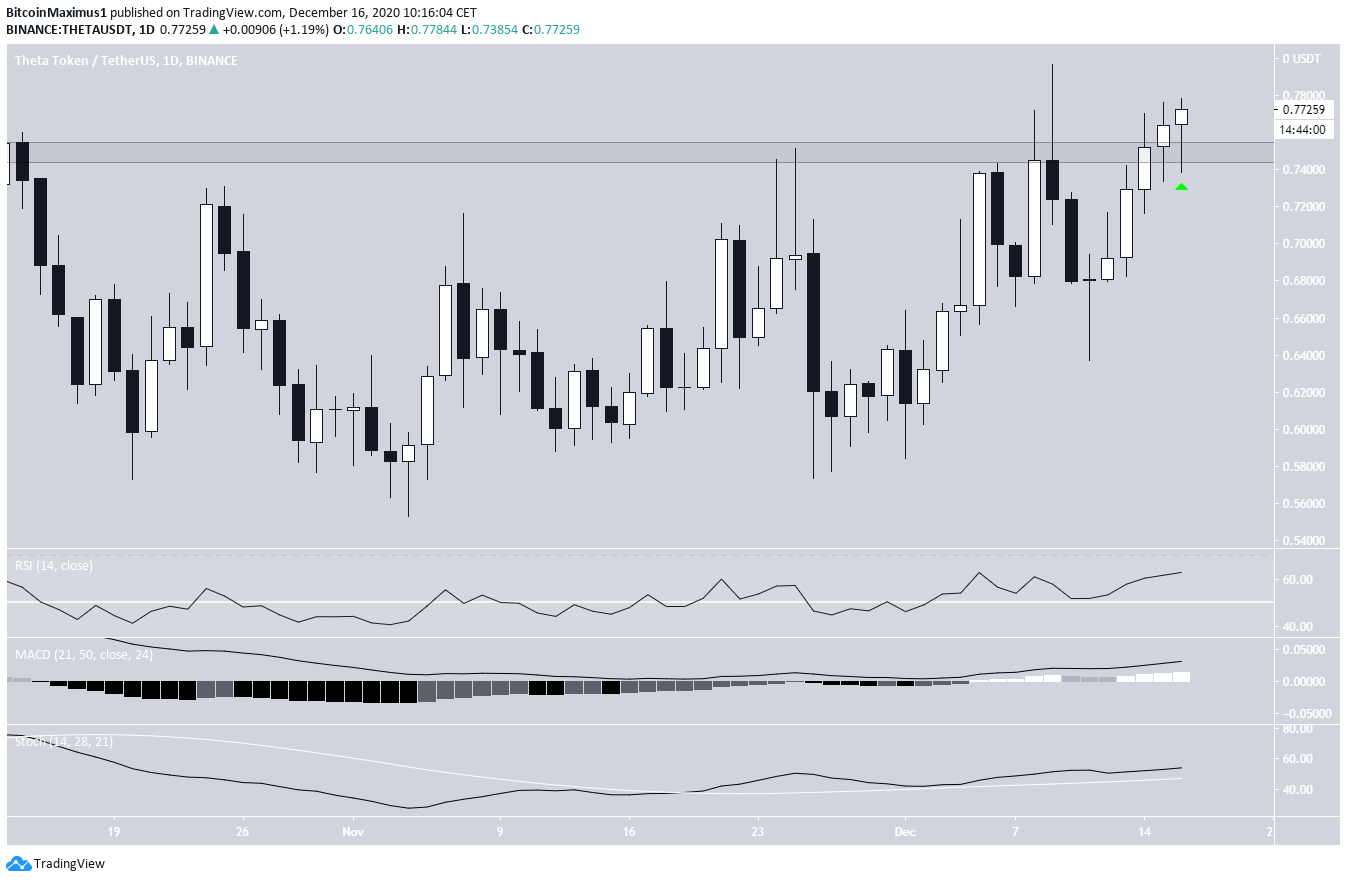
The daily time-frame allows us to isolate the main resistance area at $0.76 and shows that the price has moved and reached a close above it. Furthermore, it has now validated it as support (green arrow).
Technical indicators are clearly bullish. The MACD, RSI, and Stochastic oscillator are all increasing. Despite this, there is no discernible structure in place.
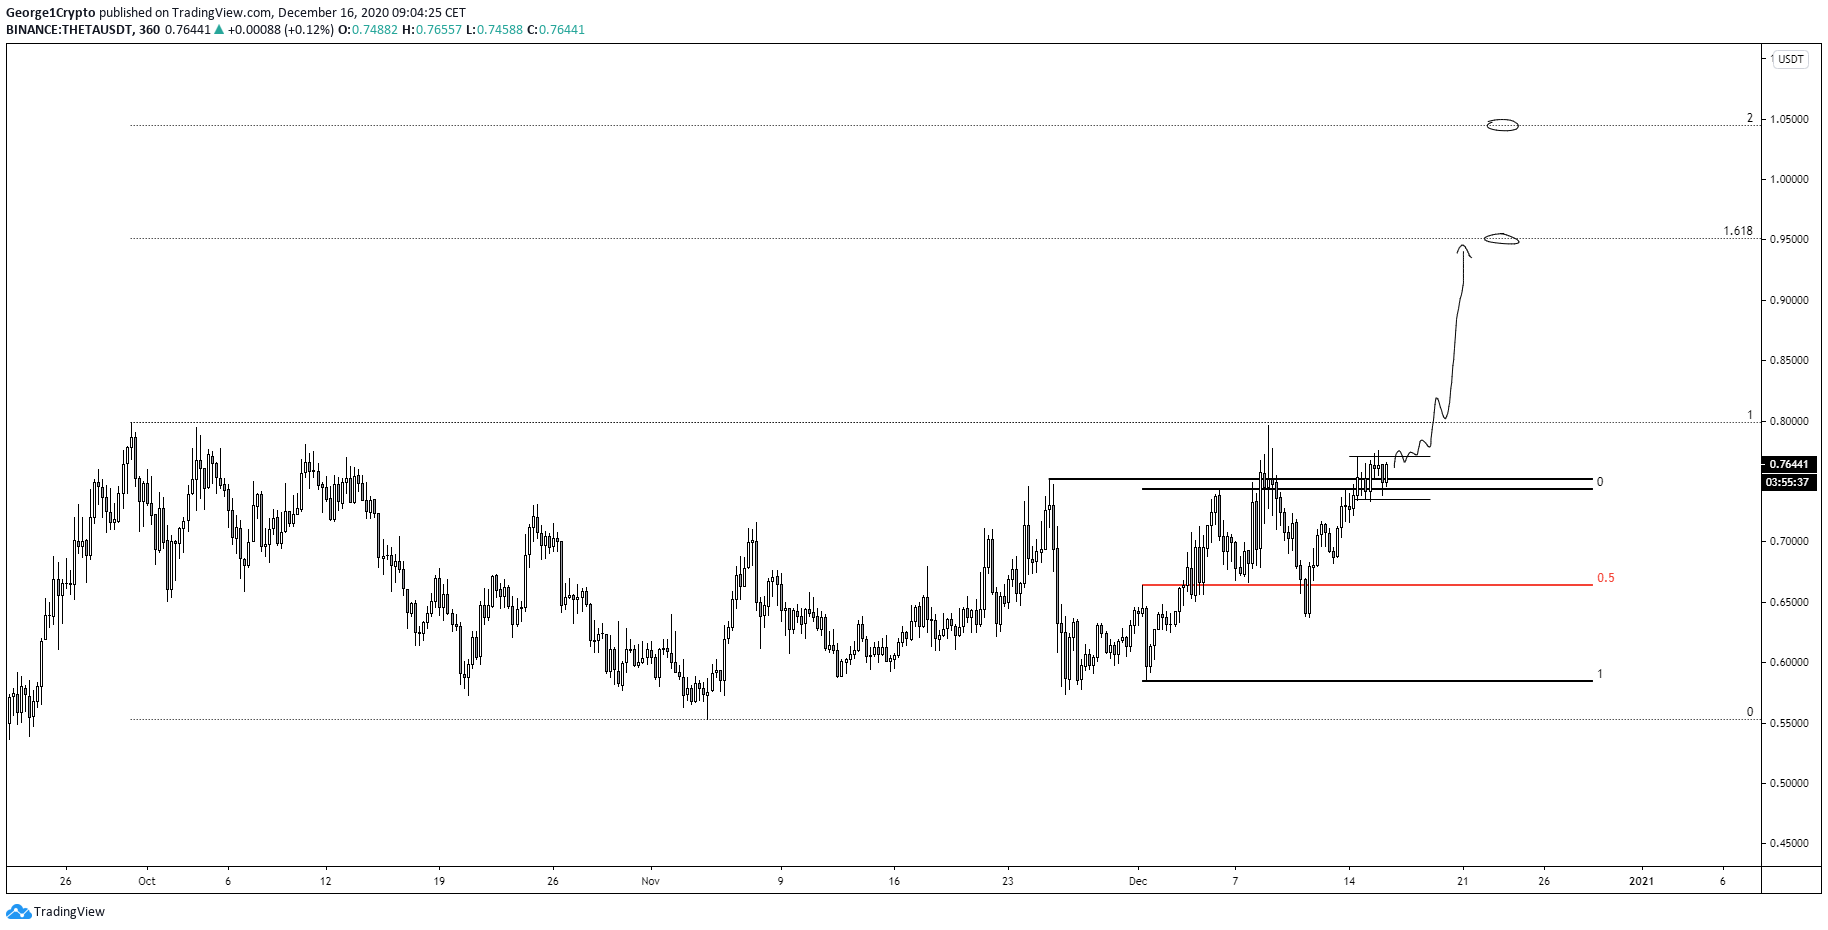
Cryptocurrency trader @George1trader outlined a THETA chart, noting that the price is consolidating above the range high and is expecting a very rapid upward movement to unfold.
This fits with the readings from the daily time-frame.
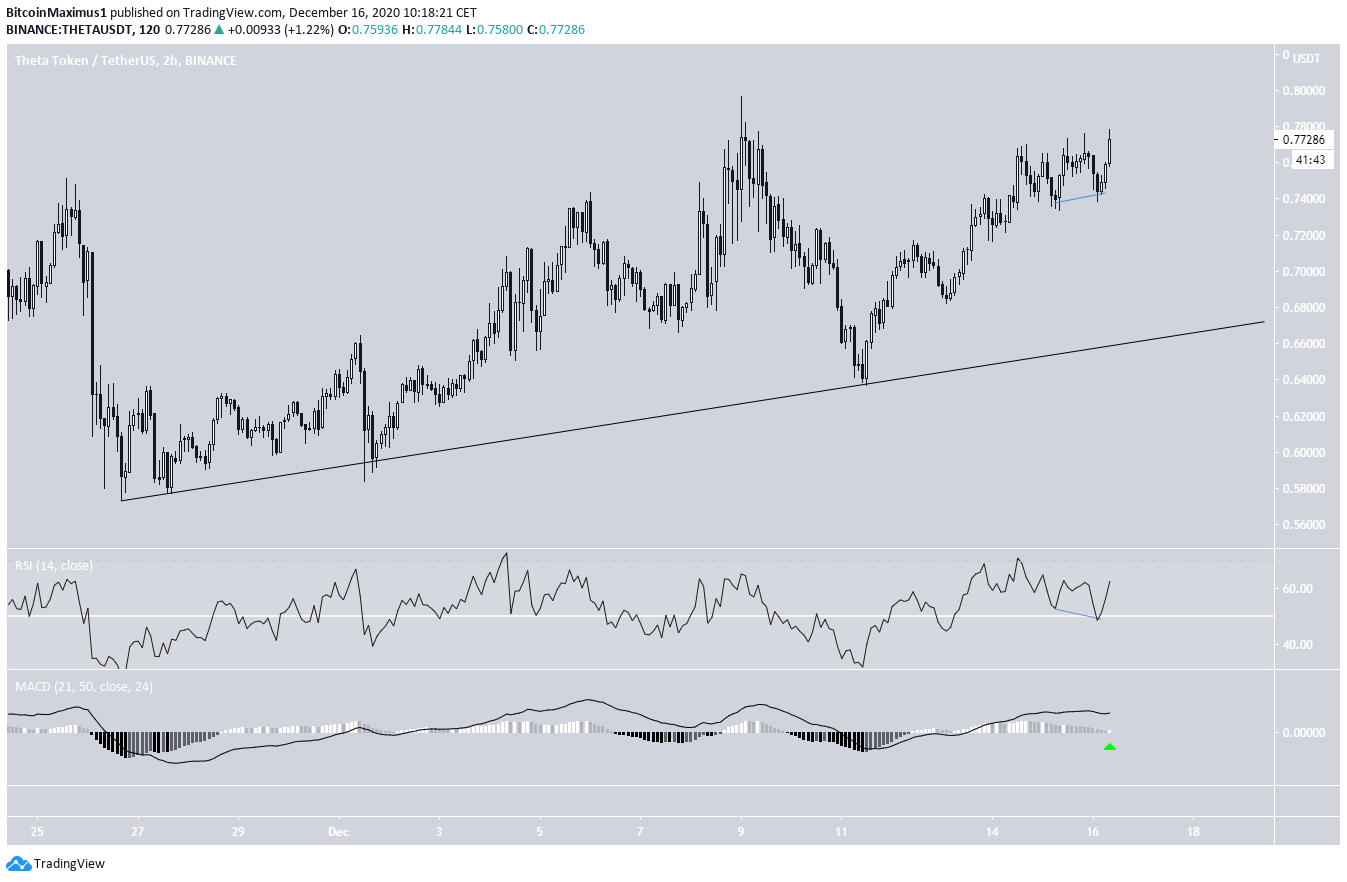
A look at the two-hour chart also supports this possibility, since the RSI has generated a hidden bullish divergence and the MACD looks to be reversing.
In addition, THETA is following an ascending support line, which is currently at $0.065.
THETA/BTC
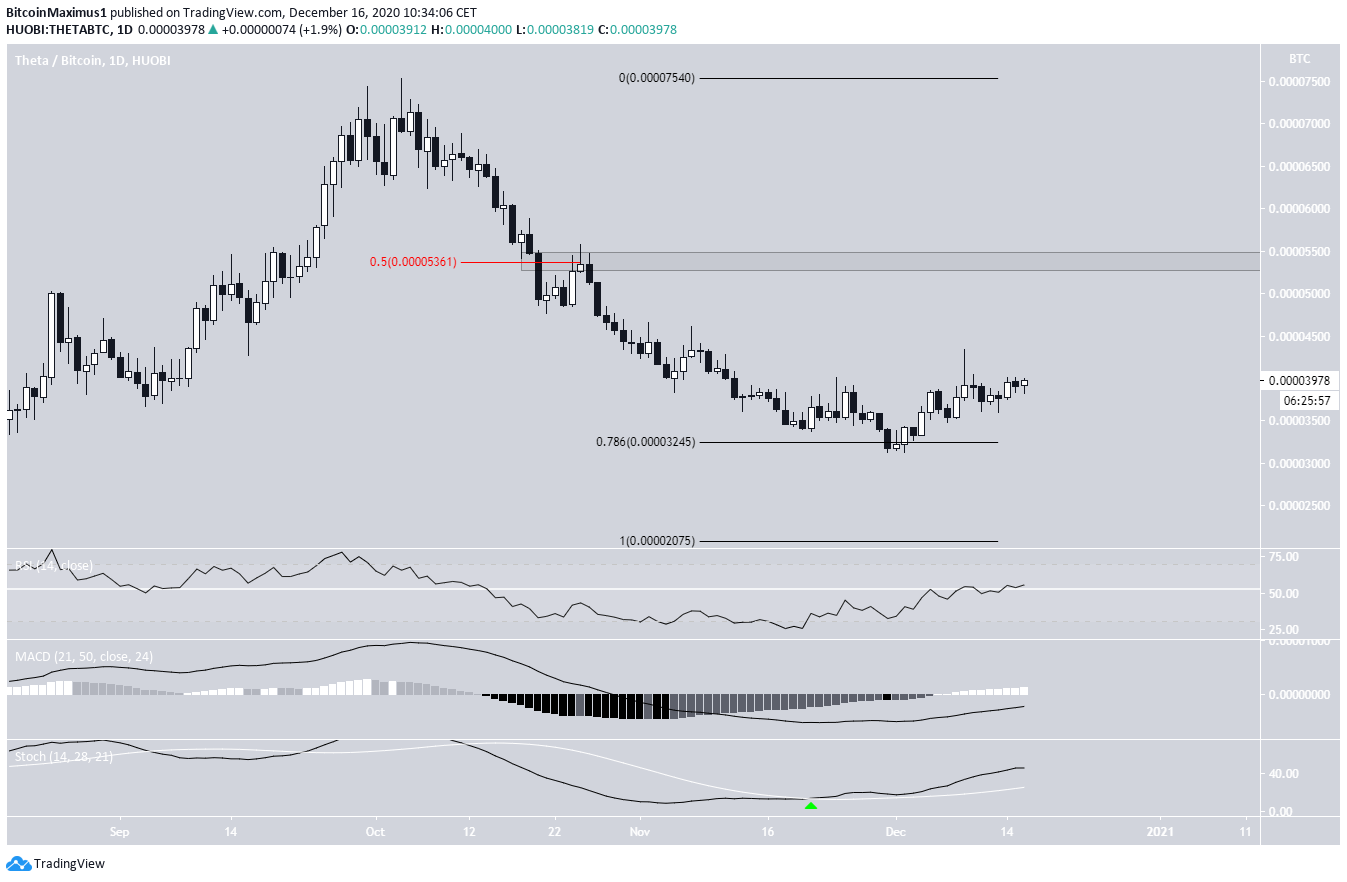
The THETA/BTC price reached a low of 3,132 satoshis on Nov. 3, just below the 0.786 Fib retracement of the entire downward move.
This proved to be just a deviation, as THETA almost immediately reversed its trend and is now moving upwards.
Technical indicators are bullish and support the continuation of this upward move.
The closest resistance area is found at 5,360 satoshis, which is both the 0.5 Fib retracement level and a horizontal resistance area.
Conclusion
THETA is expected to soon break out and make a new all-time high, possibly moving towards $1.17. Similarly, its BTC pair is expected to move towards 5,360 satoshis.
For BeInCrypto’s latest Bitcoin (BTC) analysis, click here!
Disclaimer: Cryptocurrency trading carries a high level of risk and may not be suitable for all investors. The views expressed in this article do not reflect those of BeInCrypto.
The post THETA Zones In on Setting a New All-Time High appeared first on BeInCrypto.


![Decentraland: Review & Beginner's Guide [current_date format=Y] 35 Decentraland: Review & Beginner's Guide](https://cryptheory.org/wp-content/uploads/2020/11/decentraland-02-gID_7-300x150.jpg)