XTZ Continues Consolidation Above Long-Term Support
2 min readTable of Contents
The Tezos (XTZ) price is consolidating above a long-term support line and area. However, there are no bullish reversal signs to suggest that an upward move will ensue after the consolidation is complete.
Long-Term Support
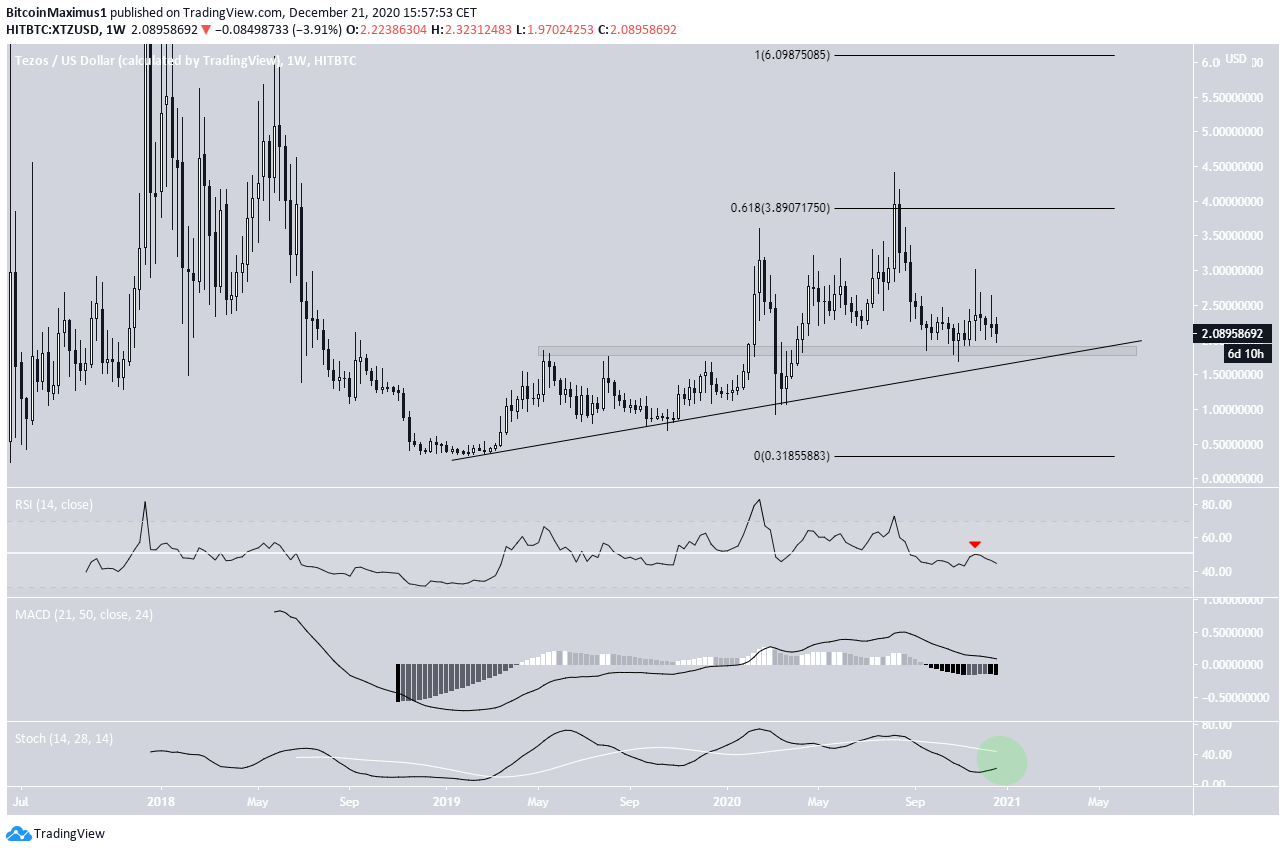
The XTZ price has been following an ascending support line since Feb 2019, when it was trading at $0.34. It is currently approaching the line for the fourth time.
In addition, this line coincides with the $1.80 support area, above which it has been trading since breaking out in March.
Technical indicators are neutral, providing mixed signals. While the RSI has fallen below the 50 line and validated it as resistance (shown with the red arrow below), the MACD is still above 50 and the Stochastic oscillator is moving upwards.
In any case, the trend is likely bullish as long as the price is trading above this support area/line.

Trend Remains Unclear
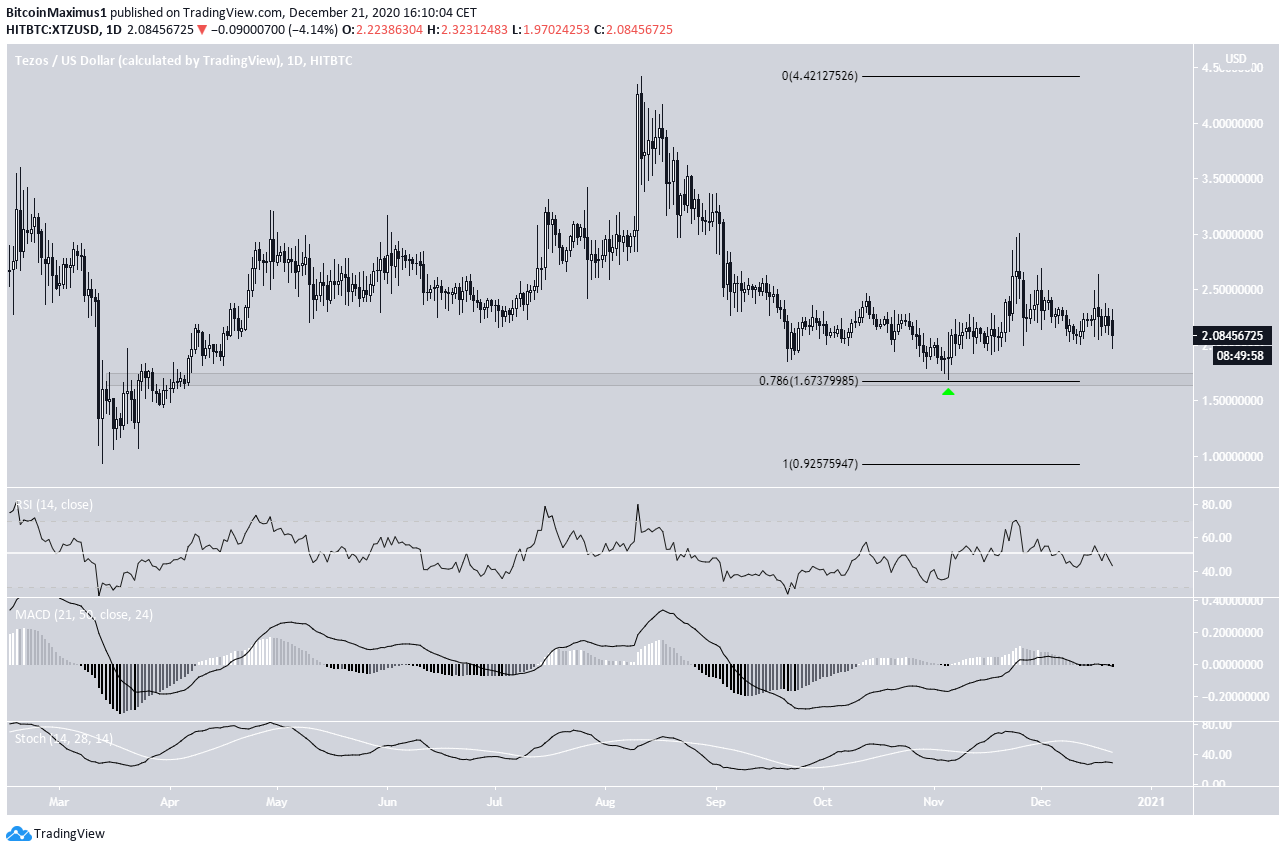
The daily chart does little to provide clarity as to the direction of the trend.
While XTZ has clearly bounced at the 0.786 Fib support at $1.67, technical indicators are ambiguous. The RSI is moving above and below 50, indicative of consolidation. The MACD and Stochastic Oscillator do not give any confirmation signals.
However, since the $1.67 – $1.85 area is a strong support level on multiple time-frames, XTZ is likely bullish as long as it’s above this area.

XTZ/BTC
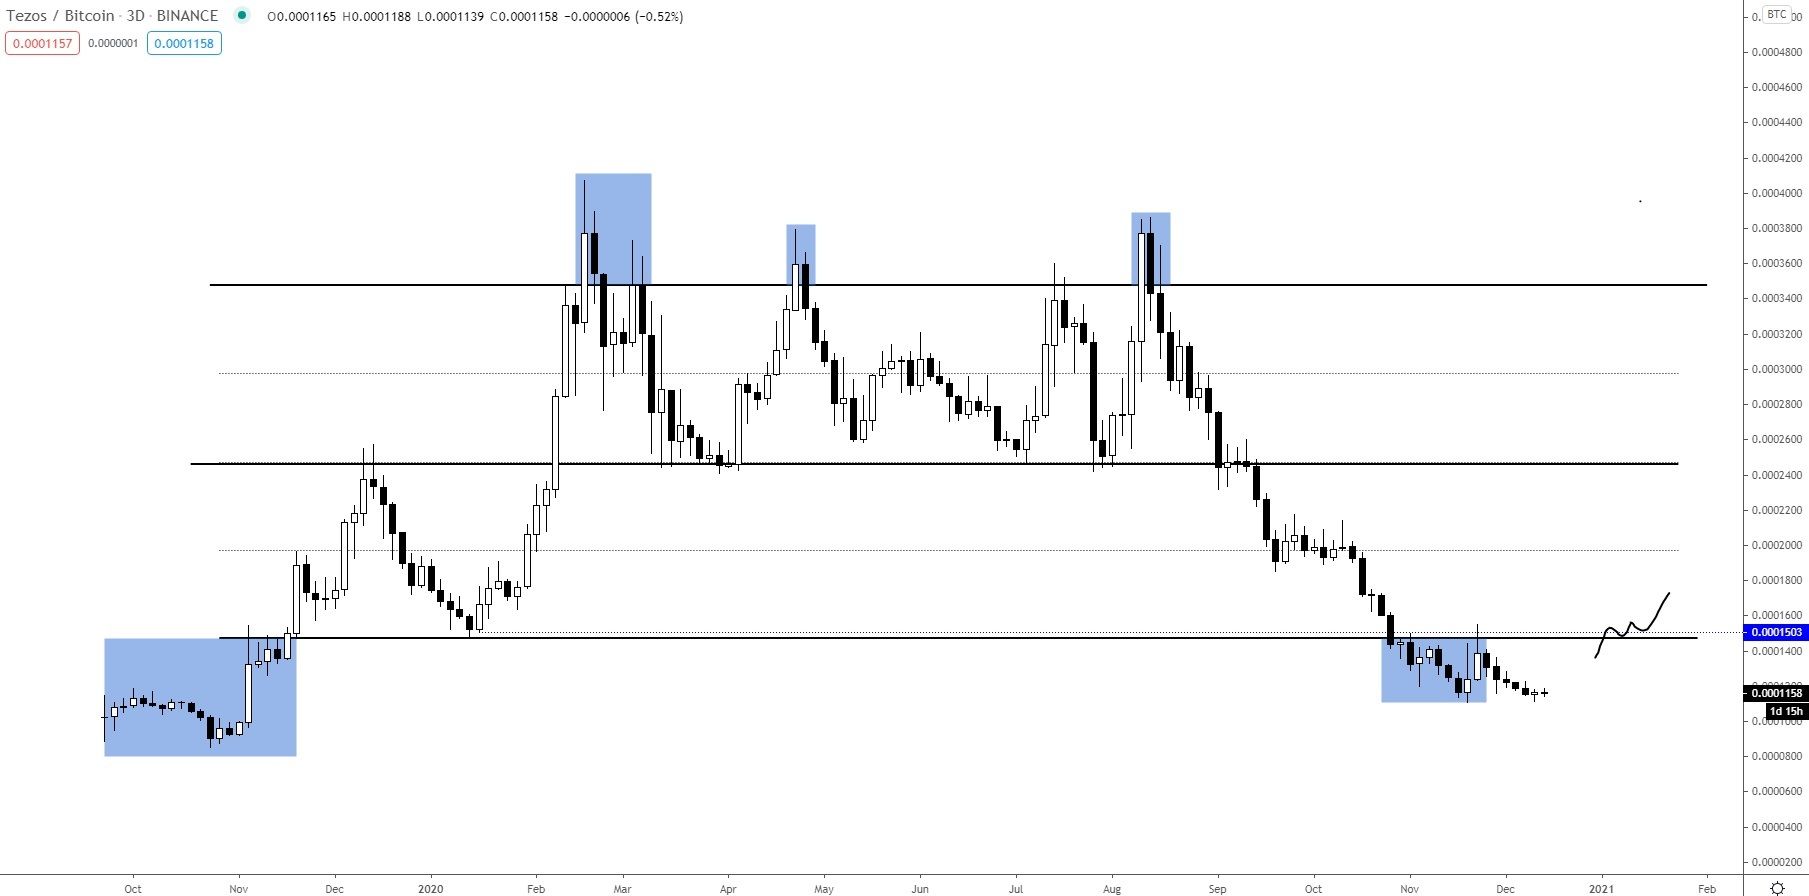
Cryptocurrency trader @TheEurosniper outlined an XTZ/BTC chart which shows that it has deviated below the range low. Once the range low is reclaimed, he expects a significant upward movement.

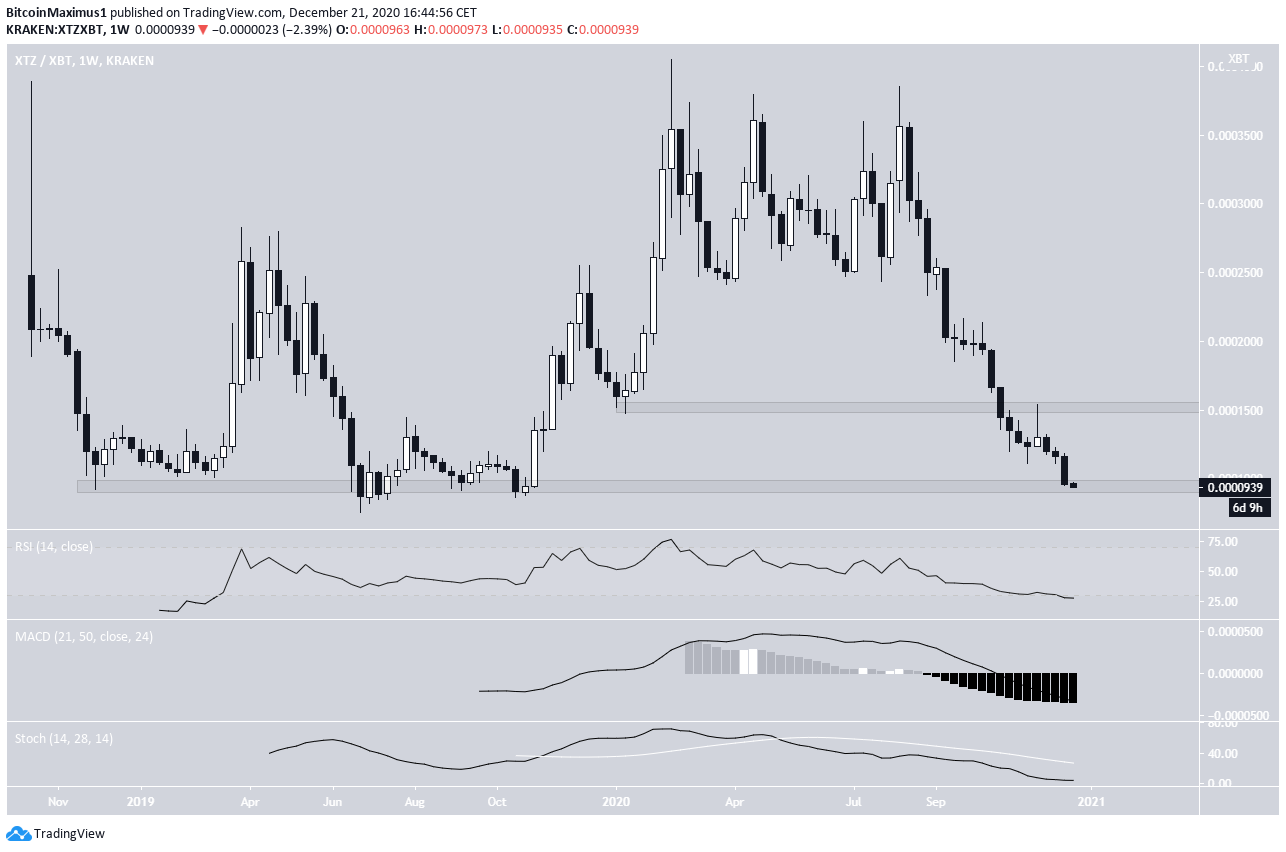
It is indeed true that XTZ is trading very close to its all-time low levels at 9500 satoshis. It reached the all-time low at 7520 sats in June 2019.
However, there are no reversal signs despite indicators showing that the rally is oversold, so it’s possible that XTZ continues falling.
The closest resistance area is at 1500 satoshis.

Conclusion
To conclude, despite trading just above a crucial support area, the direction of the trend for XTZ/USD is unclear.
Similarly, XTZ/BTC is trading at a long-term support near its all-time lows but has not yet provided any bullish reversal signs.
For BeInCrypto’s latest Bitcoin (BTC) analysis, click here!
Disclaimer: Cryptocurrency trading carries a high level of risk and may not be suitable for all investors. The views expressed in this article do not reflect those of BeInCrypto.
The post XTZ Continues Consolidation Above Long-Term Support appeared first on BeInCrypto.


![Decentraland: Review & Beginner's Guide [current_date format=Y] 29 Decentraland: Review & Beginner's Guide](https://cryptheory.org/wp-content/uploads/2020/11/decentraland-02-gID_7-300x150.jpg)