Bitcoin Wave Count Suggests a Top on the Horizon
3 min readTable of Contents
Bitcoin (BTC) has been increasing significantly since the beginning of September.
While it seems certain that Bitcoin is nearing the top of its upward movement, the lower time-frame count is not clear. This provides some uncertainty in regards to the length and depth of a potential correction.
Bullish Bitcoin Scenario
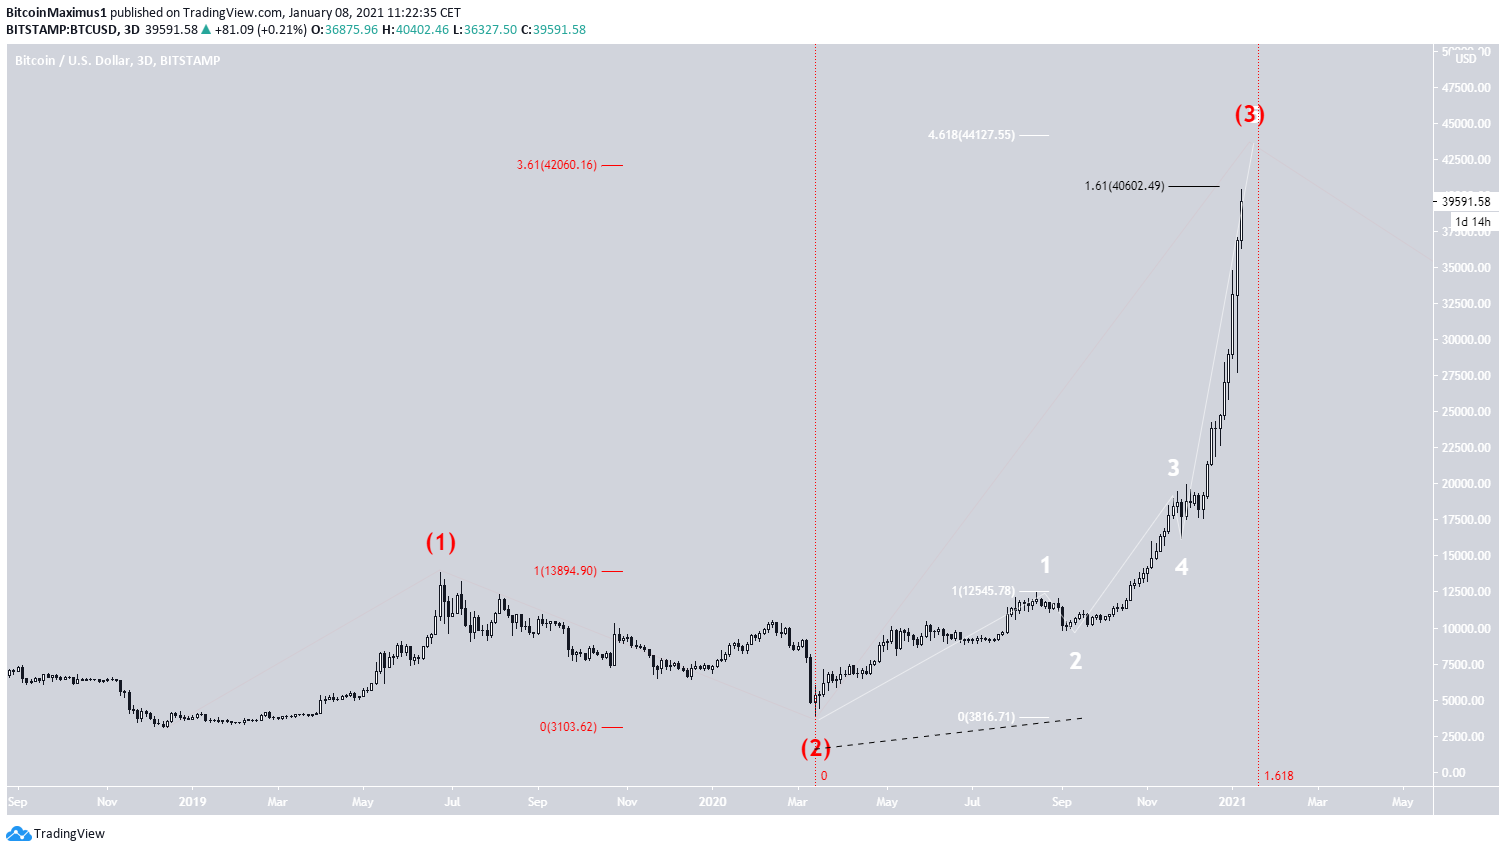
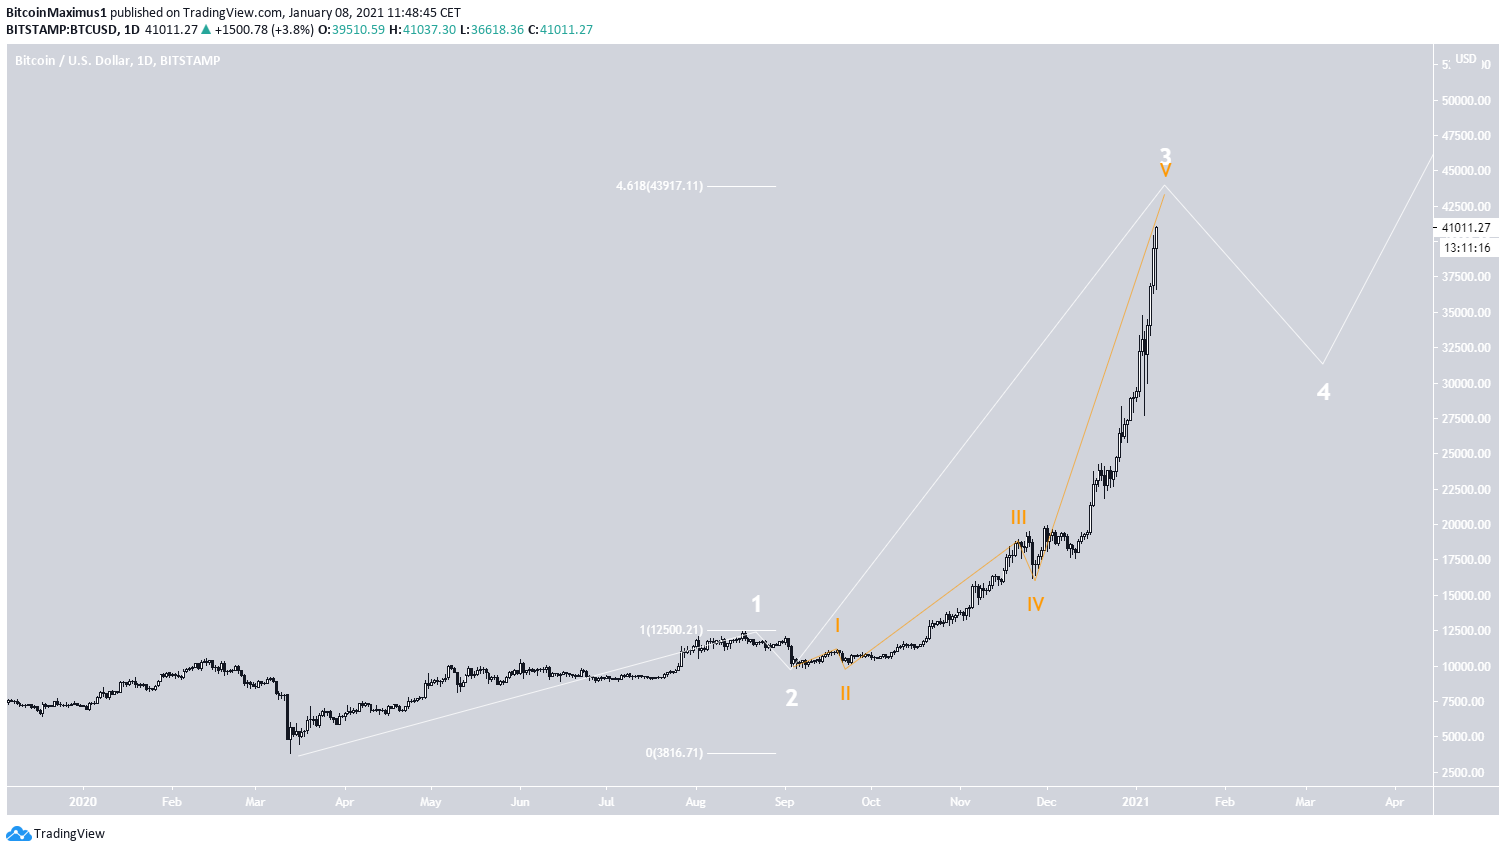
Due to the shape of the price movement, what seems certain is that BTC is in cycle wave 3 (shown in red below). It completed cycle waves 1-2 after the $3,122 low in December 2018 and began cycle wave 3 in March 2020.
If correct, BTC is in wave 5 (white) of this cycle wave. A likely target for the top of the move is found between $40,602-$44,127. The targets are found as follows:
- $40,602 – 1.61 Projection of waves 1-3 (black)
- $42,060 – 3.61 Fib extension of cycle wave 1 (red)
- $44,127 – 4.61 Fib extension of wave 1 (white)
Comparing the time it took to complete cycle wave 1 we can make the assumption that the top is likely to be reached around Jan. 19. This would mean that cycle wave 3 took 1.61 times the time it took to complete cycle wave 1.
The only issue with this count seems to be the relatively small waves 2 and 4 (white). However, there is sufficient alternation between them for this to be a valid count.
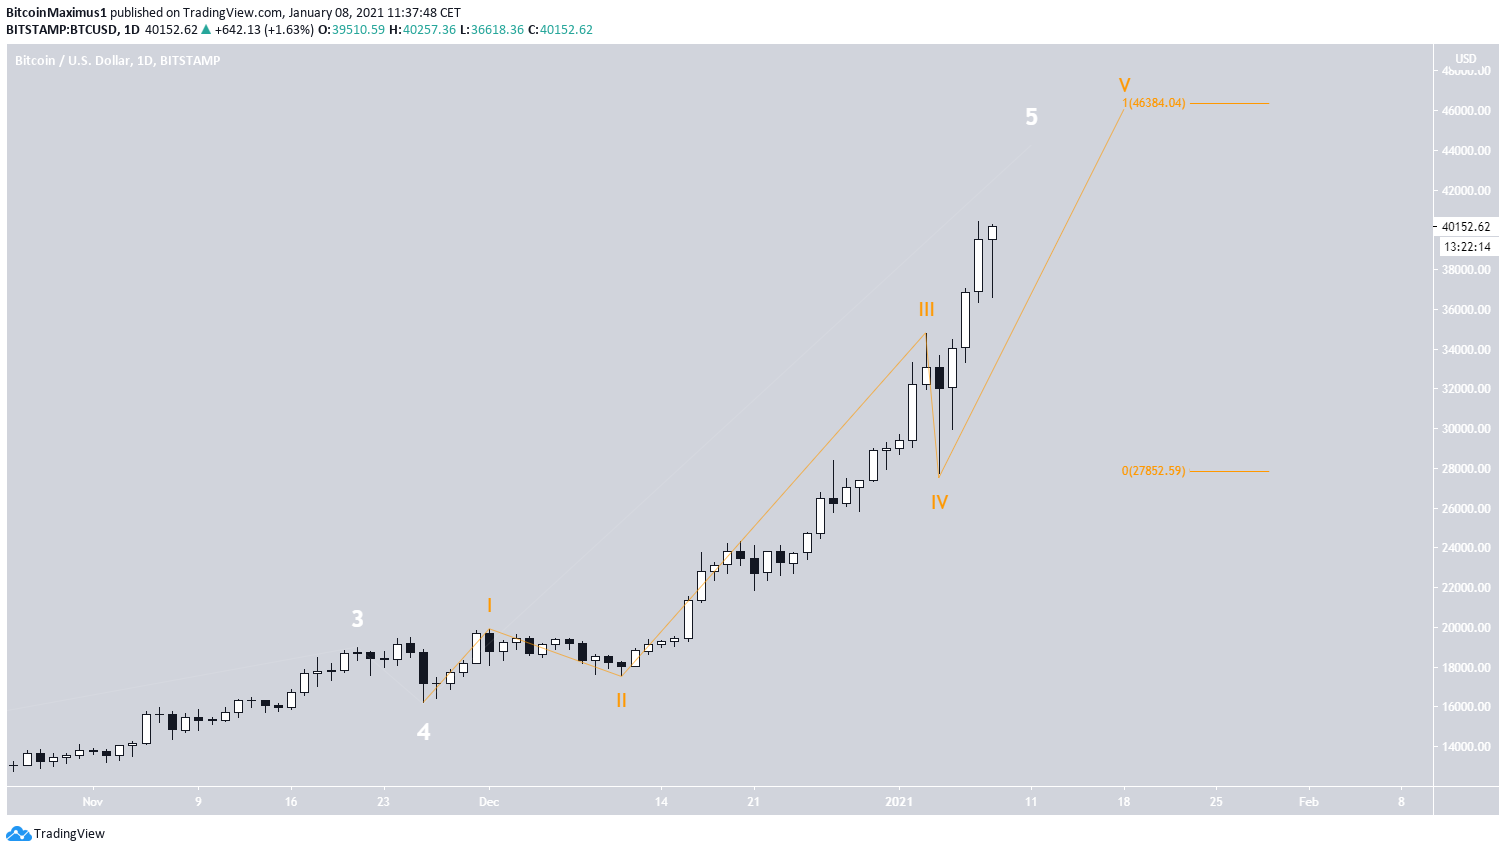
The sub-wave count for wave 5 is shown in orange indicates that BTC is in sub-wave 5.
The target found using sub-waves is $46,384.
Even More Bullish Scenario
Cryptocurrency trader @TheTradingHubb outlined two possible BTC counts, one bullish and the other even more bullish.
BeInCrypto outlined the first option above, while the second is shown in the image below.
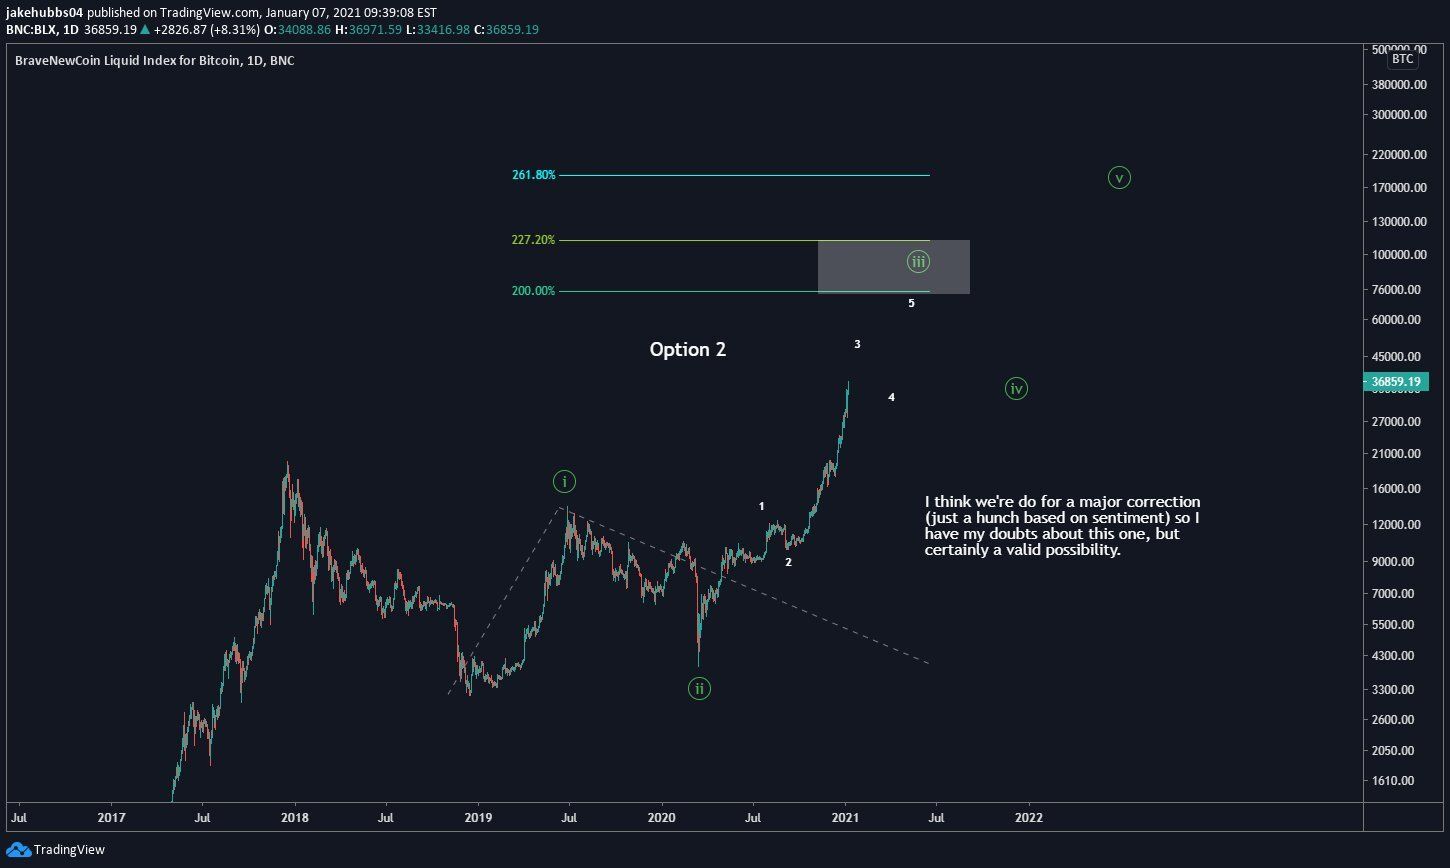
The difference between these counts is that this one has BTC being in wave 3 of cycle wave 3, instead of wave 5 of cycle wave 3.
In this case, the ensuing correction would likely be smaller before BTC makes another high above $50,000. Afterwards, the end result would be that cycle wave 5 could go much higher.
What does not look right in this count is the massive discrepancy in magnitude between waves 1 and 3. Furthermore, the longer the current upward move continues without a significant correction, the less likely this count becomes.
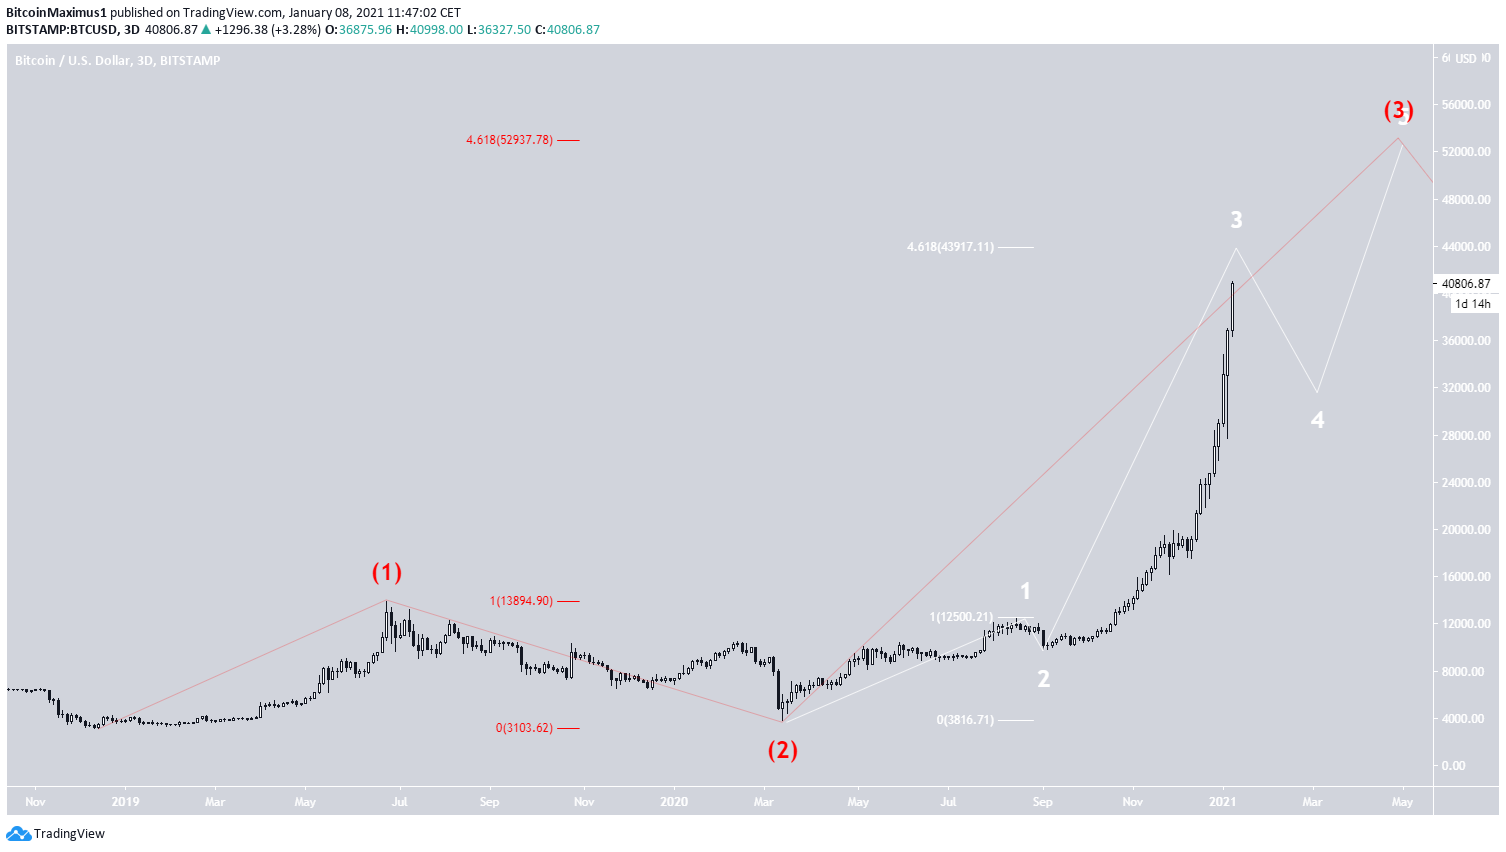
In any case, the sub-wave count also suggests that BTC is nearing a top, which would likely contain a smaller correction than the previous count.
Short-Term BTC Movement
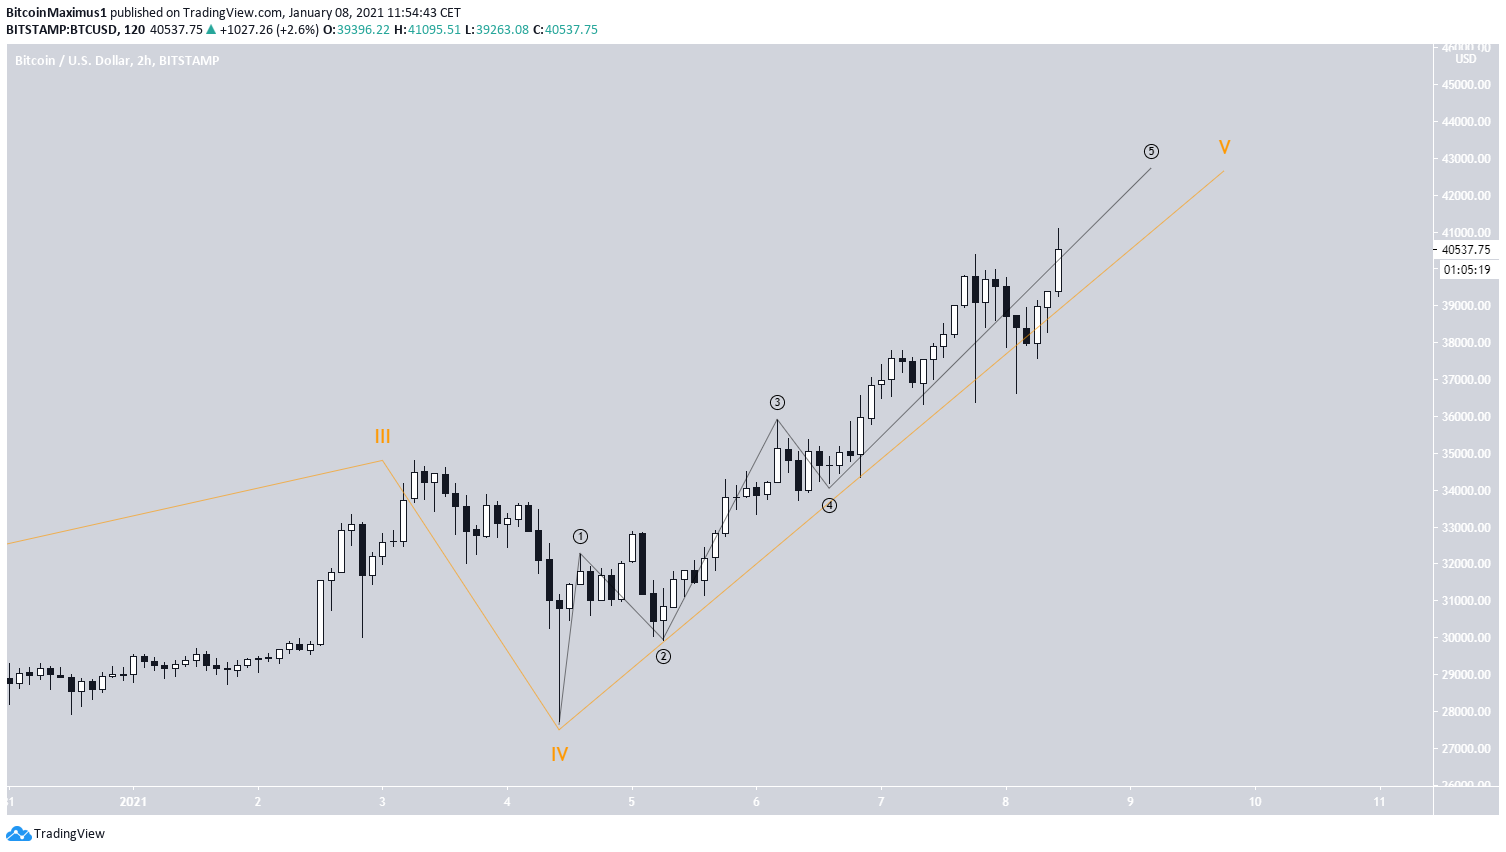
Lower time-frames also show that BTC is in minor sub-wave 5 (black) of sub-wave 5, supporting the possibility that BTC is approaching a top.
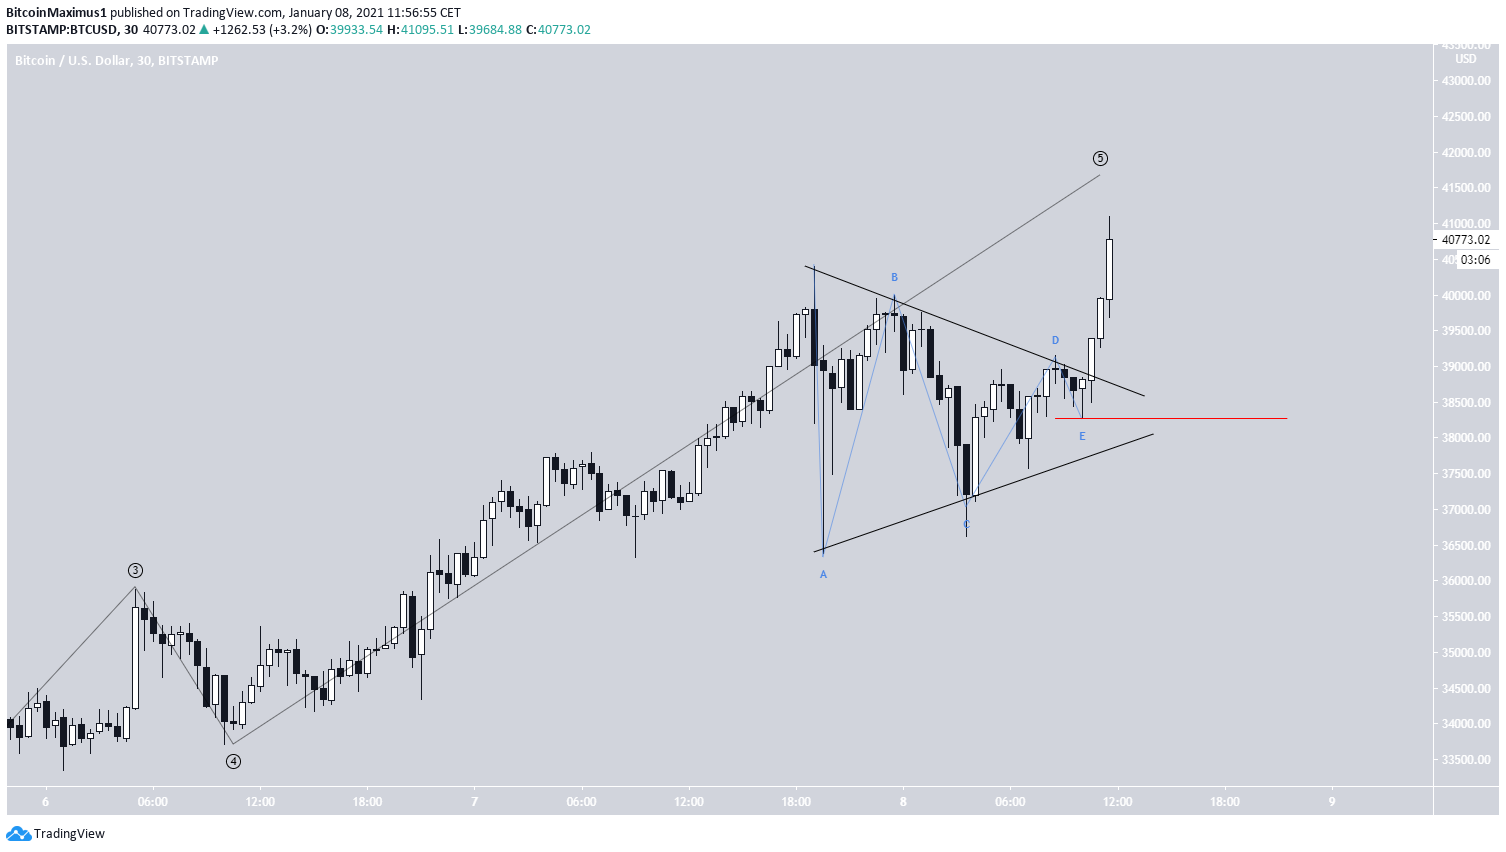
An even closer look at the movement shows that resembles a fourth wave triangle. In this case, once the low of $38,212 is taken out, it could act as confirmation that the correction has begun.
Conclusion
The Bitcoin price is expected to reach a top between the current price and $44,127-$46,384 before beginning a significant correction.
While BTC is almost certainly in a long-term cycle wave 3, the shorter-term count is not yet confirmed.
For BeInCrypto’s latest Bitcoin (BTC) analysis, click here!
Disclaimer: Cryptocurrency trading carries a high level of risk and may not be suitable for all investors. The views expressed in this article do not reflect those of BeInCrypto.
The post Bitcoin Wave Count Suggests a Top on the Horizon appeared first on BeInCrypto.


![Decentraland: Review & Beginner's Guide [current_date format=Y] 38 Decentraland: Review & Beginner's Guide](https://cryptheory.org/wp-content/uploads/2020/11/decentraland-02-gID_7-300x150.jpg)