Chainlink: The 10 largest whales now hold 63.3% of LINK’s circulation supply
1 min read
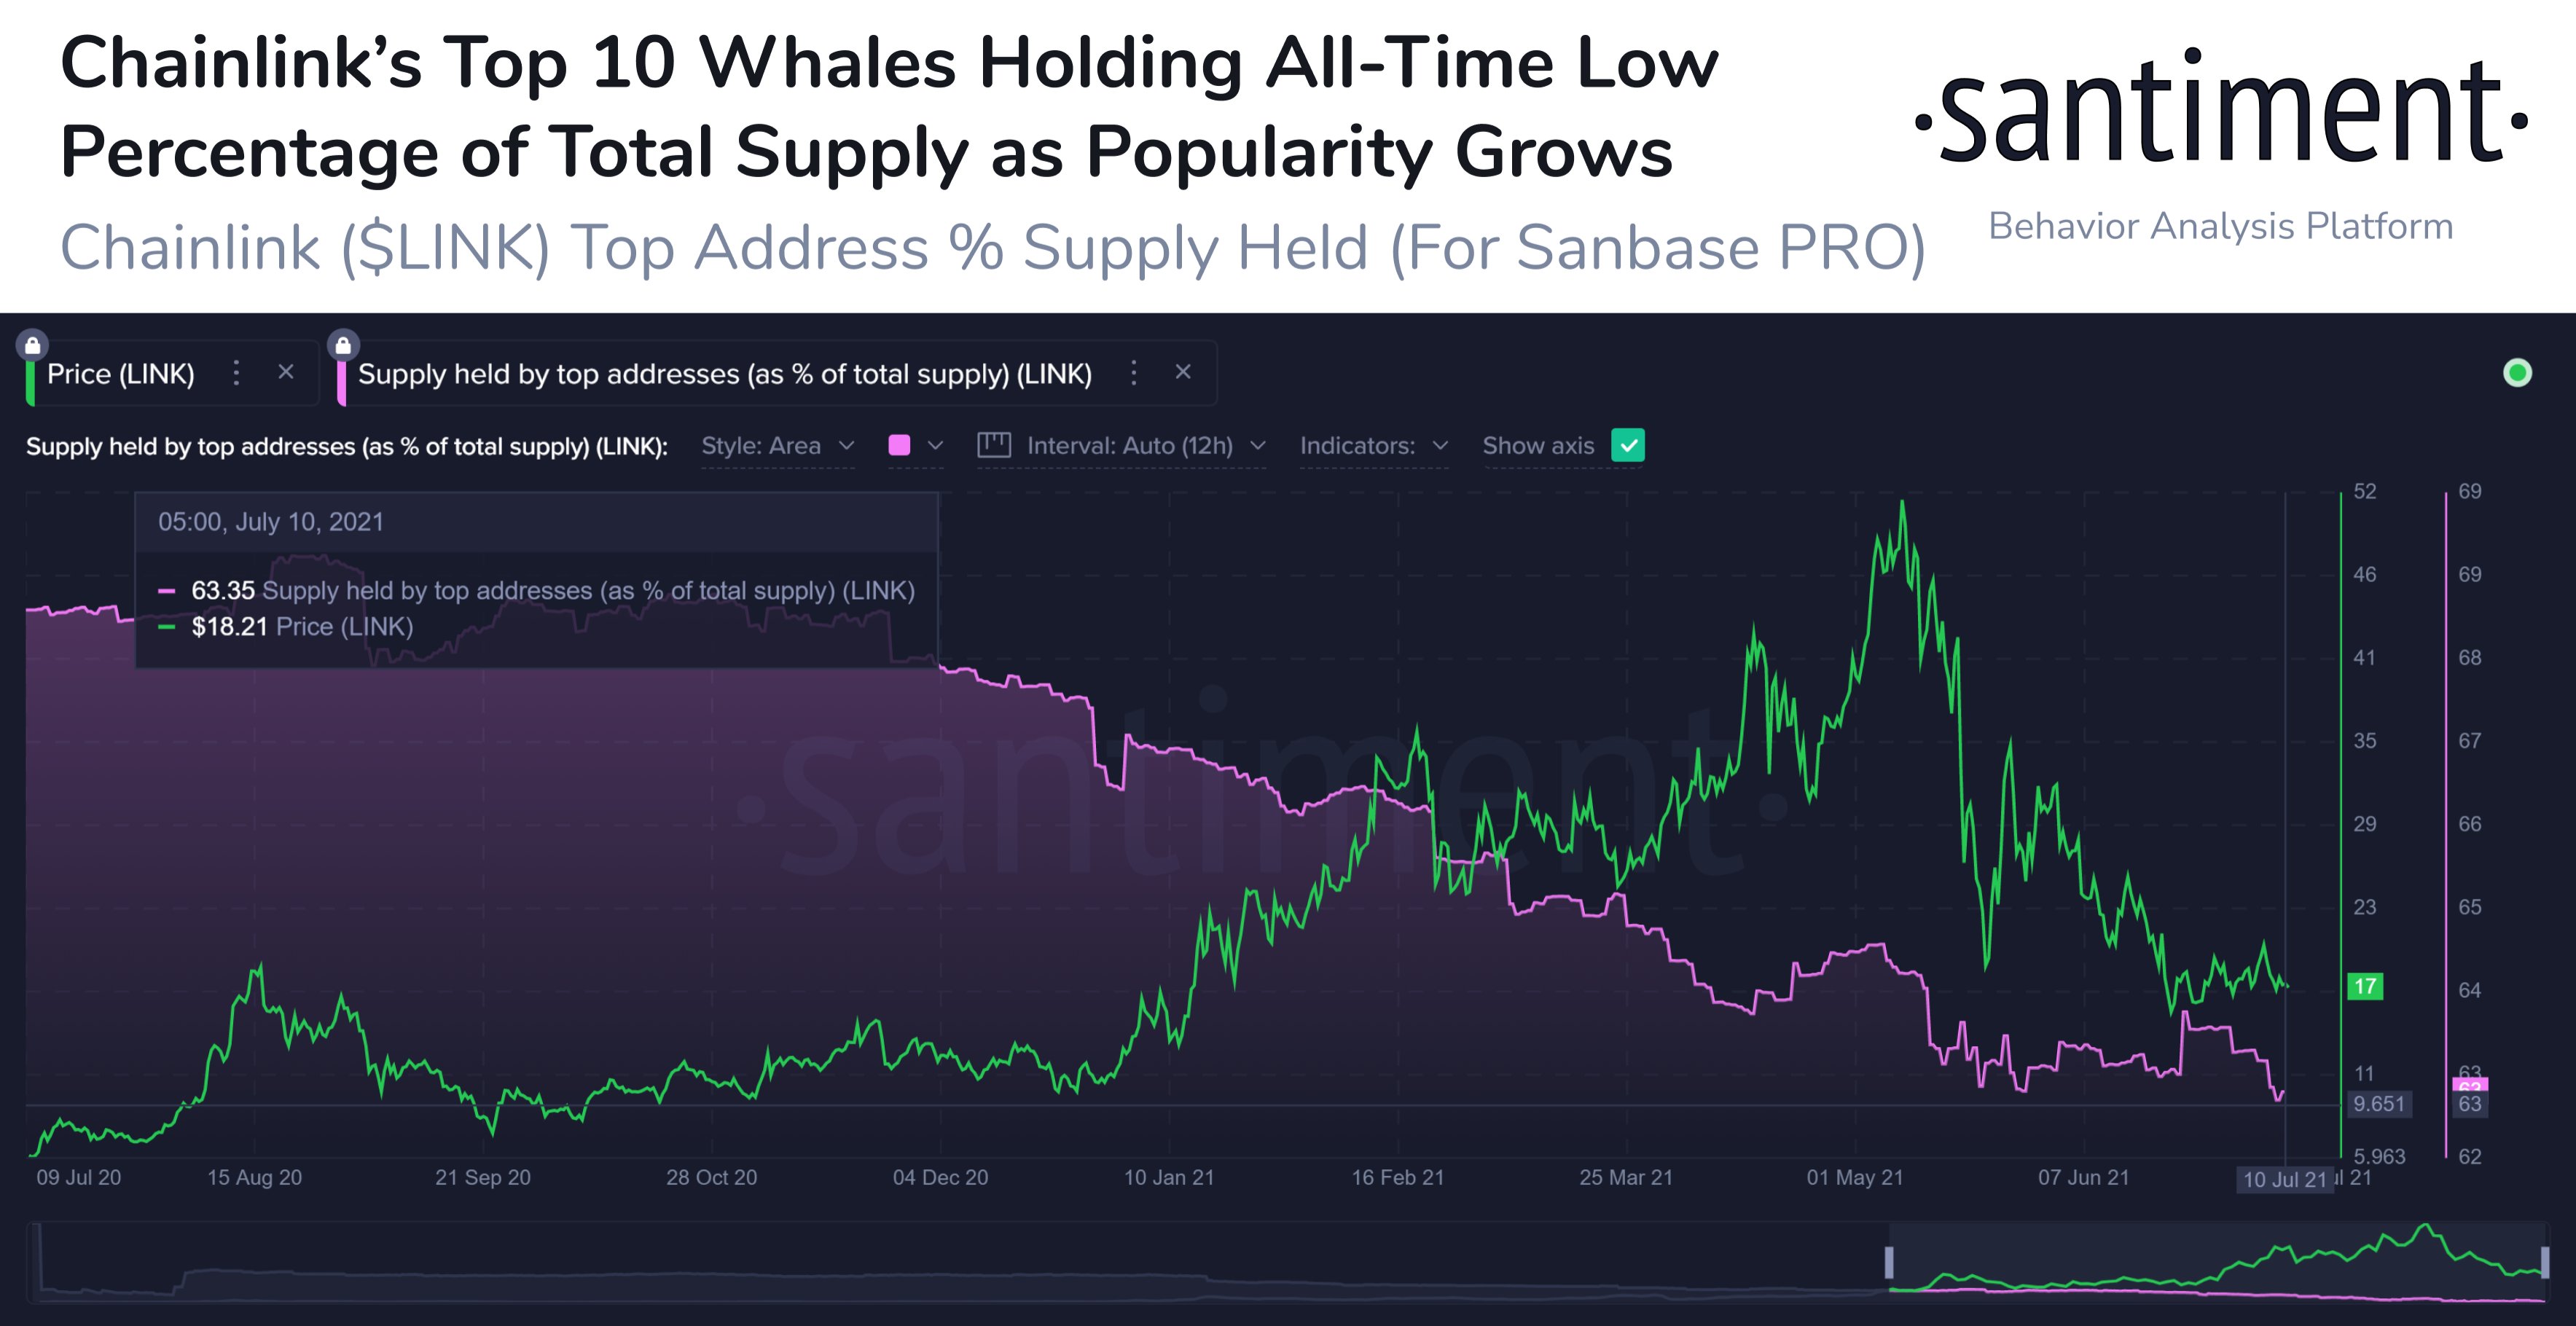
The top 10 largest whales now hold 63.3% of the circulating supply Chainlink (LINK). This emerges from data shared by the Santiment platform, which also indicates that this is still the lowest percentage of the circulating LINK offering that holds the 10 largest whales since the project began in 2017.

From the chart shared above, it can be seen that in January of this year, these whales held about 67.5% of the circulating LINK offer. In addition, the same whales held about 69% during the fourth quarter of 2020. We seem to see an encouraging and continuing trend of redistribution of LINK from whales to other holders.
Chainlink price analysis
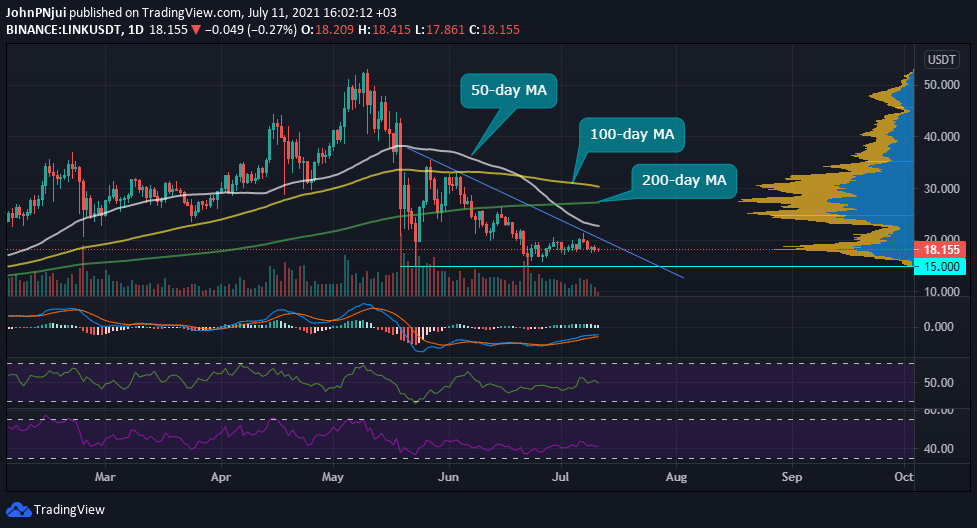
As for the price action, Chainlink is still in bearish territory as it trades below the 50-day, 100-day and 200-day moving averages, as shown in the chart below. In addition, Chainlink is currently trading in a downward triangle with a $ 15 support area that was created on May 23 and June 22.
The following can also be observed from the graph:
- Chainlink has additional support at the current level of $ 18
- Daily trading volume is declining
- The daily MACD also confirms the reduced interest in Chainlink trading
- Daily MFIs and RSIs are in neutral territory
- The Cross of Death is still in play, at least until LINK manages to trade above the 50-day moving average
Traders and investors should be reminded to monitor sudden movements in BTC prices in both directions when trading LINK on various derivative platforms.


